AWS Database Blog
Monitor Amazon Timestream for InfluxDB performance using the Timestream for InfluxDB Metrics dashboard
You can now visualize the performance metrics of your fleet of Amazon Timestream for InfluxDB databases with the Timestream for InfluxDB Metrics dashboard. The Timestream for InfluxDB Metrics dashboard deploys an Amazon Managed Grafana dashboard to monitor how well your fleet is performing, and stores the metrics in Amazon CloudWatch. The dashboard collects the engine specific metrics available in the /metrics endpoint for your database instances. See InfluxDB OSS metrics for the complete list of metrics available from this endpoint.
The Timestream for InfluxDB Metrics dashboard adds the ability to perform trend analysis, create actionable insights, set up alerts, and automate reporting. You can configure the Timestream for InfluxDB Metrics dashboard to suit your business needs and build a robust and optimized time series workflow. In this post we walk you through how to deploy the Timestream for InfluxDB Metrics dashboard to start monitoring the performance of your fleet of Timestream for InfluxDB databases.
Solution overview
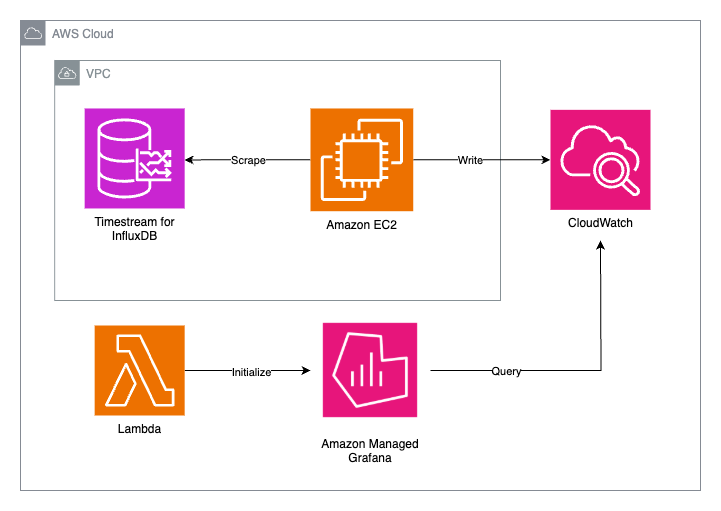
The Timestream for InfluxDB Metrics dashboard is hosted in your AWS account deployed by AWS CloudFormation. The CloudFormation stack is composed of an Amazon Elastic Compute Cloud (Amazon EC2) instance, an AWS Lambda function, and an Amazon Managed Grafana workspace.
The following diagram illustrates the components deployed with the CloudFormation stack for the Timestream for InfluxDB Metrics dashboard.
The Timestream for InfluxDB Metrics dashboard is built using the AWS Cloud Development Kit (AWS CDK), and the CloudFormation stack is deployed to your AWS account using the AWS CDK CLI.
The EC2 instance installs and launches Telegraf; a lightweight tool for collecting, transforming, and sending time series data to supported platforms such as CloudWatch. Telegraf is configured to scrape each Timestream for InfluxDB instance metrics endpoints and push the scraped metrics to CloudWatch. A limitation of the Timestream for InfluxDB Metrics dashboard is that Telegraf ignores metrics of type histogram as the data type is not supported in CloudWatch.
When you deploy the Timestream for InfluxDB Metrics dashboard to your AWS account, the Lambda function initializes and configures the Grafana dashboard with the panels required for displaying the Timestream for InfluxDB performance metrics data. The Lambda function is executed only once per deployment to initialize the dashboard.
The Grafana dashboard queries CloudWatch for metrics such as CPU utilization, memory utilization, and bucket cardinality. The dashboard is configured with a preset of panels for basic usage, and additional panels can be added for the metrics available in the InfluxDB OSS metrics documentation.
Please note that you are responsible for any costs incurred from AWS services when following this example.
Context options
The Timestream for InfluxDB Metrics dashboard uses context variables to configure the AWS resources within your AWS account. When deploying the Timestream for InfluxDB Metrics dashboard, one context option is required: the InfluxDBIds. This is a comma separated list of Id(s) for Timestream for InfluxDB instances. The following context options are optional when deploying the Timestream for InfluxDB Metrics dashboard:
- GrafanaWorkspaceName – The name used for the Grafana workspace. The context defaults to
InfluxDBMetricsDashboardWorkspace. - CloudWatchDatasourceName – The name of the data source used for populating the dashboard. This context option defaults to
Amazon CloudWatch Data Source. - DashboardName – The name used for the Grafana dashboard. The context defaults to
InfluxDB Performance Dashboard. - TelegrafSshCidr – The CIDR IP address used in a rule to allow SSH access to the EC2 instance running Telegraf. If the context isn’t provided when deploying the application, no SSH rule will be added to the EC2 instance security group.
- EnableHighResolutionMetrics – Set to
trueto ingest metrics to CloudWatch with an interval of every 10 seconds. The default ingestion rate is set to 1 minute when this context isn’t configured. - TelegrafEc2Tags – List of tags to apply to the EC2 instance running Telegraf in the format
"key1:val1,key2:val2". - GrafanaWorkspaceTags – List of tags to apply to the Grafana workspace in the format
"key1:val1,key2:val2".
Prerequisites
To perform the solution, complete the following prerequisites:
- Create your AWS account – Create an AWS account. Refer to Create an AWS account if you don’t already have an account set up.
- Create an AWS SSO user – Create an AWS SSO user to login to the Grafana workspace. See Setting up single sign-on (SSO) with IAM Identity Center to create an SSO user.
- Create your InfluxDB instance – If you don’t already have one or more Timestream for InfluxDB instances within a single virtual private cloud (VPC), create a new instance with the Getting started with Timestream for InfluxDB guide.
- Install required tools – Ensure you have the following tools installed on your local machine:
- Git (version 2.0 or later) – Required for cloning the repository. Install from git-scm.com.
- Go (version 1.22 or later) – The programming language used build the Timestream for InfluxDB Metrics Dashboard. Install from go.dev/doc/install
- AWS Cloud Development Kit (AWS CDK) command line interface (CLI) (version 2.0 or later) – Required for deploying the AWS CloudFormation stack. Install using npm:
npm install -g aws-cdkor refer to the AWS CDK installation guide.
- Clone the repository – Refer to the Timestream tools repository to deploy the Timestream for InfluxDB Metrics dashboard.
- Configure AWS permissions – Add the following AWS Identity and Access Management (IAM) policy permissions to the IAM user that is configured with your local AWS credentials. This IAM policy contains the least privilege permissions required for deploying the Timestream for InfluxDB Metrics dashboard. Replace the following values in the IAM policy with values from your AWS account:
{region}– The AWS Region where you will deploy the CloudFormation stack.{account-id}– The AWS account ID that you’re using to deploy the CloudFormation stack.{db-instance-id}– The Timestream for InfluxDB instance ID. Add a resource for each database instance you are monitoring in the deployment.{stack-name}– The CloudFormation stack name, which if not changed by setting the context on deployment, defaults to“InfluxDBMetricsDashboard”.
Solution walkthrough
To deploy the CloudFormation stack, complete the steps in the following sections.
Retrieve InfluxDB identifiers
Complete the following steps to find the IDs for your Timestream for InfluxDB instances:
- Go to the Amazon Timestream console.
- In the navigation pane, choose InfluxDB databases.
- Copy the ID values for each InfluxDB instance within one VPC you want to monitor with the Timestream for InfluxDB Metrics dashboard.
Deployment
To deploy the Timestream for InfluxDB Metrics dashboard, use the following CDK commands and populate all required context options with the values you gathered in the previous section. To deploy the Timestream for InfluxDB Metrics dashboard to a Region other than the Region configured in your local ~/.aws/credentials file, set the environment variable AWS_REGION to the target deployment Region:
Each Timestream for InfluxDB instance used in the following commands must be within the same VPC
- Provision AWS environment with the following command (bootstrapping only needs to be done one time per account per Region):
- Deploy the application with the following command:
View the dashboard
To view the dashboard, follow the steps in the next sections.
Create a new IAM identity user
If you don’t have an AWS IAM Identity Center user, complete the following steps to create a new user:
- Navigate to the IAM Identity Center console.
- In the navigation pane, choose Users.
- Choose Add user.
- Input user details.
- Choose Next.
- Add the user to a group if you wish.
- Choose Next.
- Choose Add user.
Add your IAM Identity Center user to the workspace
Now that the dashboard has been deployed, you will need to add your AWS IAM Identity Center user to the Grafana workspace. Complete the following steps in the AWS console to add your user:
- Navigate to the Amazon Managed Grafana console.
- In the navigation pane, choose All workspaces.
- From the list of workspaces, choose the workspace named
InfluxDBMetricsDashboardWorkspace. If you altered the context for the workspace name during deployment, choose the altered workspace name. - On the Authentication tab, under AWS IAM Identity Center (successor to AWS SSO) choose Assign new user or group.
- From the list of users, select the user you want to give access to the dashboard and choose Assign users and groups.
If you want to add additional panels or edit the panels in the dashboard, you need to assign a user as admin and login to the workspace using the associated credentials.
View the dashboard
With your AWS IAM Identify Center user added to the Timestream for InfluxDB Metrics dashboard workspace, you can now view the dashboard. Follow these steps:
- Navigate to the Amazon Managed Grafana console.
- Choose the Grafana workspace URL.
- Sign in with the AWS IAM Identity Center user credentials you assigned as a viewer for the dashboard.
- Choose Dashboards in the left navigation pane.
- Choose the dashboard named InfluxDB Performance Dashboard or the alternative name if you altered the context when deploying the dashboard.
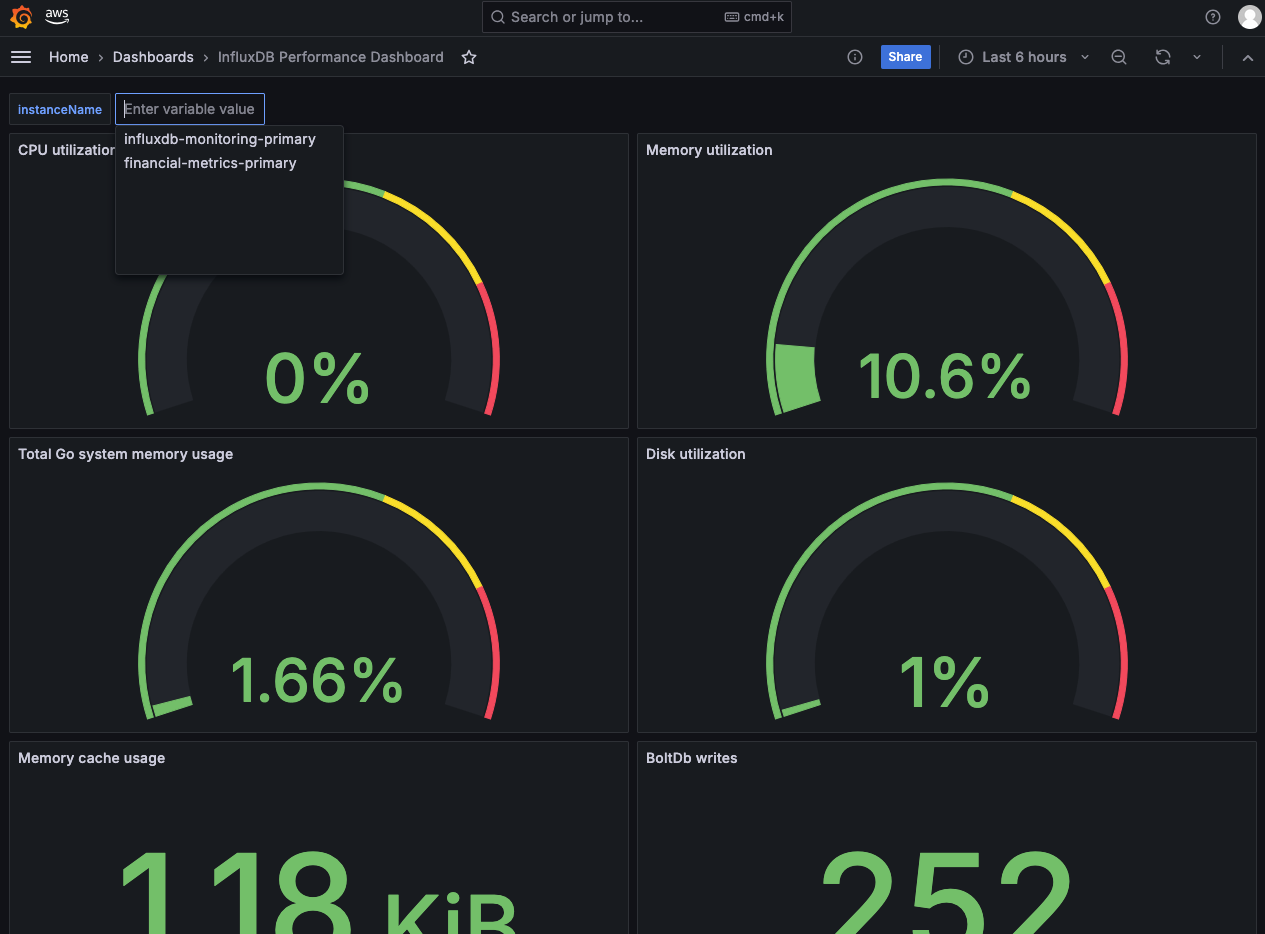
- You should now be able to view a dashboard and visualize the metrics for your Timestream for InfluxDB instance(s).
- Select the instance name under instanceName to display the panels for the Timestream for InfluxDB instance.
The following screenshot shows the base panels that are configured after the dashboard has been deployed.
Clean up resources
To clean up AWS resources created by the application during deployment, execute the following command:
Conclusion
The Timestream for InfluxDB Metrics dashboard is a straightforward and extensible solution for monitoring the performance of your Timestream for InfluxDB databases. With a single command, you have a dashboard preconfigured with included panels and metrics collected from each configured Timestream for InfluxDB instance. After you deploy the CloudFormation stack, you can tailor the dashboard for your business logic needs and unlock CloudWatch features with the metric data collected from your Timestream for InfluxDB databases.
Visit the amazon-timestream-tools GitHub repository to start monitoring your Timestream for InfluxDB performance metrics and unlock new capabilities such as data anomaly detection and system alerts.