AWS Database Blog
Scale smart, not just big: a practical guide to multi-node Amazon Timestream for InfluxDB 3 Enterprise
With the release of multi-node scaling for Amazon Timestream for InfluxDB 3 Enterprise, clusters can now support up to 15 nodes with distinct roles, separating ingestion, querying, and compaction to match your workload’s demands. In this post, we cover when to scale vertically versus horizontally, and how to make the right choice for both performance and cost.
For an introduction to InfluxDB 3’s architecture (Rust core, Apache Arrow, Amazon Simple Storage Service (S3) storage, unlimited cardinality, native SQL) and the differences between Core and Enterprise editions, see our previous post on InfluxDB 3 GA. We assume you’re running an Enterprise cluster and need more capacity.
Why scaling decisions matter
Once your cluster is in production, getting scaling right is the difference between a cost-efficient deployment and one that either wastes money or degrades under load. InfluxDB 3 Enterprise’s multi-node architecture gives you two levers:
- Vertical scaling: larger instance types (more vCPUs, memory, network per node)
- Horizontal scaling: more nodes (more total capacity, role specialization)
The choice isn’t always obvious, and the wrong one can double your costs without solving the actual bottleneck.
The guidance in this post comes from two complementary rounds of testing. The first is a set of focused benchmarks that isolate a single behavior. For example, sending memory-intensive queries to increasingly large instances, or holding the instance fixed and adding ingest nodes. The second is broader testing using an infrastructure-monitoring workload with 200,000 distinct series, 5,000-point write batches, and a realistic mix of point lookups and analytical queries, ramped from low to high concurrency across more than 130 runs to find where each configuration saturates. Where we cite a specific benchmark, we say so. The general patterns hold across both.
The cost framework: scale all or add one
Here’s the key insight: vertical scaling applies to every node in your cluster simultaneously.
If you have a 5-node Enterprise cluster on db.influx.2xlarge and scale to db.influx.4xlarge, you’ve doubled the compute cost across all 5 nodes, even if only your query layer was struggling. That’s a doubling of cost for what might be a single-dimension bottleneck.
Alternatively, adding one node to that 5-node cluster raises cost by roughly 20 percent. And if that node is targeted at your actual bottleneck (a dedicated query node for slow reads, an ingest node for write throughput, or a compactor for compaction lag), you pay for capacity only where you need it instead of scaling every node. If your bottleneck is isolated to one dimension, adding a role-specific node is often the more cost-effective path.
When to scale vertically:
- Your bottleneck is memory-bound (large columnar file fan-out, wide queries scanning many files)
- You need more network bandwidth per node (high-throughput ingest on fewer connections)
- All nodes are equally saturated, the cluster is uniformly undersized
- You’re opening too many client connections for the cluster’s size
When to scale horizontally:
- Your bottleneck is isolated to one role (writes are fine, but queries are slow, add a query node)
- You need more total write throughput (each additional ingest node adds capacity, though with diminishing returns)
- You want fault tolerance (more nodes = more resilience to single-node failures)
- Your read and write workloads are competing for the same resources, role separation alleviates interference
The mixed read/write penalty: why role separation matters
Before diving into vertical and horizontal benchmarks, it’s critical to understand the single most impactful architectural decision for combined workloads: whether reads and writes share the same nodes.
In InfluxDB 3 Enterprise, Ingest-Query (IQ) nodes handle both writes and reads by default. The in-memory write buffer and the DataFusion query execution pool compete for the same resources, CPU, memory, and the exec-mem-pool. When readers scan Parquet files (especially analytical queries with wide time ranges), they evict write buffer pages and consume DataFusion threads that would otherwise process snapshots.
Because both reads and writes draw on the same CPU and memory, read load on an IQ node competes directly with ingestion. Adding dedicated query-only (QO) nodes moves that read work off the ingest path entirely.
Recommendation: If your workload includes both writes and reads at production scale, adding dedicated query-only (QO) nodes isolates read contention at the architectural level, so each role can be sized to its own ceiling.
Vertical scaling: when bigger nodes win
Scale vertically when your workload requires increased memory per query, more network bandwidth, or when all nodes are equally saturated.
In a focused query benchmark, we sent 64 parallel connections of memory-intensive queries to instances scaled from db.influx.2xlarge to db.influx.8xlarge. These tests demonstrate the advantage of scaling vertically when your workload demands more resources per query.
We ingested 3,000,000 line protocol points and sent the following query with varying time ranges:
Results:
The takeaway: For wide analytical queries that scan large time ranges, bigger nodes with more memory for the Parquet cache and query execution pool deliver proportionally better latency. Our tests also show that read latency depends heavily on the type of queries you run. Short, recent-window and single-entity lookups stay fast, while wide analytical scans are the ones that benefit most from a larger instance.
Why this works (engine internals): Wide queries need to fetch many Parquet files from S3. Larger instances allocate more memory to the Parquet mem cache. If files are cache-hot, the S3 round-trip (5–500 ms per file) is avoided entirely. The DataFusion execution pool also needs room to hold intermediate Arrow RecordBatches during vectorized aggregation. Without enough memory, the engine spills to disk-like behavior (re-fetching pages), and latency spikes.
Horizontal scaling: when more nodes win
Scale horizontally when you want to increase throughput, especially write throughput, or when you need to isolate a specific bottleneck without paying to scale everything.
In a focused ingest benchmark, we sent 64 parallel connections of 5,000-point batches to a db.influx.8xlarge cluster, increasing the number of ingest-query nodes with each stage.
Line protocol characteristics:
- 20 tags, 3 integer fields, 4 double fields
- Average line size: 341 bytes
Results:
The takeaway: Write throughput scales sub-linearly with ingest nodes, not “double your nodes, double your throughput.” In our multi-node sweeps on smaller instances, adding a second ingest node increased total throughput but at well under 2x, and per-node throughput dropped as nodes were added. We have not yet characterized the efficiency curve precisely across all instance sizes and node counts, so we describe the effect directionally rather than quoting a fixed percentage.
Why sub-linear? Each ingest node writes to the shared object store (S3). As nodes increase:
- S3 PUT operations increase proportionally (one write-ahead log (WAL) flush per node per 100 ms interval)
- The compactor must process files from all ingest nodes, more sources equals more merge work. Catalog coordination (file registration, schema checks) adds per-node overhead
When does horizontal scaling still win decisively?
- When your bottleneck is write-bound and queries are already fast (add ingest, not query). When a single node’s vCPUs are saturated but memory is fine (you need more cores, not more RAM per core)
- When you need dedicated compaction. Offloading compaction to a separate node relieves CPU pressure on the ingest nodes (our sweeps with a dedicated compactor showed measurably lower ingest-node CPU, though we haven’t fixed a precise percentage across instance sizes)
Reads and writes hit different ceilings
A consistent pattern across our sweeps: the write path and the read path saturate independently, and usually it’s reads that give out first. In our heaviest mixed runs, ingestion kept flowing while the query side hit the timeout ceiling and queries began erroring out. The writes were fine. The reads were the bottleneck.
The write side tells its own story. In the following graph, single-node write throughput is nearly flat from xlarge through 12xlarge, quadrupling the vCPUs barely moves the ceiling. That’s the signature of a bottleneck that isn’t compute: writes are gated by the sequential WAL flush to S3, so a bigger instance doesn’t write meaningfully faster.
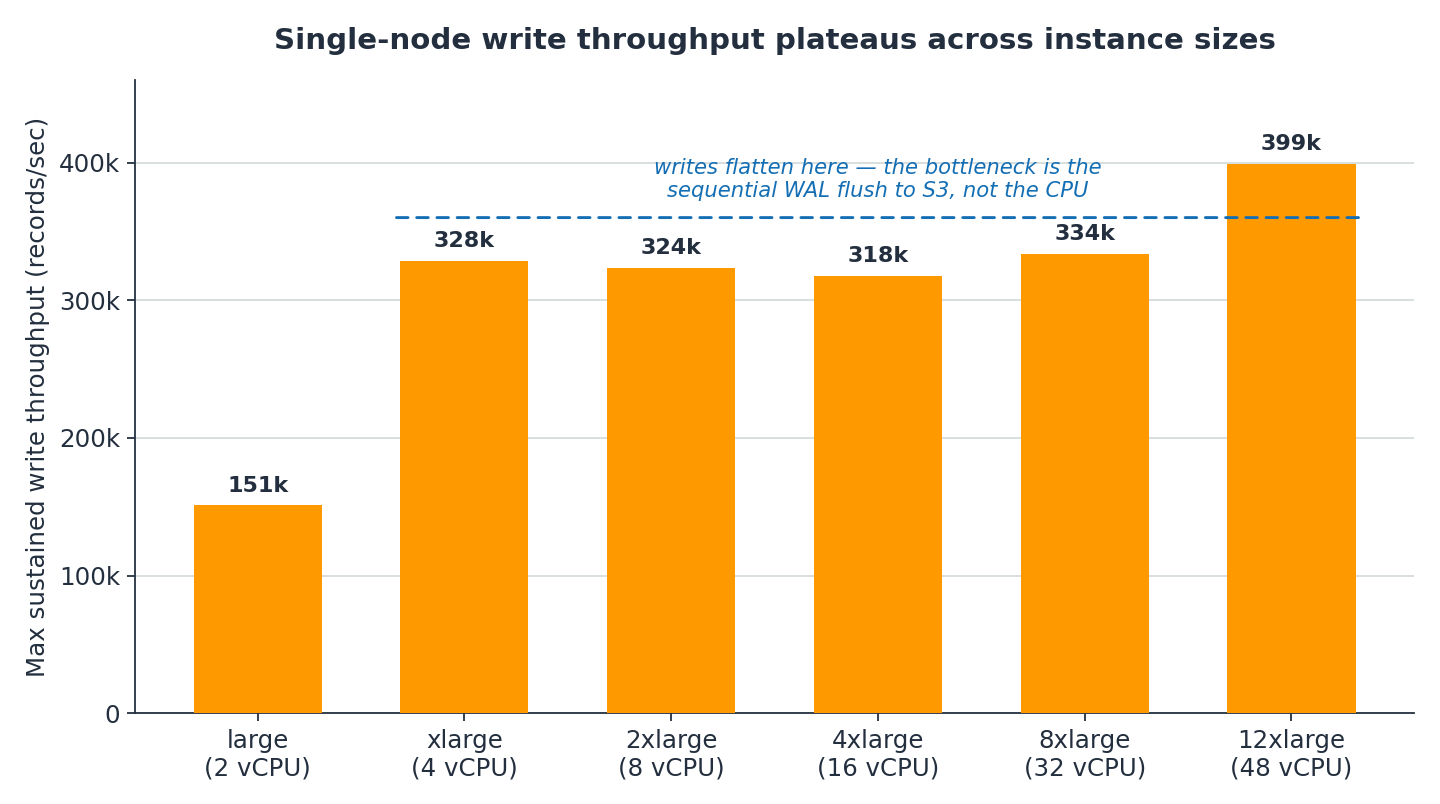
Single-node write throughput plateaus across instance sizes
Single node, write-only, less than 5 percent write errors. Source: TimeSeries Tester scaling sweeps. 16xlarge/24xlarge omitted, not driven to their write ceiling.
This reflects the architecture:
- The write path is gated by sequential WAL flushes to S3 (one PUT per node per flush interval) plus cross-node compaction and catalog coordination. It scales sub-linearly with ingest nodes (as discussed earlier), but it is durable and steady. It rarely errors, it just plateaus.
- The read path is gated by CPU and memory: DataFusion execution threads, the Parquet mem-cache hit rate, and how wide each query scans. It is far more sensitive to instance size and to the query mix, and it degrades sharply (latency climbs, then queries time out) once the query pool is overwhelmed.
What this means for scaling:
| If your bottleneck is… | Don’t | Do |
| Write throughput plateauing | Keep adding reader connections expecting more writes | Add ingest nodes, raise batch size, and check your connections-per-vCPU ratio |
| Read latency climbing / query timeouts | Add ingest nodes (writes aren’t the problem) | Scale vertically for Parquet cache + DataFusion pool, or add dedicated query-only (QO) nodes |
| Both degrading together | Scale every node vertically by reflex | Separate reads from writes first (QO nodes), then size each role to its own ceiling |
A measurement caveat for our own data: many of our high-load read tests piled up against the query-timeout ceiling and began erroring out before reaching a sustained rate, so our read numbers at high concurrency reflect that wall rather than a clean saturation point. We’re re-running those tests with a higher query timeout and more controlled reader concurrency (see our testing roadmap) so we can measure the true read-scaling curve instead of a clipped value. Until then, we describe read scaling qualitatively rather than putting hard numbers on it.
Late-arriving data: the compaction tax
If your data sources send records with timestamps in the past (common in IoT with intermittent connectivity, batch uploads, or event replay), those writes land in already-compacted time ranges. The compactor must re-merge the affected Parquet files, effectively processing the same data twice.
Our tests show that late-arriving data raises both CPU usage and write latency: runs configured with out-of-order data consistently used more CPU and had higher write P99 than equivalent in-order workloads. We haven’t yet run a controlled enough series to publish a precise overhead-per-percent figure, so treat this as a directional effect, more late data means more recompaction work.
What to do:
- If greater than 10 percent of your data is late-arriving and compaction is your bottleneck, add a dedicated compactor node
- If possible, buffer and sort data client-side before sending to InfluxDB
- For batch historical backfills, consider using a separate ingest window to avoid competing with real-time writes
Decision guide
| Symptom | Likely Bottleneck | Recommended Action |
| Queries slow, writes fine | Query fan-out / cache misses | Add a dedicated query node |
| Queries slow, wide time ranges | Insufficient memory for Parquet cache | Scale vertically (more RAM per node) |
| Writes backing up, queries fine | Ingest throughput saturated | Add an ingest node and raise batch size |
| Reads timing out, writes fine (0 percent write errors) | Read path saturated (DataFusion / cache) | Scale vertically OR add query-only nodes, not ingest nodes |
| Both slow when running together | Mixed R/W resource contention | Add dedicated query-only nodes (role separation) |
| Throughput plateaus while CPU has headroom | Too many connections for the cluster’s size | Reduce connection pool OR scale vertically |
| Compaction falling behind | Compaction competing with ingest | Add a dedicated compactor node |
| Compactor node overwhelmed | Compaction volume exceeds single node | Scale all nodes vertically |
| Everything slow uniformly | Cluster uniformly undersized | Scale vertically |
| Everything slow, late-arriving data greater than 10 percent | Compaction reprocessing | Add compactor + reduce late arrivals |
| Cost too high, performance acceptable | Over-provisioned | Scale down or remove underutilized nodes |
What we tested
Most findings in this post come from the broader testing, automated scaling sweeps run on our internal testing system, complemented by the focused benchmarks called out earlier in the vertical- and horizontal-scaling sections:
- Workload: infrastructure-monitoring profile with 200,000 distinct series, 5,000-point batches, mixed read/write with query ratios of roughly 86 percent entity-specific, 7 percent real-time, and 7 percent dashboard
- Sweep method: Capacity ramps starting at 5 writer/reader threads, increasing by 10 every 60 seconds until a ceiling is breached (CPU greater than 75 percent, memory greater than 75 percent, or error rate greater than 1 percent)
- Instance types tested:
db.influx.largethroughdb.influx.24xlarge(including12xlargeand16xlargeat high throughput) - Topologies tested: Single node, 2-node, 3-node, 4-node, with and without dedicated compactor, and with dedicated query-only (QO) nodes
- Granularity: Each capacity ramp is analyzed at the level of every individual load step, not just its peak, roughly 1,000 distinct (concurrency → throughput/latency/CPU/memory) measurements across 130+ test runs
- Metrics captured: Amazon CloudWatch
CPUUtilizationandMemoryUtilization(always available, backfilled directly from CloudWatch and aligned to each load step’s time window), per-second write/read throughput and latency percentiles from the load generator - Data hygiene: Individual load steps that errored out (above a few percent for writes, or heavily for reads) are excluded. These are test-harness or saturation-failure points, not clean engine measurements
- Confidence: We only report a relationship when it holds consistently across many independent test runs, not just within a single run. By that bar, the effects of cluster compute, connection-to-vCPU ratio, and node count on CPU, memory, and write throughput are consistent and repeatable. Read-latency behavior is less settled and is the focus of ongoing testing.
Summary
The right scaling decision depends on your specific bottleneck:
- First, check your client config. Batch size and connection pool sizing have more impact than instance size.
- Identify which path is actually saturating. Reads and writes hit different ceilings, high write throughput with 0 percent write errors but climbing query latency means the read path is the bottleneck, and adding ingest nodes won’t help.
- If reads and writes compete, separate them with dedicated query-only nodes before scaling anything vertically.
- If writes are the bottleneck, add ingest nodes but expect sub-linear scaling (each added node contributes less than a full node’s worth), not 100 percent efficiency.
- If queries are slow on wide time ranges, scale vertically for more memory per node. Reads scale with vertical size far more cleanly than writes.
- If throughput plateaus while CPU has headroom, you’re likely opening too many connections for the cluster’s size. Reduce the connection pool or scale vertically.
- If compaction falls behind (especially with late-arriving data), add a dedicated compactor.
To get started with Amazon Timestream for InfluxDB 3, visit our documentation for setup guides, API references, and best practices. For hands-on exploration, the InfluxDB 3 Explorer provides an intuitive interface to create databases, ingest sample data, and experiment with SQL queries.