AWS DevOps & Developer Productivity Blog
Building an end-to-end agentic SRE using AWS DevOps Agent
Introduction
As modern applications evolve into complex ecosystems of serverless functions, microservices, and event-driven architectures, incident response becomes increasingly challenging. DevOps and SRE teams spend hours manually correlating data across observability tools and troubleshooting issues, racing against SLA deadlines. This reactive firefighting drains productivity, degrades reliability, and delays innovation.
AWS DevOps Agent provides an opportunity to shift how teams achieve operational excellence. As an autonomous, always-on frontier agent, it investigates incidents the moment they occur, identifies root causes by correlating telemetry across your ecosystem, and recommends specific mitigation plans, all without constant human intervention. On-call engineers wake up to a root cause, instead of active incidents. AWS DevOps Agent supports multi-cloud and hybrid environments, not just AWS-native architectures.
This blog post demonstrates how to build an end-to-end agentic SRE solution using AWS DevOps Agent. You learn how to configure DevOps Agent Spaces that define an investigation scope, integrating seamlessly with Amazon CloudWatch, Splunk, GitHub, and Slack. It further demonstrates automated incident trigger using webhooks, and AWS DevOps Agent integration with custom tools by creating a custom MCP agent. The agent investigates issues by analyzing patterns across multiple data sources, providing root cause, and then generates detailed mitigation plans that can be implemented via a coding agent. By the end, you will have a deployed frontier agent that acts as a true extension of your team. One that works persistently, scales massively, and delivers complete operational outcomes while freeing your engineers to focus on innovation rather than firefighting.
Architecture
Implementation
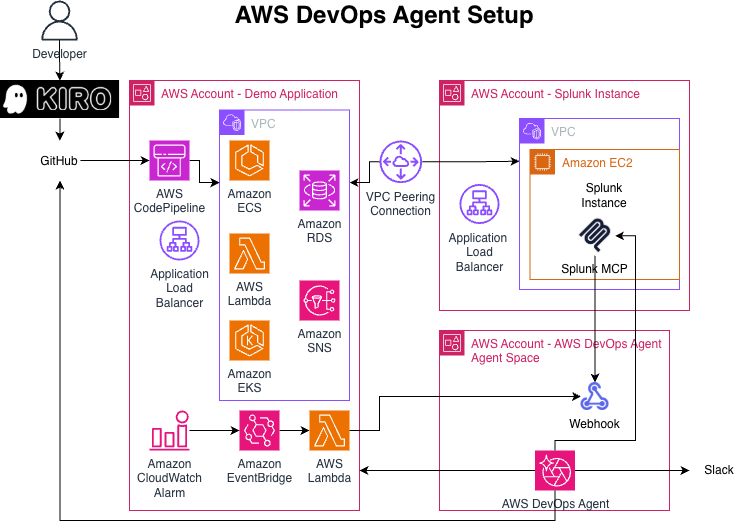
This implementation spans three specialized AWS accounts with distinct responsibilities.
The Demo Application account hosts the production infrastructure being monitored. The CI/CD pipeline integrates GitHub via AWS CodePipeline for automated deployments, while an Application Load Balancer distributes traffic and monitors health. The observability layer leverages Amazon CloudWatch alarms to detect anomalies, Amazon EventBridge to route events, and AWS Lambda as a webhook handler that forwards incident notifications to AWS DevOps Agent.
The account named Splunk provides centralized log aggregation and analysis. An Amazon EC2 instance hosts the Splunk Log Collector, while Splunk MCP manages the centralized control plane. A VPC peering connection establishes secure, private network connectivity between the Demo Application and Splunk account VPCs, enabling seamless log forwarding, without internet exposure.
AWS DevOps Agent account contains the autonomous investigation engine. AWS DevOps Agent receives incident webhooks from the Demo Application account, orchestrates autonomous investigations across integrated data sources, correlates telemetry from CloudWatch, Splunk, and GitHub, generates mitigation plans, and coordinates the incident response. The webhook integration provides communication, receiving incident triggers from Lambda, and sending investigation updates to Slack for real-time team collaboration.
Data flow: When an incident triggers the CloudWatch alarm, EventBridge invokes a Lambda function that, in turn, invokes the DevOps Agent webhook with a payload. The agent triggers an investigation based on its native troubleshooting capabilities. For a comprehensive view of the incident, it queries Splunk logs via MCP, retrieves deployment history from GitHub, and correlates CloudWatch metrics with deployment events to build application topology understanding. It analyzes temporal relationships between deployments and operational incidents, identifies root causes, and generates detailed mitigation plans with specific remediation steps, success criteria, and rollback procedures via Splunk MCP. The DevOps Agent’s runbooks/skills guide its investigation from start to finish, keeping it on track and aligned with established SRE procedures. Investigation results and recommendations are posted to Slack, enabling on-call engineers to wake up to identified root cause, instead of active incidents.
Creating your agentic DevOps engineer
DevOps Agent Spaces
A DevOps Agent Space defines the tools and infrastructure that AWS DevOps Agent has access to. Each Agent Space contains your AWS account configurations, third-party tool integrations, and access permissions. See Best Practices for Deploying AWS DevOps Agent in Production for detailed information describing the DevOps Agent spaces.
Creating an Agent Space can be done through the console, or via AWS Command Line Interface (AWS CLI). You should name your Agent Space with a descriptive name to identify its purpose. For example, if your application is “WidgetMaker”, then you can name your Agent Space “WidgetMaker Agent” to help you quickly identify the context of that agent.
Follow the steps in Creating an Agent Space for details and considerations when creating an Agent Space.
Agent Space webhooks
Before connecting any services to your DevOps Agent Space, make sure to create the webhook for your Agent Space. The schema for you to send messages to your Agent Space is shown below:
You can find great examples on the Invoking DevOps Agent through Webhook page. When creating a secure connection for this blog, we used HMAC (Hashbased Message Authorization Code). Optionally, you can experiment with the CloudWatch Alarm Webhook Integration from Git.
Finally, you create the webhook.
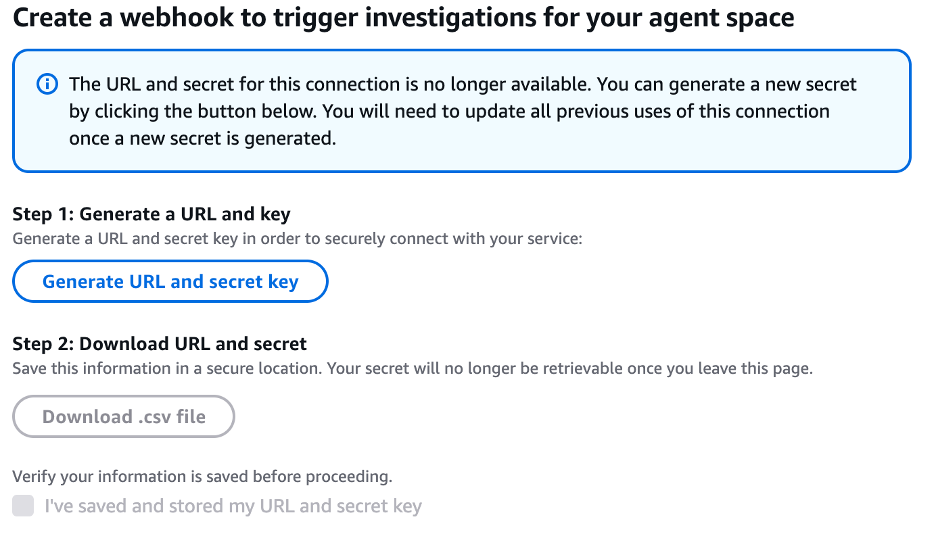
Make sure you download and save this unique url and secret key. Once you move on from this screen, you will no longer be able to see the secret. Now that we’ve created the webhook endpoint, we will set up the alarm or choose an existing alarm. Then we will use an Amazon Simple Notification Service (Amazon SNS) topic as the Alarm Action and subscribe a Lambda function to this topic. The Lambda function then calls the webhook. Store the webhook URL in Lambda environment variables for security.
The CloudWatch flow is: CloudWatch Alarm → Amazon EventBridge → Lambda → DevOps Agent Webhook.
Test by forcing the alarm into the ALARM state and verifying the DevOps Agent receives the event. See some samples on sending these alarms via WebHook at the aws-samples github.
Splunk Integration
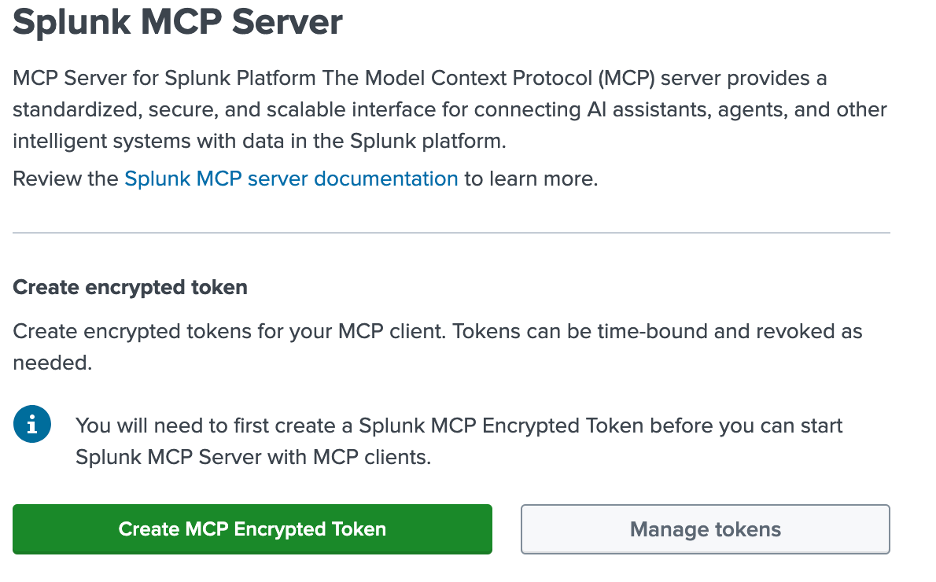
For Splunk integration, you will need to perform a few tasks on your Splunk server. First, you will need to enable the Splunk MCP Server to expose the MCP URL for AWS DevOps Agent.
For Splunk MCP Server, you will first configure a token to allow AWS DevOps Agent to securely log into the Splunk MCP server.
Note: You will need to have a role called ‘mcp_user’ (it doesn’t need any capabilities) and add it to the user account in Splunk that you are going to create the token in the next step.
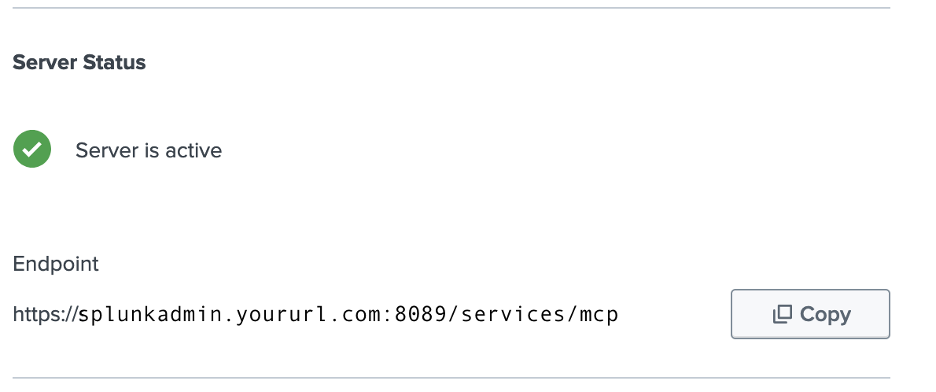
The audience should default to ‘mcp’ on this screen, but if not, audience will need to be ‘mcp’. Remember, you must copy the token from the screen when you create the token, or you will not be able to access it after you close the screen, requiring you to create a new token. Then, you can validate that the endpoint is active and copy the endpoint url. Note, the url presented reflects the url that you are using for the Splunk management console. If you have created a listener on port 8089 with a different url, for example, https://splunkmcp.yoururl.com:8089, then you will need to replace the url shown (https://splunkadmin.yoururl.com) with the proper url.
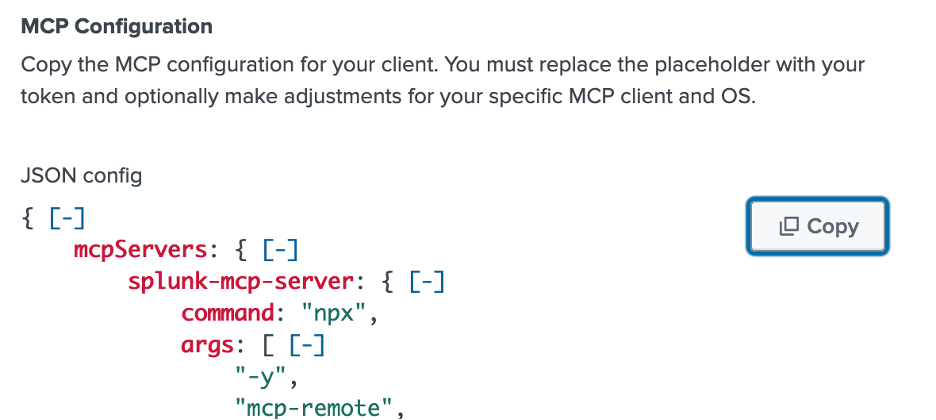
Finally, copy the MCP Configuration for use in AWS DevOps Agent. Note, just as above, validate that the url is the same as the listener you have created. Also, reminder to replace <Your Token> with the bearer token you’ve created (and copied) above.
To configure Splunk to send alerts to AWS DevOps Agent to begin investigations, you will need to use Better Webhooks because the default Splunk webhook does not support headers nor authentication.
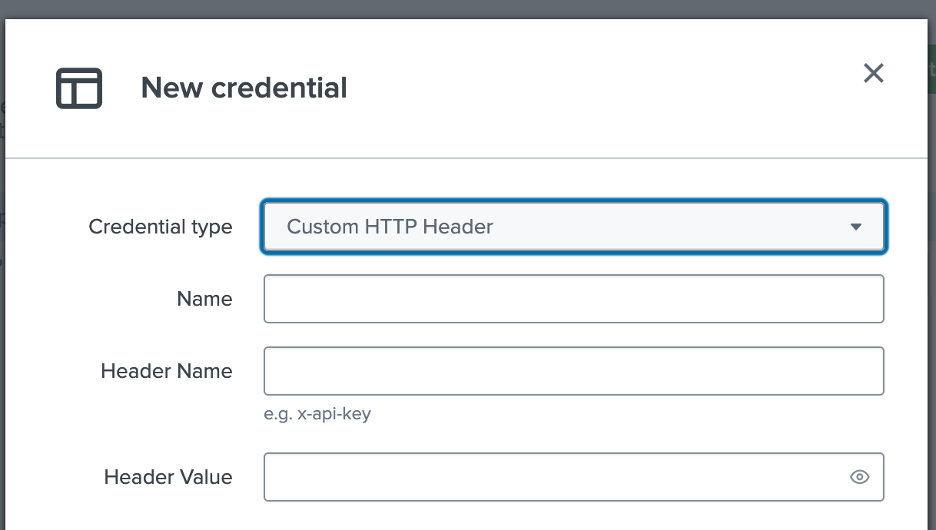
Once you have Better Webhooks, you can create a credential and choose Custom HTTP Header. Name can be whatever you desire, but we used “DevOpsAgentBearer” to be descriptive.
Header Name: Authorization
Header Value: “Bearer thetokenyousavedwhenyoucreateddevopsagentwebhook”
(Include “Bearer” and a space before your token from your DevOps Agent webhook)
You can skip the advanced section and save your credential.
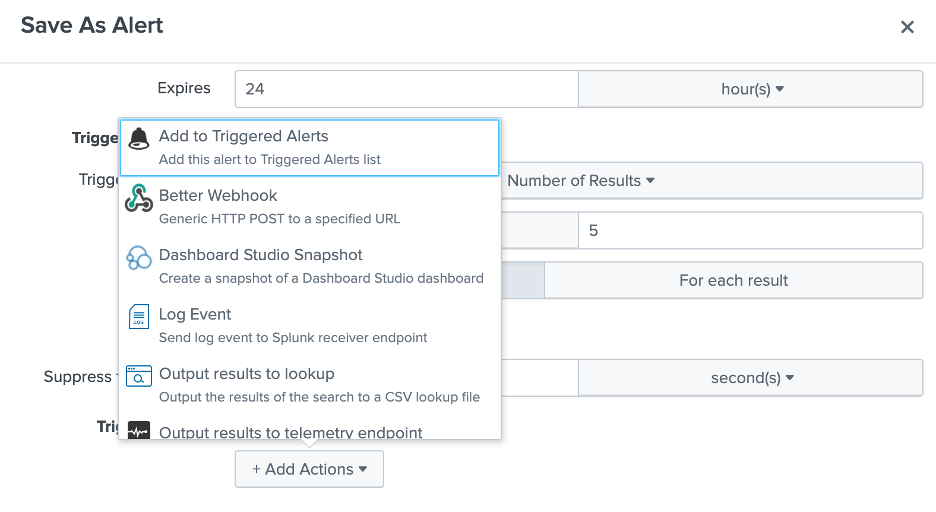
Now, you can configure the alert for your error state by finding it in search and saving search as an alert. Under Trigger Actions, select Add Actions and choose Better Webhook from the menu.
Then, format the message body as shown in AWS DevOps Agent.
In Splunk, the URL is the DevOps Agent webhook url which you had saved in a .csv with your token while creating the webhook. Paste the format above into the Body Format section as shown below, select the credential you saved in Better Webhooks earlier, and save your alert.
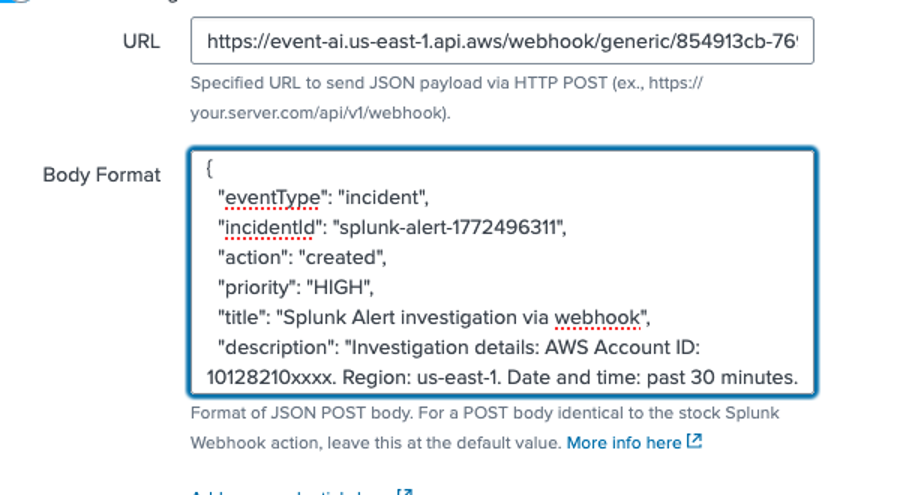
Notice that the Body Format box should reflect the format from AWS DevOps Agent above. Now, AWS DevOps Agent will initiate an investigation when Splunk errors exceed the threshold for the alert you’ve created. You may want to experiment with throttling and thresholds to keep AWS DevOps Agent from starting too many investigations.
Connecting to Slack
You can connect AWS DevOps Agent to your Slack environment and configure a channel for your Agent Space to communicate with. You can have multiple Agent Spaces communicate in one Slack channel, or you can have existing Slack channels for your SRE team invite the Agent Space to it.
To get started, you need to have access to a Slack workspace with the ability to install and authorize third-party applications. You then need to go to the AWS DevOps Agent console, navigate to “Settings” and select “Communications”. When you choose Register, you will be redirected to Slack to authorize the AWS DevOps Agent application for your workspace. It is important to install at the workspace level, not in your enterprise grid.
After you choose Allow, you will be directed back to your DevOps Agent console to associate your Agent Space with your Slack channel. Go to your Agent Space, scroll down to Communications, and choose Add integration.
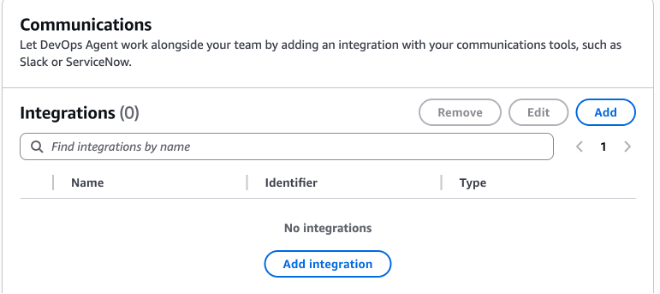
Towards the bottom of the popup, you should see Slack and it should show “Registered” in green.
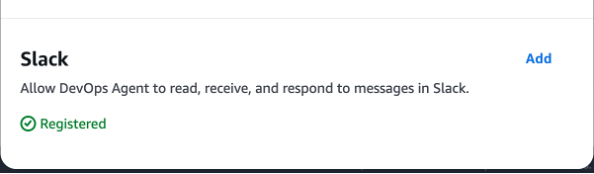
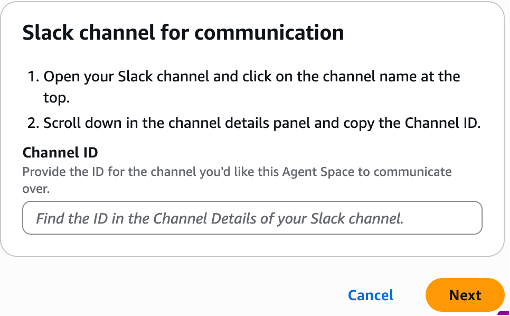
Choose Add and follow the instructions in the window to obtain and insert your channel ID into the DevOps Agent Space.
Once completed, you just need to add the AWS DevOps Agent to your channel by typing the following into your Slack channel: /invite @AWS DevOps Agent
Now, you can start an investigation, and the AWS DevOps Agent will provide details in your channel.
Connecting GitHub to AWS DevOps Agent
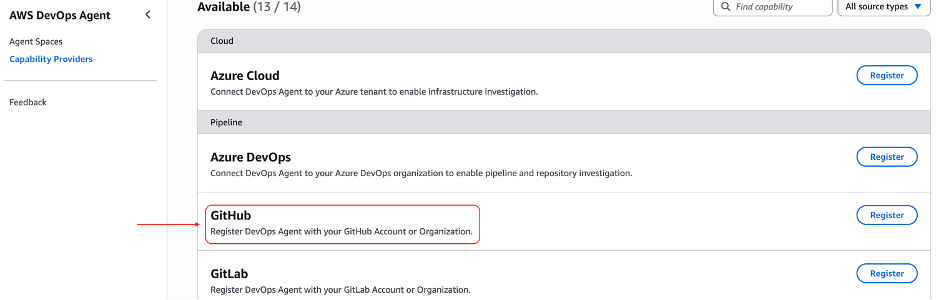
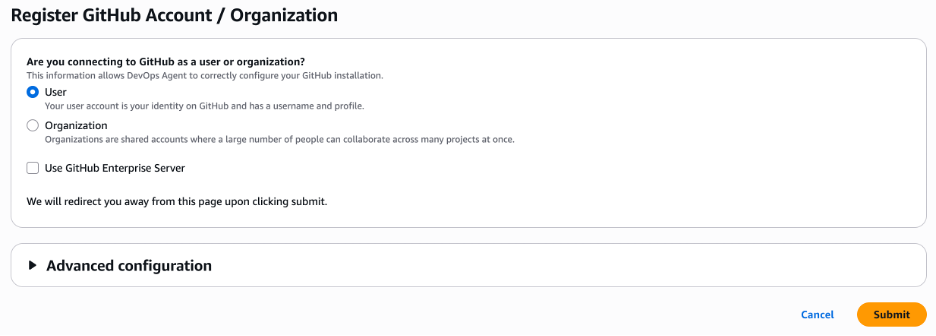
GitHub integration is a two-step process. First, register GitHub at the AWS account level: navigate to your Agent Space’s Capabilities tab, select Add under Pipeline, choose GitHub, and complete the OAuth flow to install the AWS DevOps Agent GitHub app. You can select which repositories the app can access — all or a specific subset. Once registered, connect repositories to individual Agent Spaces by selecting the relevant repos under the Pipeline section. The GitHub app requests read-only access and receive deployment events, enabling the agent to correlate code changes with operational incidents.
DevOps Agent Skills
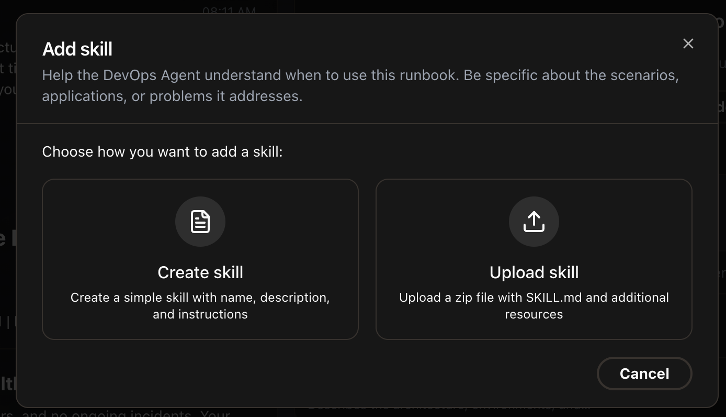
You can use DevOps Agent Skills to define a set of rules for all investigations to follow, guiding the Agent to use certain documentation, or telemetry sources for certain types of data. Skills are self-contained directories containing Markdown instructions that provide specialized capabilities to AWS DevOps Agent. AWS DevOps Agent supports a subset of the Agent Skills specification — an open standard for packaging agent instructions and resources—supporting only non-executable documents: Markdown instructions, PDFs, images, and data files. For example, if your environment uses Dynatrace for alarms and metrics, Splunk for logs, and CloudWatch for serverless logs, create a skill to accelerate issue resolution. You create these Skills in your Operator console by selecting the Skills section on the lower left side of the screen. You can then either review your existing skills or use the Add skill button to choose between Create skill and Upload skill options.
The documentation on DevOps Agent Skills should help you with the schema and best practices in creating these skills.
Investigate root cause
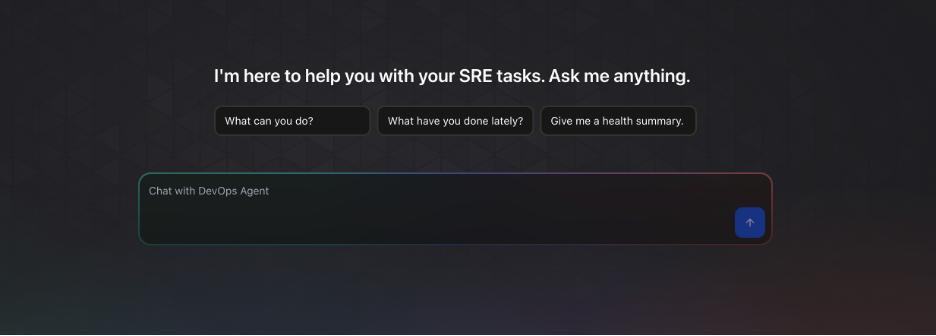
Now that you have everything connected to your DevOps Agent Space, you can interact with the AWS DevOps Agent you’ve created. You can investigate anomalies in your environment, or have alarms trigger your Agent to begin an investigation on its own and provide updates in your Slack channel and the Operator console. You can also ask the agent to provide health summaries, suggest preventive maintenance, and other SRE tasks you would do throughout the lifecycle. You can do this in the operator console and simply type your question into the Chat with DevOps Agent box. For example, “What is causing high CPU usage on my EC2 instances starting an hour ago?” and the AWS DevOps Agent will begin investigating your request.
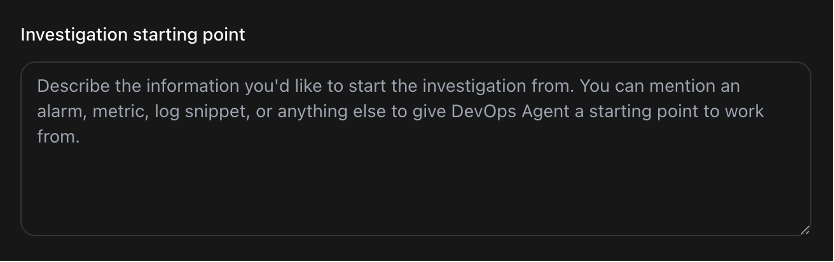
While optional, the steps below can help speed up a particular investigation and help track multiple investigations. Adding an Investigation starting point can help speed up the investigation by telling the agent to check a particular alarm, or an Autoscaling Group (ASG), or even a specific set of instances where you are seeing increased CPU usage. This guides the investigation to start with data sources pertaining to these resources, instead of looking at all your telemetry to find anomalies to start investigating.
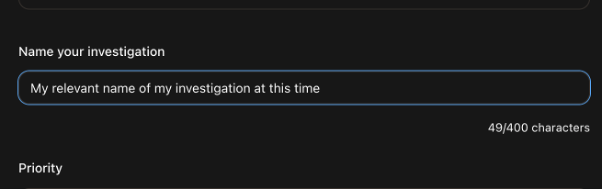
You should also make a habit of assigning a meaningful name to your investigations, so that you can look at the historical data with some context.
Generating mitigation plan
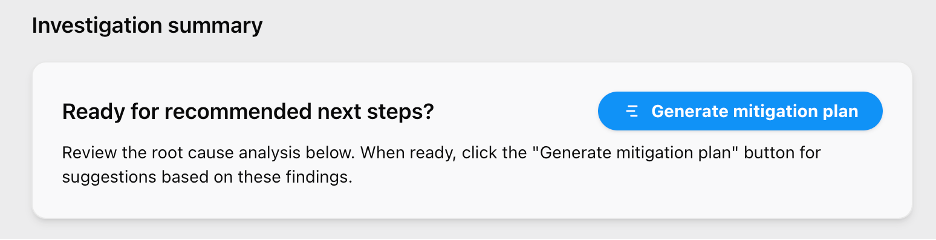
A mitigation plan is a set of actionable steps that AWS DevOps Agent produces to resolve an identified incident. After the agent publishes a root cause under the Root Cause tab, select “Generate mitigation plan” to create a structured remediation plan. Alternatively, automate this step using the AWS CLI — use aws devopsagent create-backlog-task to trigger investigations and update-backlog-task to approve mitigation plans programmatically. By automating this step, you can integrate mitigation plan generation directly within their incident workflow, without having to leave their incident management application. The CLI returns the mitigation steps back into the integrated app or system. Each plan follows four phases: Prepare, Pre-Validate, Apply, and Post-Validate. Within each phase, the agent provides suggested actions with commands to update infrastructure-as-code templates or make configuration changes. It also generates agent-ready specs compatible with coding agents like Kiro for implementation.
Agent-ready Spec and fix implementation
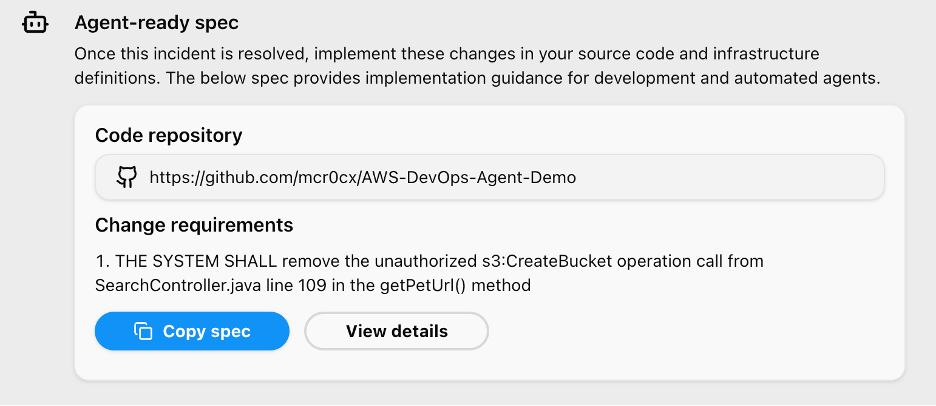
An agent-ready spec is a structured set of instructions that AWS DevOps Agent generates within a mitigation plan, designed to be consumed directly by a coding agent. When the mitigation plan includes code-level fixes — such as updating infrastructure-as-code templates or application logic — AWS DevOps Agent produces these specs alongside the suggested actions. To apply a fix, copy the agent-ready spec and hand it off to a compatible coding agent like Kiro. The coding agent interprets the spec and implements the required changes in your codebase. This creates a seamless handoff from incident diagnosis to code remediation, closing the loop between identifying a root cause and deploying the fix without manually translating mitigation steps into code changes.
Conclusion
In this post, we demonstrated building an end-to-end agentic SRE solution using AWS DevOps Agent — from configuring Agent Spaces and integrating CloudWatch, Splunk, GitHub, and Slack, to triggering automated investigations via webhooks, generating mitigation plans, and handing off agent-ready specs to coding agents like Kiro for implementation. Together, these capabilities shift incident response from reactive firefighting to autonomous resolution, reducing MTTR from hours to minutes while freeing your engineers to focus on innovation.
Get started today:
- AWS DevOps Agent product page — explore features and start a 2-month free trial
- Getting Started with AWS DevOps Agent (Console) — create your first Agent Space
- CLI Onboarding Guide — set up via the AWS CLI
- Getting Started with AWS CDK — deploy with infrastructure as code
- Best Practices for Deploying AWS DevOps Agent in Production — production deployment patterns and Agent Space design
- DevOps Agent Skills Documentation — build custom Skills to encode your team’s runbooks