Microsoft Workloads on AWS
Agilisium: Modernizing legacy data analytics platform with AWS
This post was written by Ananth Mahadevan Muralidharan, Senior Architect at Agilisium Consulting, and Vignesh Selvam, Senior DevOps Engineer at Agilisium Consulting, in collaboration with Jignesh Suthar, Sr. Partner Solutions Architect at AWS.
Recently, one of our (Agilisium) customers asked us to help them modernize their data analytics technology platform. They were running their data analytics workloads on premises by ingesting data into SQL Server and then using Power BI for data visualization. In this blog post, we want to share how we (Agilisium) helped our customer modernize its data analytics platform with low-cost storage options and managed and cloud-native data analytics services on AWS to reduce total cost of ownership (TCO) and improve performance.
First, a little about Agilisium and our customer: Agilisium Consulting is a Los Angeles-based AWS Advanced Consulting Partner with Data Analytics, EMR, and Redshift competencies. We exist to help organizations accelerate their “Data-to-Insights-Leap.” Our customer is a privately held company that offers consumers a range of high-quality products and services. They grow, harvest, bottle, and market a diverse range of products, including fruits, nuts, flowers, water, wines, and juices. In addition, they have a dedicated business unit that grows and processes almonds and pistachios. They use IoT devices to monitor their farms—i.e., every tree has one or more IoT devices—and to collect vital data to monitor the health of their plants. Refer to Figure 1 for their setup.
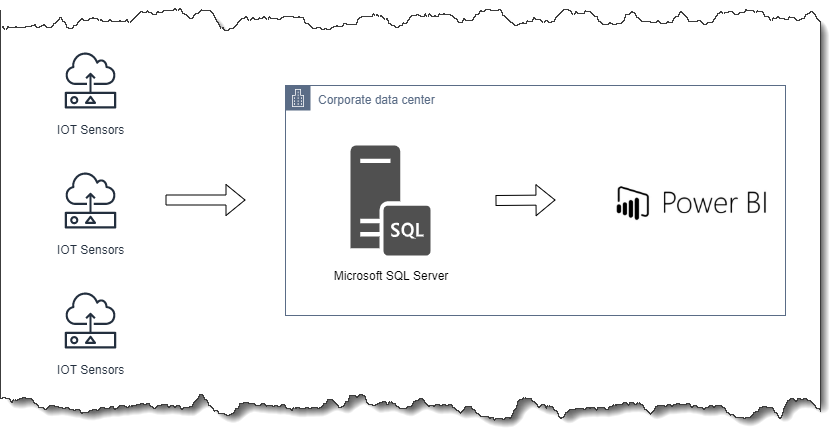
Figure 1. Existing solution
Challenges with existing on-premises solution
Our customer’s major challenge was figuring out how to handle a high volume of data cost effectively at a lower latency. Every IoT device sends data every second. Considering that there are 11,000 devices, this translates to 11,000 data points per second. The customer expected the data to grow by 5% in the first quarter, 25% in the second quarter, 50% in the third, and so on. The database size at the end of the year was expected to be 185 TB, and the data itself was expected to double in volume by year end.
It was becoming increasingly difficult to scale out the on-premises infrastructure to meet the growing demand for data. Because of finite on-premises resources, business users were not able to gather many insights from the data. Also, performance-to-cost ratios were challenging to sustain. Our customer wanted help in migrating their workloads to managed database services, so they could realize immediate cost benefits and avoid restrictive licensing terms and proprietary lock-in features.
Options for migrating SQL Server to Amazon Redshift
Every customer is different and so are the workloads. Instead of offering a one-size-fits-all solution, AWS believes in providing multiple options so customers can pick the one(s) that meets their business needs. With a proven track record of helping customers modernize their data and analytics workloads, Agilisium worked closely with our customer to build a variety of proofs of concept (POCs) to help them find the best and most cost-effective solution for their needs.
Here are a few of the POCs we built to show how SQL Server could be migrated to Amazon Redshift, AWS’ cloud data warehouse:
· AWS Database Migration Service (AWS DMS): This option required an intermediate transfer to Amazon Simple Storage Service (Amazon S3) since AWS DMS does not have a direct migration path from SQL Server to Amazon Redshift.
· Amazon Kinesis Data Firehose: This service was also considered, and even though it’s a viable solution, various stress tests showed it wasn’t cost effective for the given scenario. Amazon Kinesis rounds up the data to the nearest 5 KB, resulting in a higher cost for the IoT sensors, which typically generate 60-70 byte files.
· Custom set of AWS services: In the end, we selected an optimal set of AWS cloud-native services to build a customized data analytics solution because of the significant increase in performance and a reduction in TCO, as shown in Figure 2.
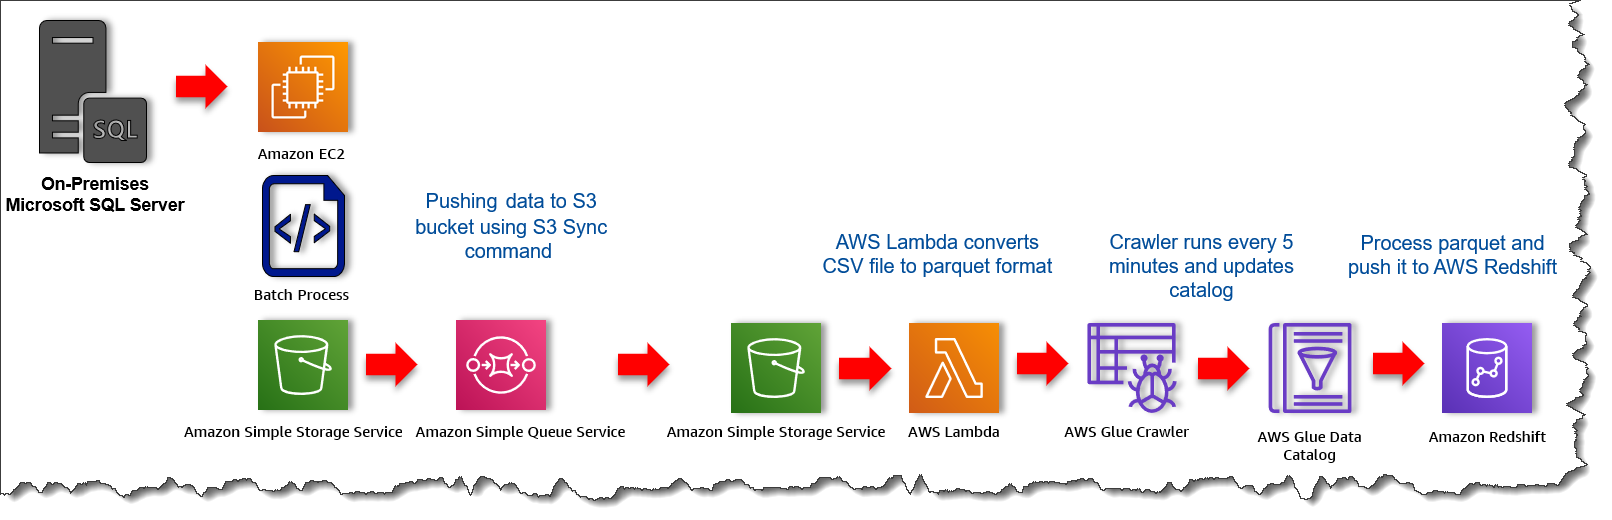
Figure 2. Workflow of data analytic solution built around AWS cloud-native services
Here’s a brief description of the workflow depicted in Figure 2.
· Data generated by IoT sensors is transferred to an on-premises SQL Server database.
· Using a stored procedure, the data is pushed every minute to Windows Server running on Amazon Elastic Compute Cloud (Amazon EC2).
· Amazon EC2 executes a batch script that picks up these IoT sensor files and moves them to Amazon S3 using the Amazon S3 sync command.
· An AWS Lambda function converts the CSV file stored in Amazon S3 to Parquet.
· AWS Glue processes the Parquet-converted file and pushes it to Amazon Redshift Spectrum, a feature that allows you to query data directly from files on Amazon S3.
We used AWS CloudFormation to create the infrastructure necessary to host the solution. We also used AWS CloudFomation to deploy the solution in the dev, test, and production environments by modifying parameters such as environment name and AWS Region name.
Solution Architecture
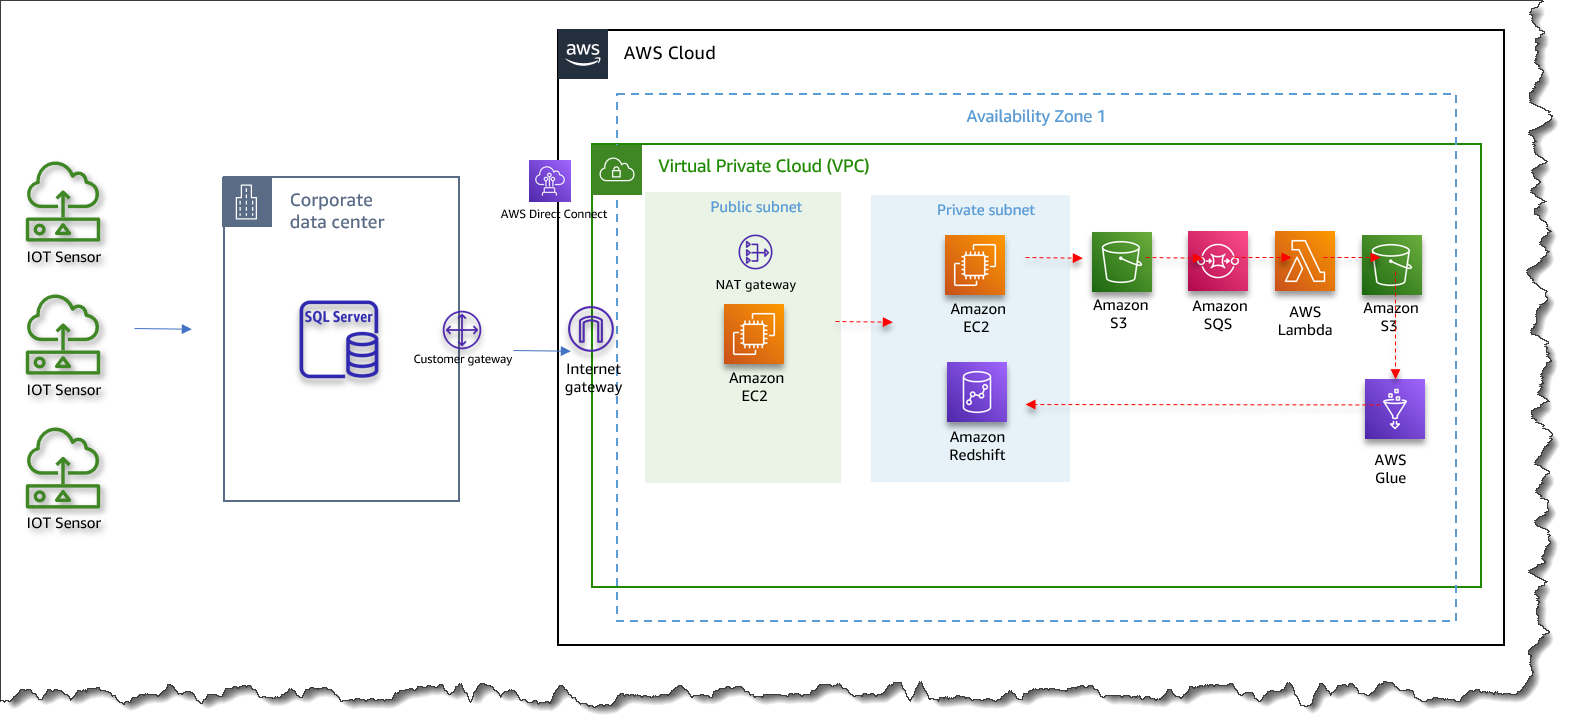
Figure 3. Solution Architecture
Why Amazon Redshift
Amazon Redshift is a built-for-the-cloud data warehousing solution designed by AWS to manage large petabyte-scale datasets. With Amazon Redshift, customers can focus on getting insights from data in seconds and don’t have to think about managing their data warehouse infrastructure. Customers also gain up to 3x better price performance than other cloud data warehouses at scale.
How Agilisium validated the solution
Our Agilisium team performed rigorous stress testing to validate the solution. These stress tests were designed and executed to push the solution to its limits, determine the point at which it could no longer handle the workload, and decide whether it was within the performance parameteres when it went live in production. The tests had different statistical types for the data velocity, such as linear and uniform distribution.
Stress test #1: Constant workload
This test assumed one record from each sensor every second and translated it to:
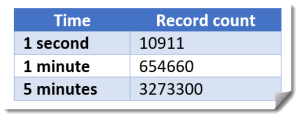
The input parameters were:
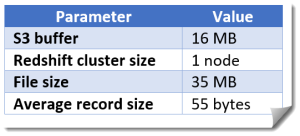
Based on the above stress tests, we determined that the system could handle 215 Kbps, which met the production load needs. In a different scenario with changed Amazon S3 and Amazon Redshift parameters, a new file was uploaded every 5 minutes. We determined the processing capacity was also sufficient in this case. During the test, the file size was slowly increased. We found a file size of 48 MB was the limit, after which the system lagged in processing records.
Stress test #2: Linear distribution
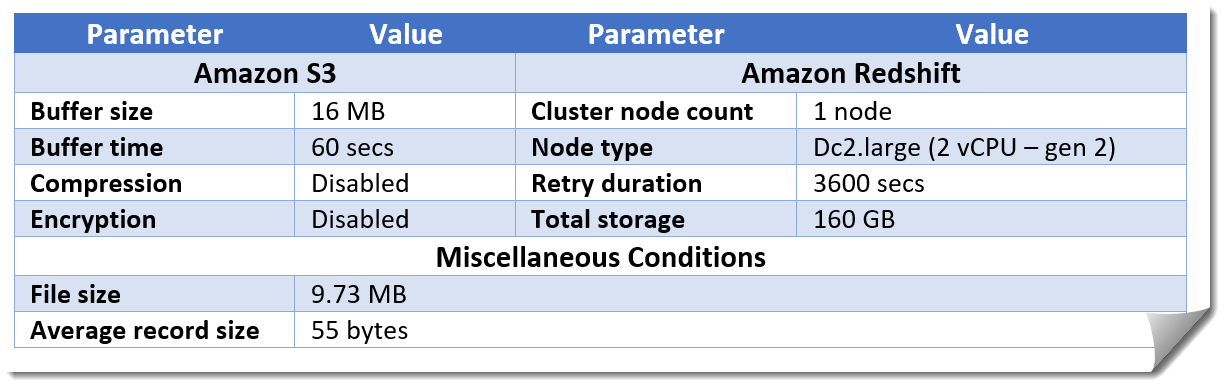
In this test case, the base count of the records was kept at 183906 and increased by the same amount every second—e.g., 183906, 367812, 551718, etc. The following chart shows the linear increase in record count per second. The uploaded records were processed successfully within the stipulated time, and the processing capacity was sufficient in this case.
The first test with a linear distribution had the following input parameters:
Stress test #3: Uniform distribution
During this test, the number of files followed a uniform distribution. Every minute, the system processed a uniformly distributed number of files, with each file containing ~3.3 million records.. We found again that a file size of 48 MB was the limit, after which the system started to lag when processing records.
Other test cases
The following table shows additional tests we ran to validate the application:

Outcomes
Improvement in performance
The AWS Lambda function processes a 180 MB file in 25 seconds. A file can contain close to 3.27 million records with a record size of 60-70 bytes. Approximately 1.4 billion records are now processed daily.
As a comparison, with the on-premises solution, the business user had to run custom SQL queries to generate reports, which involved significant manual effort to derive meaningful insights from the data. With the new solution, these users have access to business intelligence reports within 5 minutes of the data being generated from IoT sensors.
Reduction in TCO
The infrastructure size is significantly reduced because the reporting is now done from Amazon Redshift. This has also helped reduce licensing costs. The low-cost storage and built-in backup mechanism offered by Amazon S3 and Amazon Redshift helped reduce the storage and backup management cost. In addition, using AWS’ native services helped our customer reduce the operational cost of generating reports and managing infrastructure (storage, backups, and databases).
Conclusion
In this blog post, we showed how we helped one of our customers modernize their on-premises SQL Server application to a cloud-based Amazon Redshift solution. As a result, our customer successfully achieved better performance at a lower TCO. The Amazon Redshift solution has met the customer’s business needs as it now processes IoT sensor data in near real-time with low latency. Also, it is highly available and scalable, allowing it to handle more data from IoT sensor-enabled farms in the future.
AWS offers a plethora of built-for-the-cloud services that can help you modernize your legacy data warehouse and data analytics platform. To learn more about how to implement similar architectures, please visit the AWS Prescriptive Guidance documentation, which provides more detail on data lake patterns.