AWS Cloud Operations Blog
Bring AWS Security Hub CSPM findings into your Amazon CloudWatch on-call workflow
At 2:47 AM, an on-call engineer gets paged: CPU on a production Amazon EC2 instance has been above 95% for five minutes. They open Amazon CloudWatch and run the usual triage, checking recent deployments, traffic spikes, memory, and disk I/O. Nothing lines up.
They scale the instance; utilization climbs back within minutes. Thirty-two minutes later, after exhausting the runbook, they escalate to security. The answer is immediate: Amazon GuardDuty flagged that instance 40 minutes ago, and it’s running a cryptominer.
The finding was there the whole time. It wasn’t visible to the person who needed it most.
This pattern shows up across customer environments: the operations team burns time on a performance issue whose root cause shows up in a console they rarely open. The AWS Well-Architected Framework calls it out directly. SEC04-BP03 identifies this anti-pattern: different teams investigating findings from different systems, unless separation of duty requirements mandate otherwise.
That capability gap closed in March 2026 when AWS launched native ingestion of AWS Security Hub CSPM findings into Amazon CloudWatch Logs. Getting findings into CloudWatch is the foundation. This post is about what you build on top: a composite alarm that fires only when a security finding and a performance alarm are active on the same resource, and the on-call runbook patterns that turn that correlation into faster triage. Full AWS CloudFormation templates and console walkthroughs are in a companion GitHub repository.
What changed: Security Hub findings in CloudWatch
Until March 2026, an on-call engineer troubleshooting a CPU spike had no way to see Security Hub CSPM findings in the same CloudWatch console already open on their screen.
AWS launched native ingestion of Security Hub CSPM findings into CloudWatch Logs. Security Hub CSPM is the cloud security posture management service previously known as Security Hub; it was renamed when the new Security Hub became generally available in December 2025. The CSPM findings cover Security Hub CSPM standards checks such as AWS Foundational Security Best Practices and the CIS AWS Foundations Benchmark, Amazon GuardDuty threat findings forwarded to Security Hub CSPM, and Amazon Inspector vulnerability findings. You enable delivery by creating a telemetry enablement rule for Security Hub in the CloudWatch console, which ingests findings into a managed log group. Step-by-step console instructions are in the companion GitHub repository. Findings arrive in ASFF (the native schema used by the metric filters in this post) or OCSF (vendor-neutral), your choice at rule creation time.
Two delivery paths, complementary purposes
This launch does not replace the existing Amazon EventBridge integration. Each path serves a different operational need:
| Delivery path | Best for | What it enables |
|---|---|---|
| Amazon EventBridge | Routing and automation | Rule-based routing to AWS Lambda, AWS Step Functions, cross-account event buses, ticketing systems |
| Amazon CloudWatch Logs | Analysis, dashboards, and correlation | Metric filters, CloudWatch Alarms, composite alarms, Logs Insights queries, unified dashboards |
If you already route Security Hub CSPM findings through EventBridge for automated remediation, keep that in place. EventBridge handles the push-based automation: routing individual findings to AWS Lambda, AWS Step Functions, or a ticketing tool. CloudWatch Logs handles the analysis: metric filters, alarms, dashboards, and correlation with application telemetry. The two are complementary, not interchangeable. For an example of the EventBridge path, see Correlate security findings with AWS Security Hub and Amazon EventBridge.
Architecture: the unified operational pipeline
Bring application metrics, application logs, and security findings into a single operational plane, so CloudOps engineers see the full picture without switching consoles.
The architecture converges three data streams into CloudWatch within a central observability account:
- Application metrics (CPU, memory, latency, error rates) from workload accounts via CloudWatch Agent or SDK instrumentation.
- Application logs (structured and unstructured) from Amazon EC2, AWS Lambda, Amazon ECS, and Amazon EKS workloads via CloudWatch Logs.
- Security Hub CSPM findings (ASFF format) delivered via a telemetry enablement rule.
These three streams converge in CloudWatch. For multi-account organizations, use CloudWatch centralization rules to replicate findings from member accounts into a central observability account (setup steps are in the companion repository). Metric filters then extract security signals, alarms detect thresholds, and dashboards correlate everything on a shared timeline.
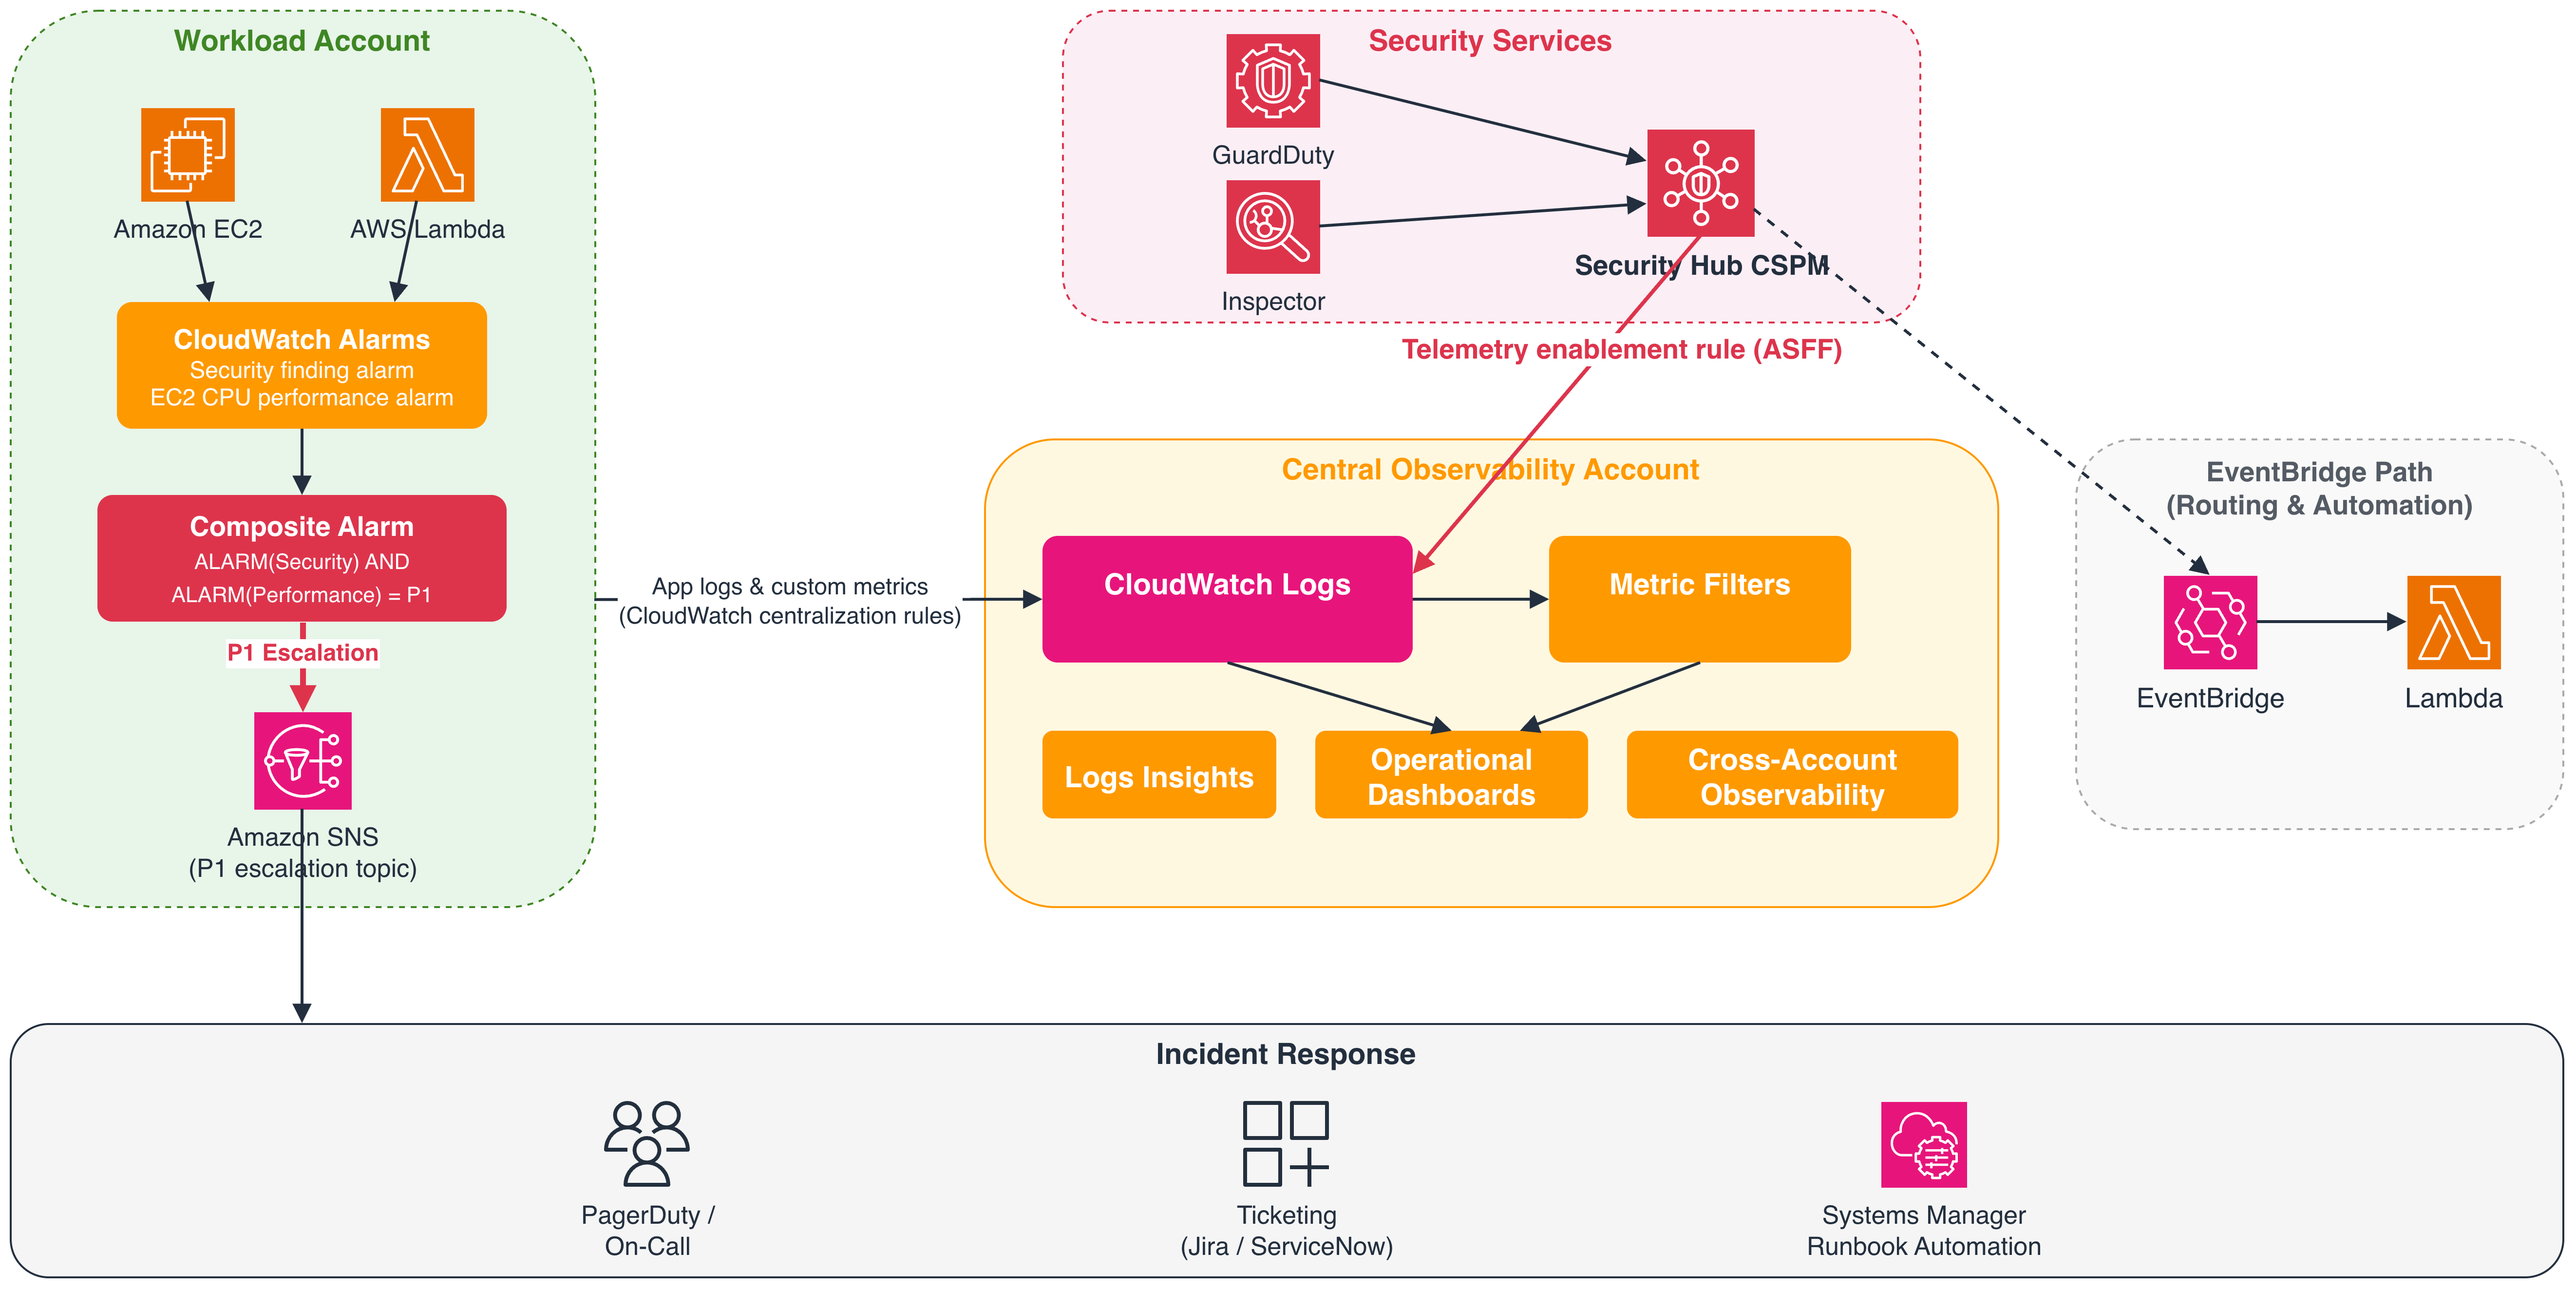
The on-call engineer’s workflow does not change. Security context appears inside the tools they already use: the same dashboards, the same alarm notifications, the same Logs Insights queries.
The enablement rule delivers findings into a service-managed log group. Confirm its exact name in your CloudWatch console and use it consistently across AWS Identity and Access Management (IAM) policies, metric filters, and queries. The companion repository includes a sample IAM read-only policy scoped to the findings log group.
Log groups created by the enablement rule use the Standard log class, which is what the metric filters in this post require. Infrequent Access costs less but does not support metric filters, near real-time subscriptions, or Live Tail. If you pre-create the log group with a different class, the metric filters in this post will not work.
Implementation: metric filters, alarms, and composite alarms
With findings in CloudWatch Logs, you treat them like any operational signal: filter, count, alarm, and correlate. The companion repository includes the full CloudFormation for all resources below, plus console walkthroughs for each step.
Metric filter: count critical and high findings
A metric filter on the findings log group counts active, untriaged CRITICAL and HIGH finding events for one resource and publishes them as a CloudWatch metric, keyed by resource so a per-resource alarm can watch a single instance. Security Hub re-delivers a finding on every update, so the filter matches only Workflow.Status = NEW and RecordState = ACTIVE; a finding updated while still NEW still matches, which is intended, and resolved, suppressed, or triaged findings are excluded. The pattern is scoped to the one resource you page on (a condition on Resources[0].Id), so the dimensioned metric emits a single value and stays well under the CloudWatch Logs limit that disables a filter past 1,000 distinct dimension values. A metric filter that sets a dimension cannot also set a default value, so the metric reports only when a matching finding arrives, and the alarm treats missing data as not breaching. The CloudFormation looks like this:
SecurityFindingMetricFilter:
  Type: AWS::Logs::MetricFilter
  Properties:
    LogGroupName: !Ref FindingsLogGroupName
    FilterPattern: !Sub >-
      { ($.Severity.Label = "CRITICAL" || $.Severity.Label = "HIGH")
      && $.Workflow.Status = "NEW" && $.RecordState = "ACTIVE"
      && $.Resources[0].Id = "arn:${AWS::Partition}:ec2:${AWS::Region}:${AWS::AccountId}:instance/${MonitoredInstanceId}" }
    MetricTransformations:
      - MetricName: CriticalHighSecurityFindings
        MetricNamespace: SecurityHub/Operational
        MetricValue: "1"
        Dimensions:
          - Key: ResourceId
            Value: $.Resources[0].Id
Two additional filters (CryptoMining and Production-scoped) are in the companion repository. The cryptomining filter targets the exact scenario from the opening: a compromised instance whose CPU spikes while a GuardDuty finding sits unseen.
Composite alarm: where security meets operations
The composite alarm ties the two signals together. It fires only when the security-finding alarm and the performance alarm for the same resource are both in ALARM, expressed as ALARM(SecurityFindingAlarm) AND ALARM(PerformanceAlarm). Because a composite alarm and its child alarms must share one account and Region, the template builds the finding alarm, the performance alarm, and the composite alarm together in the workload account where the instance runs.
A security finding often precedes the performance symptom by many minutes, so the finding alarm holds ALARM for a 60-minute lookback window after the last matching finding (EvaluationPeriods 12 at a 300-second period, DatapointsToAlarm 1). That keeps it active long enough to overlap a later performance alarm, which is what makes the opening scenario correlate rather than miss. Keep this per-resource composite in the workload account. CloudWatch metrics centralization replicates custom, EMF, and OpenTelemetry metrics to a destination account, but not AWS vended metrics such as AWS/EC2 CPUUtilization, and it rewrites centralized metrics with the :@aws.account and :@aws.region dimensions.
To run the composite in a central observability account, first republish the performance metric there as a custom metric and account for those added dimensions. Full CloudFormation and console steps are in the companion repository.
This is the automated version of the triage gap from the opening scenario: the alarm sees both signals and pages with the right context, so the engineer does not discover the correlation half an hour in.
This correlation is deterministic. The composite alarm encodes the rule explicitly in its alarm expression, needs no extra tooling, and routes through the Amazon SNS topic and on-call rotation you already run. It delivers the page at 2:47 AM with the security context attached, so the engineer sees the correlation at the moment they are paged.
The composite alarm itself is short:
SecurityPerformanceCompositeAlarm:
  Type: AWS::CloudWatch::CompositeAlarm
  Properties:
    AlarmName: !Sub "P1-SecPerf-${MonitoredInstanceId}"
    AlarmRule: !Sub >-
      ALARM("${SecurityFindingAlarm}") AND ALARM("${PerformanceAlarm}")
    AlarmActions:
      - !Ref P1EscalationSNSTopicArn
Dashboards: correlating security and performance
This is a CloudWatch operational dashboard, not the unified dashboard in the Security Hub console. Security Hub’s dashboard serves the security team’s investigation work; this one lives in CloudWatch next to your application metrics and answers one question for the on-call engineer: is anything security-related happening on my workload right now?
Design: the top row shows the metrics your team already watches (CPU, latency, error rates). The bottom row shows findings by severity, recent new CRITICAL and HIGH findings, and a finding-volume trend. To make a security event show up on the performance graph itself, the CPU widget overlays the per-resource finding metric on its right Y axis, so a finding appears on the same graph and timeline as the CPU line rather than relying on static annotations.
Before and after: the on-call experience
| Before | After | |
|---|---|---|
| Alert | CPU alarm fires. Open CloudWatch. | Same. CPU alarm fires. |
| First look | Check EC2 metrics. Look at the deployments. Check traffic. | Glance at bottom row: CRITICAL CryptoMining finding at same timestamp. |
| Root cause | After the performance runbook is exhausted: escalate to security and wait for a response. | At first look: the finding and the CPU spike appear on the same graph. |
| Action | Scale up (doesn’t fix it, wastes money). | Isolate instance, engage security IR. |
| Time to resolution | Longer: the cause surfaces only after escalation. | Can be much shorter: the security cause is visible from the start of triage. |
A note on the scenario: the opening timeline is illustrative. It reflects patterns seen across customer environments, not a single measured incident, so treat it as representative rather than benchmarked.
Operational runbook patterns
If you are not sure where to start, use Pattern 1. It changes nothing about your existing alert. Once your team trusts the data, move to Pattern 3.
- Pattern 1: One-click security context in alarm descriptions. Put a Logs Insights query link in the alarm description. When the alarm is scoped to a single resource, the link can be pre-filtered to that instance, so the engineer gets paged, clicks it, and sees whether the performance issue has a security root cause. This changes nothing about your existing alerting, though CloudOps needs read access to the findings log group, which the security team usually grants.
- Pattern 2: Security context as first triage step. When a performance alarm fires, the engineer checks security findings on the affected resource before doing anything else, using the Logs Insights queries from the companion repository. If findings exist, engage security. If not, proceed with standard triage.
- Pattern 3: Correlated security and performance escalation. The composite alarm fires when a security finding and a performance alarm exist on the same resource simultaneously. Route it through the same SNS topic your performance alarms use, so the on-call engineer sees both signals in one notification. Good fit for payment processing, authentication services, and data pipelines.
Decision tree for on-call triage
- Step 1: Open the dashboard. Security findings on this resource in the last 60 minutes? No: standard triage. Yes: go to Step 2.
- Step 2: Severity? CRITICAL: engage security now, do not touch the resource. HIGH: engage security in parallel, continue triage. MEDIUM/LOW: note it, flag for post-mortem.
- Step 3: Does the finding type match the symptoms? CryptoCurrency and CPU spike: isolate the instance. Exfiltration and network saturation: revoke the credential. Recon with no performance link: probably coincidental, tell security anyway. Your security incident response team, or the on-call engineer working with them, isolates the instance or revokes the credential per your IR runbook.
The query behind Step 1 and Pattern 2, scoped to the affected resource:
SOURCE '/aws/securityhub/findings'
| fields @timestamp, Severity.Label as severity, Title, Resources.0.Id as resource
| filter resource = 'arn:aws:ec2:us-east-1:111122223333:instance/i-0123456789abcdef0'
    and Workflow.Status = 'NEW' and RecordState = 'ACTIVE'
| sort @timestamp desc
| limit 10
Considerations
- Cost: Security Hub findings delivered to CloudWatch Logs are billed at tiered CloudWatch Logs pricing, not flat ingestion pricing (see the Amazon CloudWatch pricing page). Budget also for the custom metrics the filters publish, the metric and composite alarms, and the dashboard. A typical finding is 2 to 5 KB; at 50,000 finding events per month across the organization that is roughly 100 to 250 MB, though control checks across many accounts can far exceed that, so confirm your own number in Security Hub usage. Use CloudWatch Logs Intelligent Tiering, an account-level storage tiering option, for retention; add Amazon S3 only if compliance requires it.
- Signal quality: start with CRITICAL and HIGH only, scoped to production via resource tags. Expand to MEDIUM after 30 days once false-positive rates are low.
- Access boundaries: CloudOps engineers read findings for triage context; they cannot suppress, archive, or modify them. Security retains full ownership.
- Compliance: confirm whether your organization’s audit and retention requirements call for CloudTrail data events on the findings log groups.
- Alarm tag routing (optional): CloudWatch can include an alarm’s tags in the payload it sends to Amazon SNS, AWS Lambda, and Amazon EventBridge, so you can route or filter the P1 escalation by tags such as team or environment without a second lookup. The companion per-resource template carries a commented configuration to turn this on for the composite alarm.
Conclusion and next steps
The triage gap from the opening scenario becomes a glance at the dashboard. Security findings live in CloudWatch alongside application telemetry, correlated on one timeline. Start with one workload: enable findings ingestion, add the metric filters and composite alarm, and build the dashboard. Expand once your team trusts it.
For more on the capabilities referenced in this post:
-
- CloudWatch Security Hub findings ingestion
- CloudWatch composite alarms
- CloudWatch Logs Insights query syntax
- ASFF format reference
- Companion GitHub repository (CloudFormation templates, queries, console walkthroughs): https://github.com/aws-samples/sample-securityhub-findings-amazoncloudwatch-unified-security
Important: The sample code and configurations in this post are provided for illustration purposes and are not intended for use in production environments without thorough review, testing, and validation. Adapt these examples to meet your organization’s specific security, compliance, and operational requirements.