AWS Cloud Operations Blog
Getting per-resource alarm notifications with Amazon CloudWatch
Introduction
As organizations scale their AWS footprint across multiple accounts and Regions, operations teams increasingly rely on Amazon CloudWatch Metrics Insights alarms with GROUP BY to monitor entire fleets from a single alarm. When this single alarm tracks hundreds of resources, a critical operational question arises: how do you ensure that every individual breach is captured and acted upon? This is especially important when multiple resources cross the threshold in rapid succession. Without this insight, you risk incomplete incident scoping, delayed response, and manual investigation through dashboards to identify affected resources.
Consider an on-call engineer who receives a CPU threshold alert at 2:00 AM identifying one instance. Five minutes later, three more instances across different accounts breach the same threshold. If the team lacks visibility into each individual breach, customer impact can escalate before the full scope is discovered.
CloudWatch Metrics Insights alarms with GROUP BY address this challenge directly. The alarm evaluates each unique dimension combination, also called a contributor, independently. It emits a separate notification for each breaching contributor through alarm actions. This happens even while the alarm remains in ALARM state. This means your on-call team receives one notification per affected resource, not a single aggregated alert.
This post explains how this multi-resource alerting behavior works end to end. It then walks you through an approach using Amazon EventBridge Contributor State Change events to ensure all notifications are reliably processed, enriched, and routed. This covers custom formatting, conditional routing, and automated remediation beyond what native alarm actions provide.
We’ll first explore what CloudWatch delivers natively at the per-resource level, then walk through how to extend that with EventBridge when your operational needs go beyond standard notification formats and routing.
Native CloudWatch alarm behavior
The alarm evaluates all contributors on every evaluation period and provides two notification mechanisms:
- Contributor level Alarm actions: Amazon Simple Notification Service (Amazon SNS) notifications and AWS Lambda function invocations operate at the contributor level. This means that when a new contributor breaches the threshold, the alarm runs alarm actions specifically for that contributor, even if the alarm is already in ALARM state from a previous contributor’s breach. Each notification includes the AlarmContributorId and AlarmContributorAttributes fields, identifying the specific resource, for example, AccountId and InstanceId, that triggered it.
- EventBridge Contributor State Change events: Simultaneously, CloudWatch emits a Contributor State Change event to Amazon EventBridge for each contributor that breaches or recovers. These events are independent of alarm actions and provide the same per-resource detail in a structured, event-driven format that you can route to any EventBridge target for custom processing.
In summary: Native alarm actions handle per-contributor alerting with no additional setup. EventBridge events emit in parallel, which enables custom solutions when you need more control over how notifications are processed and delivered.
Reference: The alarm actions documentation confirms contributor-level support for SNS and Lambda invocations in the “Alarm actions and notifications” table. See Alarm actions and Create an alarm based on a Multi Time Series Metrics Insights query in the Amazon CloudWatch User Guide.
What you get by default
- Per-resource alarm notifications via Amazon SNS, identifying which AccountId and InstanceId breached
- Automatic notifications for each new contributor, even during an ongoing ALARM state
Extending alarm actions with EventBridge
Native alarm actions deliver per-contributor notifications in a standard format to your configured SNS topics. If your operational workflows require additional processing, you can use Amazon EventBridge Contributor State Change events to implement custom solutions and perform actions as required.
The key difference from native alarm actions (SNS, Lambda) is that EventBridge rules can target multiple destinations, enabling you to format, route, filter, or automate remediation.
Extend with EventBridge when you need
EventBridge Contributor State Change events carry the same per-resource detail as native notifications, but in a structured format that you can route to supported AWS services, or third-party API destinations.
Native alarm actions are sufficient for
Standard alerting to a single SNS topic or Lambda: Native alarm actions handle this directly with zero additional setup.
Per-resource notifications, knowing which resource breached: Native alarm actions are sufficient. Each contributor breach triggers an Amazon SNS notification or AWS Lambda invocation identifying the specific resource. No additional infrastructure is needed.
Solution Overview
When your operational requirements go beyond what native alarm actions provide, you can add an EventBridge rule as an event-driven extension layer. The rule captures Contributor State Change events and routes them to custom processing logic. This approach decouples your notification pipeline from the alarm, which enables independent scaling, versioning, and testing of your notification logic. The solution adds:
- Amazon EventBridge rules that capture Contributor State Change events emitted by the alarm
- An AWS Lambda function that processes each contributor event, enriches it with contextual data, and routes targeted notifications
- Amazon SNS or a third-party integration such as Slack, for delivering enriched, per-resource alerts
An additional advantage of the centralized monitoring account is that all Contributor State Change events are emitted in the monitoring account where the alarm lives. This means you deploy a single EventBridge rule to capture events across all source accounts, rather than deploying rules in every individual workload account.
The key difference from native alarm actions: EventBridge rules can target multiple destinations, so you can format it, route it, filter it, or trigger automated remediation.
The following diagram shows the solution architecture for extending native alarm actions with EventBridge.

Prerequisites
To follow along with this walkthrough, you need:
- An active AWS account with appropriate AWS Identity and Access Management (IAM) permissions for Amazon CloudWatch, Amazon EventBridge, AWS Lambda, and Amazon SNS
- At least two Amazon EC2 to simulate multi-resource breaches
- AWS Command Line Interface (AWS CLI) v2 installed and configured, or access to the AWS Management Console
- Basic knowledge of AWS Lambda and Python (or your preferred runtime)
Walkthrough
This walkthrough guides you through extending native alarm actions with EventBridge for custom notification routing.
Step 1: Create a Metrics Insights alarm with GROUP BY dimensions
A CloudWatch metric alarm monitors CPU utilization across multiple instances and accounts, tracking each unique dimension combination as an individual contributor.
Navigate to the CloudWatch console and create a new alarm using the following Metrics Insights query:
SELECT AVG(CPUUtilization)
  FROM SCHEMA("AWS/EC2", InstanceId)
  GROUP BY AccountId, InstanceId
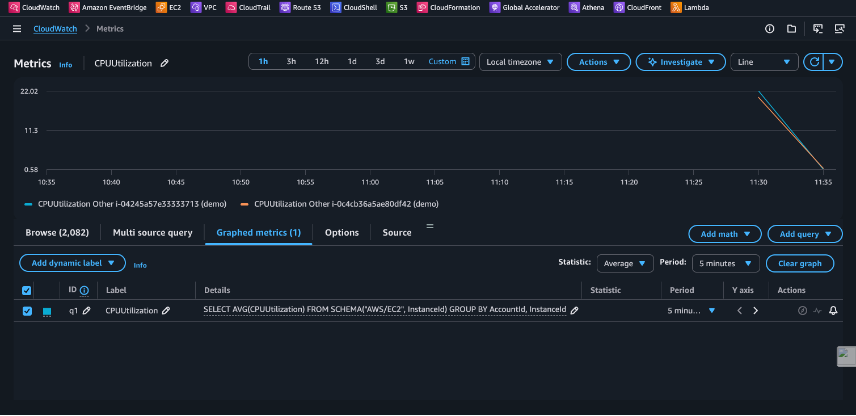
Configure the alarm threshold (for example, AVG > 80 percent for 2 consecutive periods of 5 minutes). Set the AlarmActions to your SNS topic. At this point, native alarm actions already deliver per-contributor notifications. The following steps add the EventBridge extension layer.
Note: For more information about Metrics Insights query syntax, see “Using Metrics Insights queries with metric math” in the Amazon CloudWatch User Guide.
Step 2: Configure an EventBridge rule for Contributor State Change events
In addition to alarm actions, CloudWatch emits Contributor State Change events to EventBridge whenever a contributor breaches or recovers. These events provide the same per-resource information as alarm actions but in a programmable, event-driven format that you can route to any target.
Create an EventBridge rule with the following event pattern:
{
  "source": ["aws.cloudwatch"],
  "detail-type": ["CloudWatch Alarm Contributor State Change"],
  "detail": {
    "alarmName": ["cpu-breach-alarm"],
         "state": {
            "value": ["ALARM"]
                  }
            }
}
Set the rule target to the Lambda function you create in Step 3.
Key behavior: Contributor State Change events fire for every individual dimension combination that breaches or recovers, independently of the alarm’s top-level state. Unlike standard alarm state change events (which fire only on OK → ALARM transitions), these events provide continuous, per-contributor visibility.
Note: For more information about Contributor state change events, refer “Multi Time series Alarm” section of Alarm state change events guide.
Step 3: Deploy a Lambda function for enriched notifications
Create an AWS Lambda function that processes the Contributor State Change events. Unlike native alarm actions that deliver a fixed-format notification, your Lambda function can format the message and enrich it with additional context, such as instance tags or account aliases. It can also route notifications to different channels based on the contributor dimensions.
Important: CloudWatch emits one Contributor State Change event per breaching resource. If five instances breach simultaneously, five separate events are emitted, each containing a single alarmContributor object identifying the specific resource. The Lambda function is invoked once per event.
The following Python code demonstrates this pattern:
import json
import os
import boto3
sns_client = boto3.client('sns')
SNS_TOPIC_ARN = os.environ['SNS_TOPIC_ARN']
def lambda_handler(event, context):
    detail = event['detail']
    alarm_name = detail['alarmName']
    contributor = detail['alarmContributor']
    # Each event contains a single contributor (one event per breaching resource)
    attributes = contributor['attributes']
    account_id = event['account']
    instance_id = attributes.get('InstanceId', 'Unknown')
    state = detail['state']['value']
    metric_value = detail['state'].get('reason', 'N/A')
        # Custom formatting and enrichment
    message = (
            f"ALARM: {alarm_name}\n"
            f"Resource: {instance_id}\n"
            f"Account: {account_id}\n"
            f"Contributor State: {state}\n"
            f"Metric Value: {metric_value}\n"
            f"Timestamp: {event['time']}"
        )
    sns_client.publish(
            TopicArn=SNS_TOPIC_ARN,
            Subject=f"CloudWatch Alert: {instance_id} in {account_id}",
            Message=message
        )
    return {'statusCode': 200}
Ensure the Lambda execution role includes the following IAM permissions:
• sns:Publish on the target SNS topic
• logs:CreateLogGroup, logs:CreateLogStream, logs:PutLogEvents for CloudWatch Logs
Best practice: As shown above, replace the hardcoded SNS_TOPIC_ARN with an environment variable so you can update the topic without redeploying the function.
Note: For simpler use cases where custom formatting or routing logic is not required, you can configure EventBridge to send Contributor State Change events directly to an SNS topic without Lambda. The raw event JSON will be delivered as the notification payload. Use Lambda when you need human-readable message formatting, per-account routing to different notification channels, deduplication logic, or automated remediation (for example, triggering AWS Systems Manager runbooks).
Step 4: Test the solution
To validate the solution, simulate CPU load on two instances at different times. You can use the stress-ng tool to simulate the traffic. For Amazon Linux 2023, you can install the package via sudo yum install stress-ng. You can refer to Redhat documentation for stress-ng.
Note: The following link takes you to a third-party website not operated by AWS. AWS is not responsible for the content, accuracy, or availability of external sites, and the reference does not constitute an endorsement.
- Connect to Instance A via SSH and generate CPU load:
sudo stress-ng --cpu 4 --timeout 600s- Wait approximately 5 minutes to allow Instance A to breach the threshold and trigger the alarm. Connect to Instance B and run the same command:
sudo stress-ng --cpu 4 --timeout 600s- Monitor your notification channel. You should receive two separate notifications:
- One notification for Instance A when it first breaches the threshold (alarm transitions to ALARM state)
- A second notification for Instance B when it breaches approximately 5 minutes later, even though the alarm remained in ALARM state
Each notification contains the specific AccountId and InstanceId, enabling your on-call team to respond immediately to the correct resource.
Cost considerations
When implementing this solution, consider the following cost components:
- Amazon EventBridge: Free as EventBridge doesn’t charge for AWS Management events. Amazon EventBridge pricing
- AWS Lambda: Pricing based on number of invocations and execution duration. AWS Lambda pricing
- Amazon SNS: $0.50 per 1 million SNS requests, plus delivery charges for SMS/email. Amazon SNS pricing
- CloudWatch alarms: $0.10 per standard-resolution alarm per month (Metrics Insights alarms). See Amazon CloudWatch pricing for current rates.
Cost at scale: If your GROUP BY produces 1,000 unique contributors, the alarm still counts as a single Metrics Insights alarm. However, each contributor breach triggers a separate EventBridge event and Lambda invocation. At 1,000 contributors breaching daily, expect approximately 30,000 Lambda invocations and 30,000 SNS publishes per month. Use the AWS Pricing Calculator to estimate costs for your specific cardinality.
Cleaning up
To avoid incurring future charges, delete the following resources created during this walkthrough:
- CloudWatch Metrics Insights alarm (cpu-breach-alarm). Edit or delete a CloudWatch alarm
- Amazon EventBridge rule (targeting the Lambda function). Disabling or deleting a rule in Amazon EventBridge
- AWS Lambda function and its IAM execution role. Clean up
- Amazon SNS topic and any subscriptions (email, SMS) Deleting an Amazon SNS topic and subscription
- Amazon EC2 instances used for testing (if created for this walkthrough) Terminate Amazon EC2 instances
Conclusion
In this post, you learned how to get detailed per-resource alarm notifications from a single CloudWatch Metrics Insights alarm. With this approach, you can identify exactly which resource or account breached a threshold, even when multiple resources breach at different times during an ongoing ALARM state.
We also explored EventBridge’s Contributor State Change events, which can further enhance the alerting as per your requirements.
As a next step, consider extending this pattern to:
- Integrate with your existing incident management tools, such as Slack or Zendesk
- Build automated remediation using AWS Systems Manager runbooks triggered by contributor events
- Apply the same pattern to other metric namespaces, for example, monitoring AWS Lambda errors by function name or Amazon API Gateway latency by route
- Deploy the solution as infrastructure as code using AWS CloudFormation or the AWS Cloud Development Kit (AWS CDK)
- Store contributor routing rules in Amazon DynamoDB to dynamically route notifications to different SNS topics or teams based on account, resource type, or custom attributes
Customize notification layouts for readability. Native alarm notifications include verbose JSON. With the Lambda-based approach, you format human-friendly messages with only the fields your on-call team needs: resource ID, account, metric value, timestamp, and direct console links.
To get started with CloudWatch Metrics Insights alarms, see Create an alarm based on a Multi Time Series Metrics Insights query in the Amazon CloudWatch User Guide. For more examples of EventBridge rules and targets, see the Amazon EventBridge guide.