AWS Cloud Operations Blog
Use AWS DevOps Agent to triage and route AWS Health event impact
Triaging the impact of AWS Health events is one of the most repetitive jobs in cloud operations, and it is exactly the kind of work AWS DevOps Agent can take on. Scheduled maintenance, operational issues, and Trust & Safety notifications (alerts about resources that may violate the AWS Acceptable Use Policy) land in your inbox and on the AWS Health Dashboard, and each one triggers the same chore. An engineer reads the event and identifies which workloads the affected resources support. They judge whether redundancy will absorb the disruption, then track down the team that owns the impacted application. Across many accounts and a steady stream of events, the volume grows quickly. That work is slow and inconsistent. Low-impact notifications pile up next to the ones that genuinely need attention, so teams either over-alert until people tune the alerts out, or miss the event that mattered.
This post describes an event-driven solution that hands this triage to AWS DevOps Agent. We walk through deploying it with the setup wizard. You upload a custom skill that gives the agent its methodology, then configure notification routing for your teams.
The agent investigates each AWS Health event against your live topology to determine real impact, and it routes only confirmed-impact findings to the owning teams through the channels they already use. In our experience, triaging a single event by hand takes an engineer 15 to 30 minutes of cross-referencing resources, dependencies, and ownership. In our own testing, the agent returned the same assessment automatically in 2 to 10 minutes, depending on the complexity of the topology, without manual investigation effort. Because it notifies teams only on confirmed impact, low-impact events no longer obscure the ones that need attention.
Overview of solution
The solution is an event-driven pipeline. Amazon EventBridge captures AWS Health events and invokes an Event Router AWS Lambda function, which normalizes the event and starts a Standard workflow in AWS Step Functions. The workflow orchestrates the rest of the process: it calls AWS DevOps Agent through a signed webhook, pauses while the agent investigates, and resumes when the agent returns its findings.
A custom skill teaches the agent how to assess Health event impact. The agent extracts the affected service, Region, and resource IDs from the event, then cross-references them against the topology it has discovered. Tracing direct and transitive dependencies, it finds the scope of the disruption and looks for redundancy such as multi-AZ deployments and Auto Scaling groups. It then assigns a severity to each affected workload and identifies the owning team from resource tags, returning a structured summary with findings, recommendations, and a notification routing list.
The workflow then makes a single decision: did the agent report findings? If there is no impact, the workflow stops, and no one is notified. This is the design principle that keeps the noise down.
When impact is confirmed, the workflow creates an OpsItem in AWS Systems Manager OpsCenter for persistent tracking. It records a severity mapped from the investigation priority and a category derived from the event type. It also captures the agent’s summary, findings, and recommendations.
A Notifier Lambda function then routes alerts to each affected team through their configured channels. Those channels include Amazon Simple Notification Service (Amazon SNS) email, Slack, and Microsoft Teams. If no team routing matches the event, the Notifier falls back to a default Amazon SNS topic. The setup process subscribes the email address you provide to that topic. The Notifier also resolves the AWS account alternate contacts (Operations, Security, and Billing). This way, even a fresh deployment reaches someone. Optionally, for events scored medium impact or higher, the agent can open a Jira ticket so the work lands in the backlog your teams already use.
Two more design choices deserve attention. Every resource uses on-demand or pay-per-request pricing and nothing runs between events, so the solution incurs minimal to no charges while idle. And each Lambda function is designed to run with a least-privilege AWS Identity and Access Management (IAM) role scoped to the minimum permissions required for the specific resources it touches.
The architecture diagram shows how these components fit together, from event capture through investigation to notification.
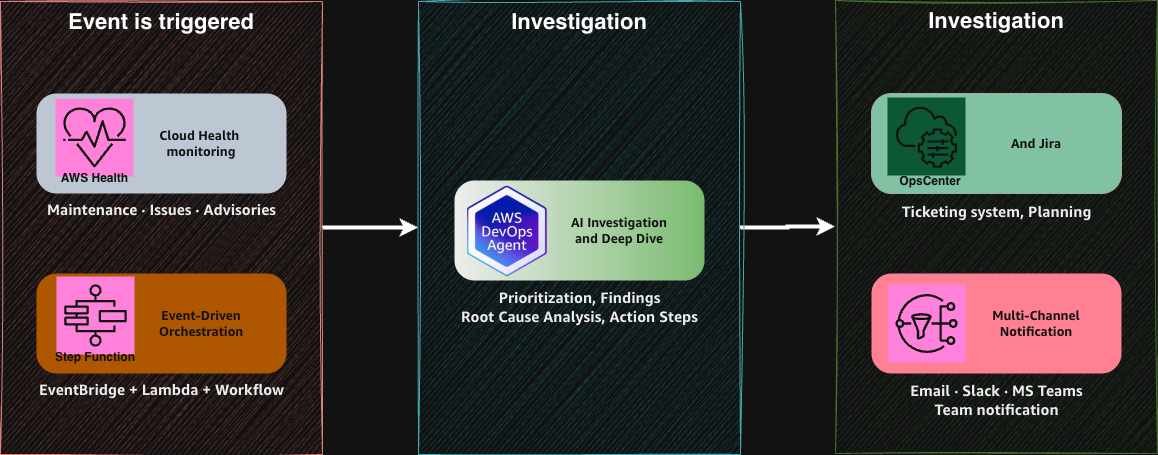
Figure 1: Event-driven pipeline from AWS Health event capture through agent investigation to OpsItem creation and team notification.
Prerequisites
For this walkthrough, you should have these prerequisites:
- An AWS account with permissions to create IAM roles and to use AWS Lambda, AWS Step Functions, Amazon DynamoDB, Amazon SNS, and AWS Systems Manager.
- AWS Cloud Development Kit (AWS CDK) and Node.js 24 or later installed. The Lambda functions run on the Node.js 24 runtime.
- AWS CLI v2.34.20 or later, installed and authenticated.
- An active AWS CloudTrail trail that captures management events in your deployment Region.
- An AWS DevOps Agent space with topology discovery turned on. The setup wizard can create this for you.
Deployment takes about 20 minutes. Because the solution is fully serverless and uses on-demand or pay-per-request pricing, you pay only when events flow through the pipeline. You can estimate the cost for your event volume with the AWS Pricing Calculator.
Walkthrough
In this walkthrough, you deploy the solution with the setup wizard, upload the custom skill that teaches the agent its methodology, and configure where notifications go. You then send a test Health event through the full pipeline and validate the results. The next sections take each step in turn, and you can find the complete source code in the GitHub repository.
Deploy the solution
Deploying the solution provisions the components described in the Overview of solution section: the Amazon EventBridge rules, the Lambda functions, the Step Functions workflow, the DynamoDB tables, and the Amazon SNS topic. The setup wizard is the recommended way to deploy. It performs these steps:
- Verifies your prerequisites.
- Creates or selects a DevOps Agent space and associates your account for topology discovery.
- Creates the IAM roles.
- Generates the webhook and stores the secrets in AWS Systems Manager Parameter Store as SecureString parameters.
- Deploys the AWS CDK stack.
To deploy the solution, run this command from the repository root:
npx ts-node scripts/setup-wizard.ts
The wizard prompts you for your target Region first, then walks through each step. Answer the prompts as follows:
- Region: choose from the numbered list of supported Regions.
- Agent space: if the wizard finds an existing space, confirm whether to reuse it. Otherwise, accept the default name (
health-event-analyzer) and description to create one. - Notification channels: enter an email address for default routing, and optionally a Slack or Microsoft Teams webhook URL. You can skip any channel and add it later.
- Deployment: review the configuration summary the wizard prints, then confirm to deploy the AWS CDK stack.
If a step fails, it offers to retry, skip, or cancel, then prints a summary when it finishes. The wizard writes secrets such as the webhook signing secret and any Slack or Microsoft Teams URLs to Parameter Store. The Lambda functions read them at runtime, so they never receive the values as plaintext environment variables.
After the account association step, confirm that topology discovery is running. Open the Topology page in the AWS DevOps Agent operator app and verify that your resources appear. Discovery takes a few minutes on the first run, and the agent needs it to map events to workloads.
If you’d rather create the space yourself, or the wizard’s space step fails, open the AWS DevOps Agent console, create an agent space, and connect the AWS account you want it to discover. Topology discovery starts automatically and takes a few minutes. You can confirm it on the Topology page of the operator app, then re-run the wizard and select the existing space.
Upload the custom skill
The agent needs the impact-assessment methodology before it can investigate. You’ll find the skill in devops-agent-skill/SKILL.md, with a packaged version in devops-agent-skill/health-event-impact-assessment.zip. To add it to your space:
- Open the AWS DevOps Agent console and select the agent space you deployed against.
- Go to the skills area of the space.
- Upload the skill package,
health-event-impact-assessment.zip. - Confirm the skill appears in the space’s skills list and shows as active.
The skill instructs the agent to identify affected resources, assess scope and redundancy, assign severity, and identify owning teams from tags. It then returns its findings in a fixed markdown structure that the Investigation Callback Lambda function parses.
The first test investigation confirms the skill loaded correctly. When the agent follows the methodology, its output lists affected workloads, the severity it assigned to each, and the owning teams in that structured format. If the output skips this structure, the skill did not load. Re-upload the package and confirm it is active before testing again.
Configure notification routing
You route notifications by seeding the teams table, health-analyzer-teams. Each item maps a team to its channels and the severities it cares about. The teamId is the key that ties routing to your infrastructure: it must match the owning-team tag value the agent reads from your resources. A resource tagged team: payments, for example, routes to the item whose teamId is payments.
Each item uses these attributes:
teamId(string) — matches the owning-team tag value on your resources.teamName(string) — a human-readable label used in the notification text.email(string) — the address subscribed for Amazon SNS email.slackWebhookUrlandslackChannel(string, optional) — the Slack incoming webhook and target channel.msTeamsWebhookUrl(string, optional) — the Microsoft Teams webhook.notifyOn(string set) — the severities that trigger a notification, drawn fromCRITICAL,HIGH,MEDIUM, andLOW.
The seed-teams.sh script writes a few sample teams so you can see the shape. Before running it, make the script executable (Linux and macOS only):
chmod +x ./scripts/seed-teams.sh
Then seed the table with the sample teams:
./scripts/seed-teams.sh health-analyzer-teams
To add one of your own teams, write an item directly with the AWS CLI:
aws dynamodb put-item --table-name health-analyzer-teams --item '{
  "teamId": {"S": "payments"},
  "teamName": {"S": "Payments Team"},
  "email": {"S": "payments-oncall@example.com"},
  "slackWebhookUrl": {"S": "https://hooks.slack.com/services/T00/B00/XXXXX"},
  "slackChannel": {"S": "#payments-alerts"},
  "notifyOn": {"SS": ["CRITICAL", "HIGH", "MEDIUM"]}
}'
If you leave the teams table empty, the solution falls back to the default routing described in the Overview of solution section. It publishes to the default Amazon SNS topic and resolves your AWS account alternate contacts. Set the notification email during setup, and configure the alternate contacts in the AWS Billing console, so default routing always has somewhere to send.
Test the pipeline
With the pipeline deployed and routing configured, the solution is ready to process events. From now on, you can wait for the next AWS Health notification and receive a detailed analysis automatically, ready to share with your teams. If you’d prefer to verify everything right away using a test event, continue with this section.
EventBridge reserves the aws.health source, so you can’t publish a synthetic Health event onto the bus. Instead, you test by invoking the Event Router Lambda function directly with one of the sample events in the events/ folder. This drives the same flow a real Health event would: Event Router, Step Functions, DevOps Agent, callback, OpsItem, and notifications.
To send a test event, first set your Region. Use the same Region you deployed to:
export AWS_REGION="us-east-1" # Replace with your deployment Region
Then run these commands:
EVENT_ROUTER=$(aws lambda list-functions --region $AWS_REGION --no-cli-pager \
  --query "Functions[?contains(FunctionName,'EventRoute')].FunctionName" --output text)

aws lambda invoke \
  --function-name "$EVENT_ROUTER" \
  --payload file://events/test-lambda-deprecation-event.json \
  --cli-binary-format raw-in-base64-out \
  --region $AWS_REGION \
  --no-cli-pager \
  /tmp/test-response.json && cat /tmp/test-response.json
The test-lambda-deprecation-event.json payload simulates a Node.js runtime end-of-life event affecting the stack’s own Lambda functions. This produces a confirmed-impact result you can follow all the way through.
Validate the results
With a test event in flight, you can watch each stage of the pipeline and confirm it produced the right output.
Start in the AWS Step Functions console. Open the state machine created by the stack and select the most recent execution. Watch it move from the investigation trigger, through the wait-for-task-token state, to the Has Findings? choice state. A successful run ends in a Succeeded state, and for a confirmed-impact event it passes through the CreateOpsItem and notification states rather than the no-impact branch.
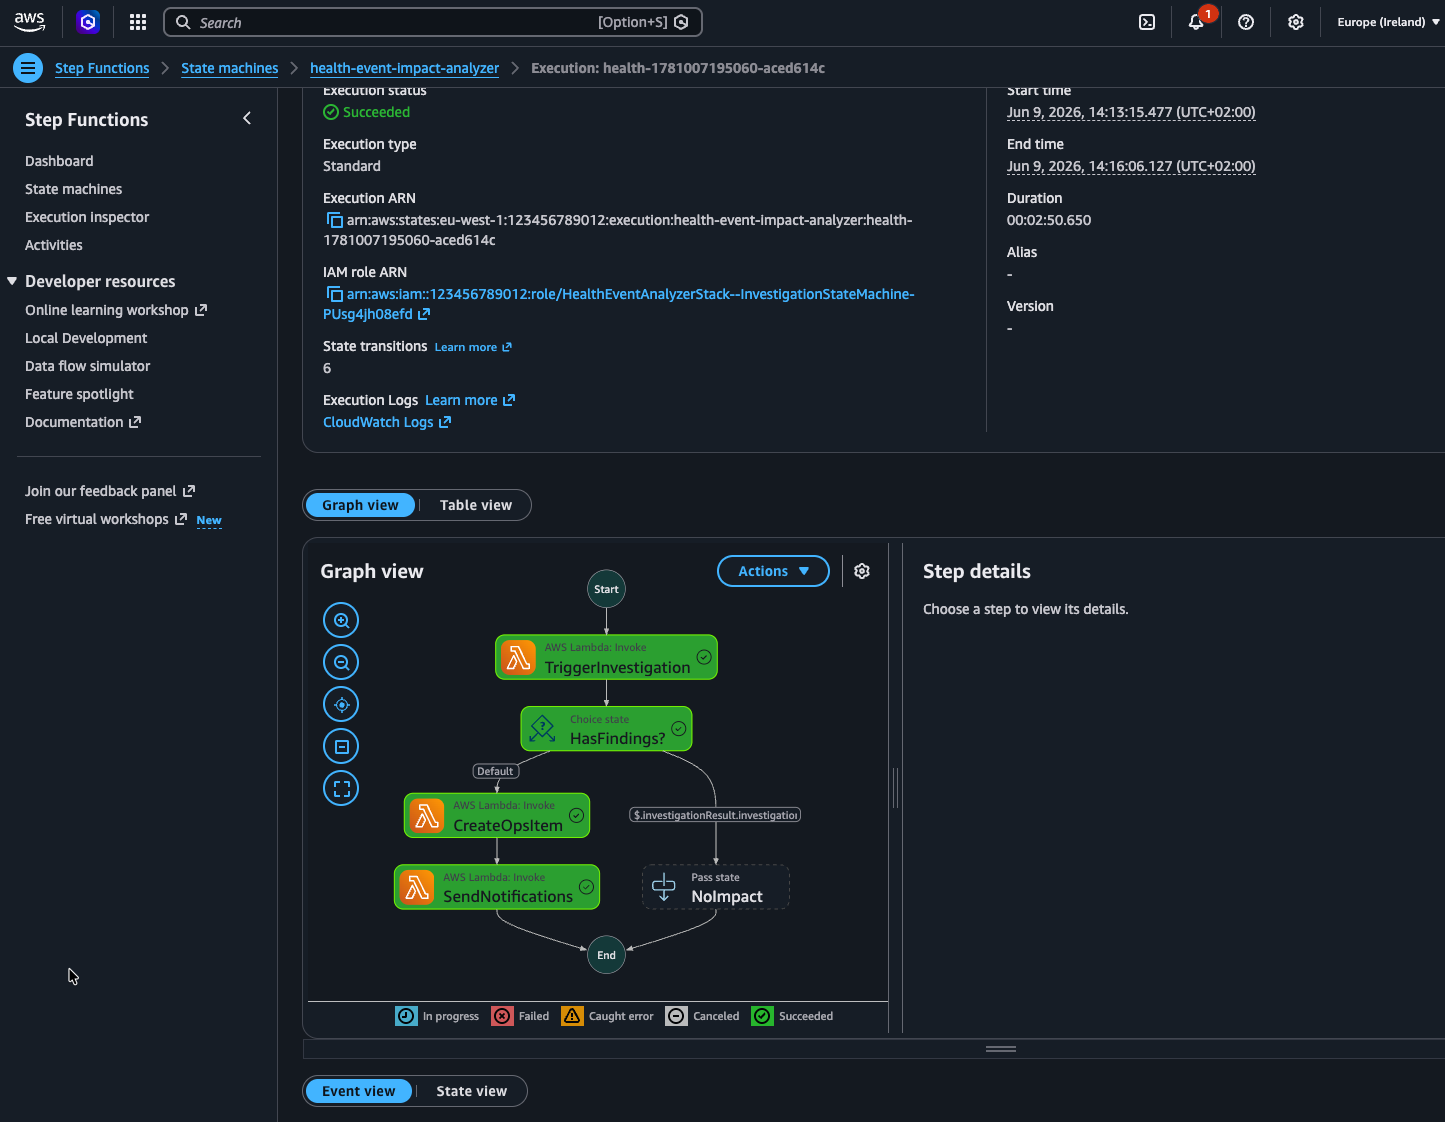
Figure 2: Step Functions execution moving through the investigation trigger, the wait-for-task-token state, and the impact decision.
Next, open the investigation in the AWS DevOps Agent operator app. The investigation for your test event shows its status, and as it runs you can watch the agent work through the impact-assessment skill against your topology.
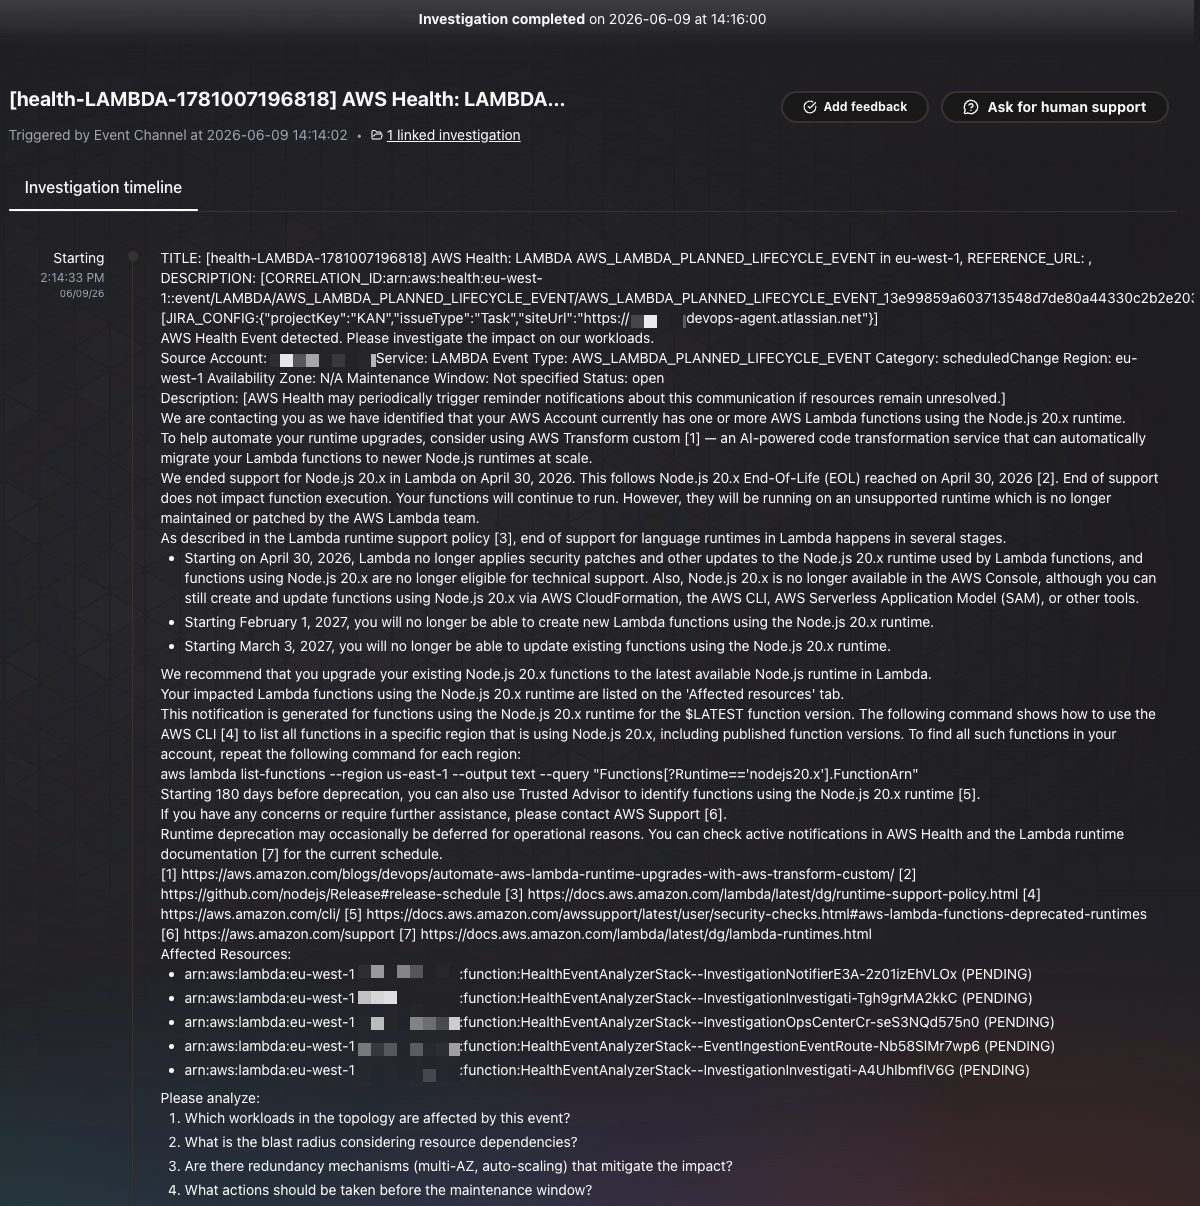
Figure 3: An investigation starting in the AWS DevOps Agent operator app.
As the investigation proceeds, the agent applies the skill’s methodology step by step, listing the affected workloads, the severity it assigned to each, and the teams it identified from resource tags.
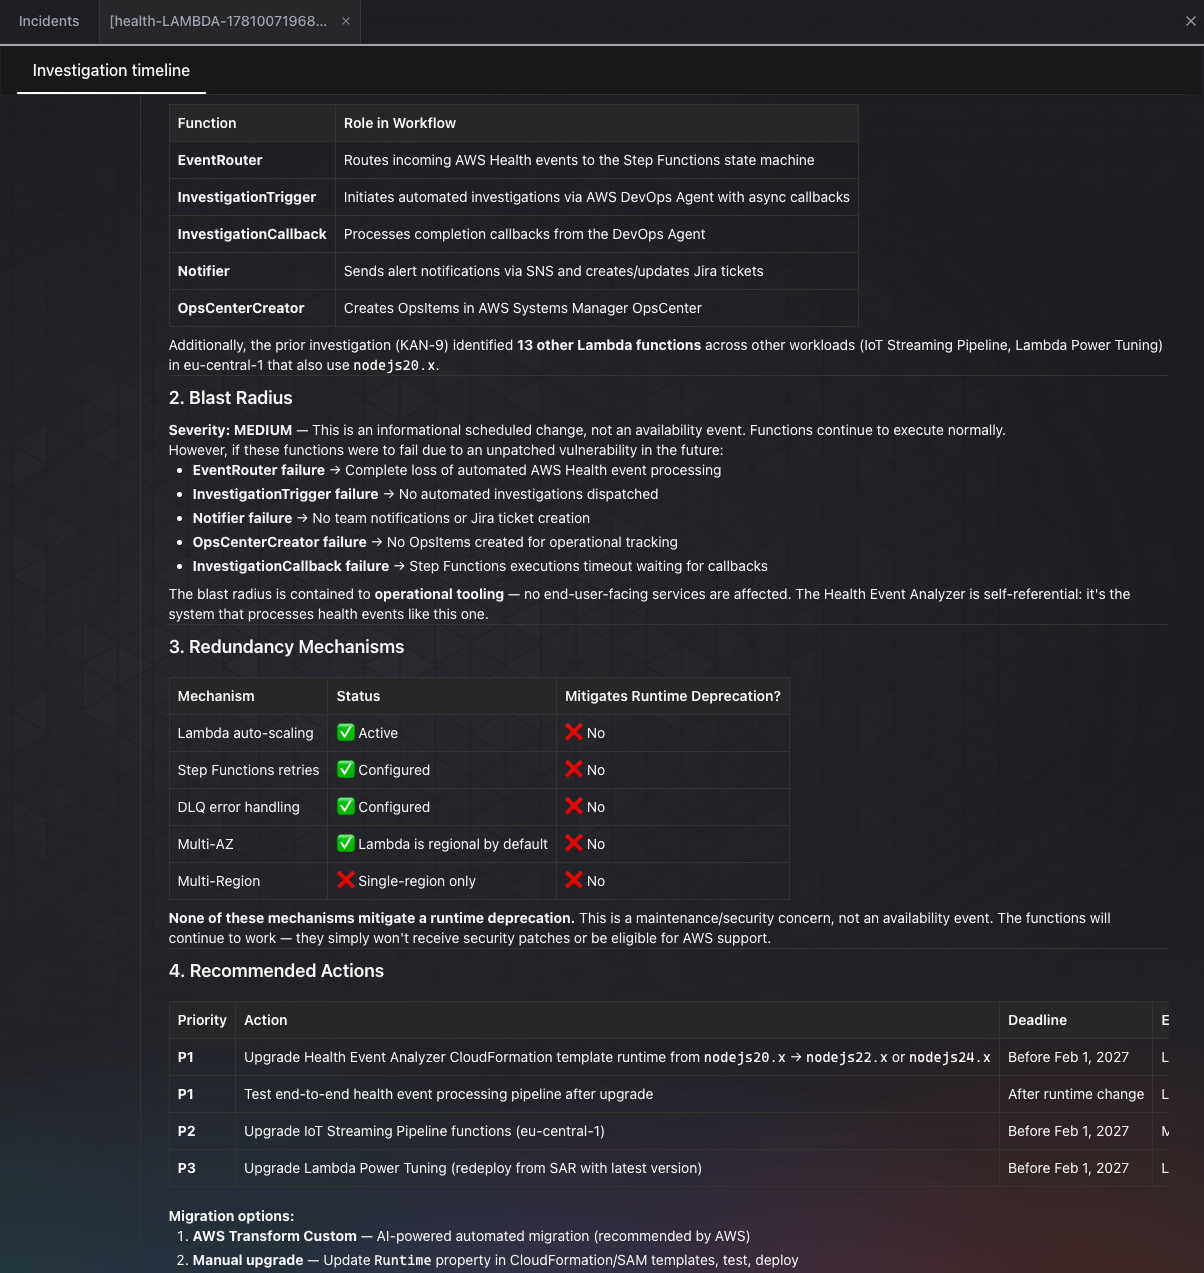
Figure 4: The agent applying the impact-assessment skill against the discovered application topology.
The operator app also gives you a dashboard view of past and in-progress investigations, so you can see how the agent has triaged events over time.
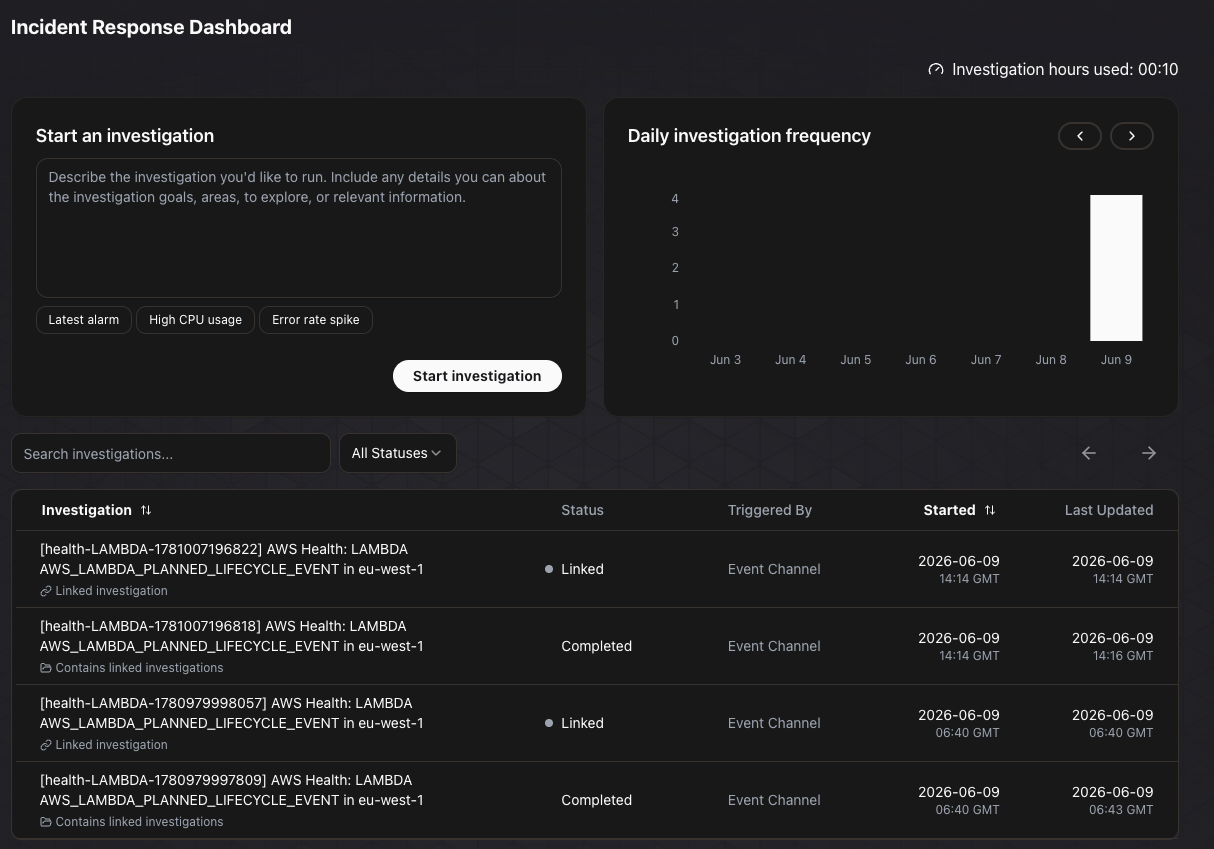
Figure 5: The AWS DevOps Agent dashboard listing past and in-progress investigations.
Finally, confirm the tracking record in AWS Systems Manager OpsCenter. Open OpsCenter and find the new OpsItem for the event. Confirm that its severity matches the investigation priority, its status is Open, and its description carries the agent’s summary, findings, recommendations, and a link back to the investigation. The same details reach the owning teams through the channels you configured: an email from the Amazon SNS topic, plus a Slack or Microsoft Teams message for any team whose notifyOn list includes the event’s severity.
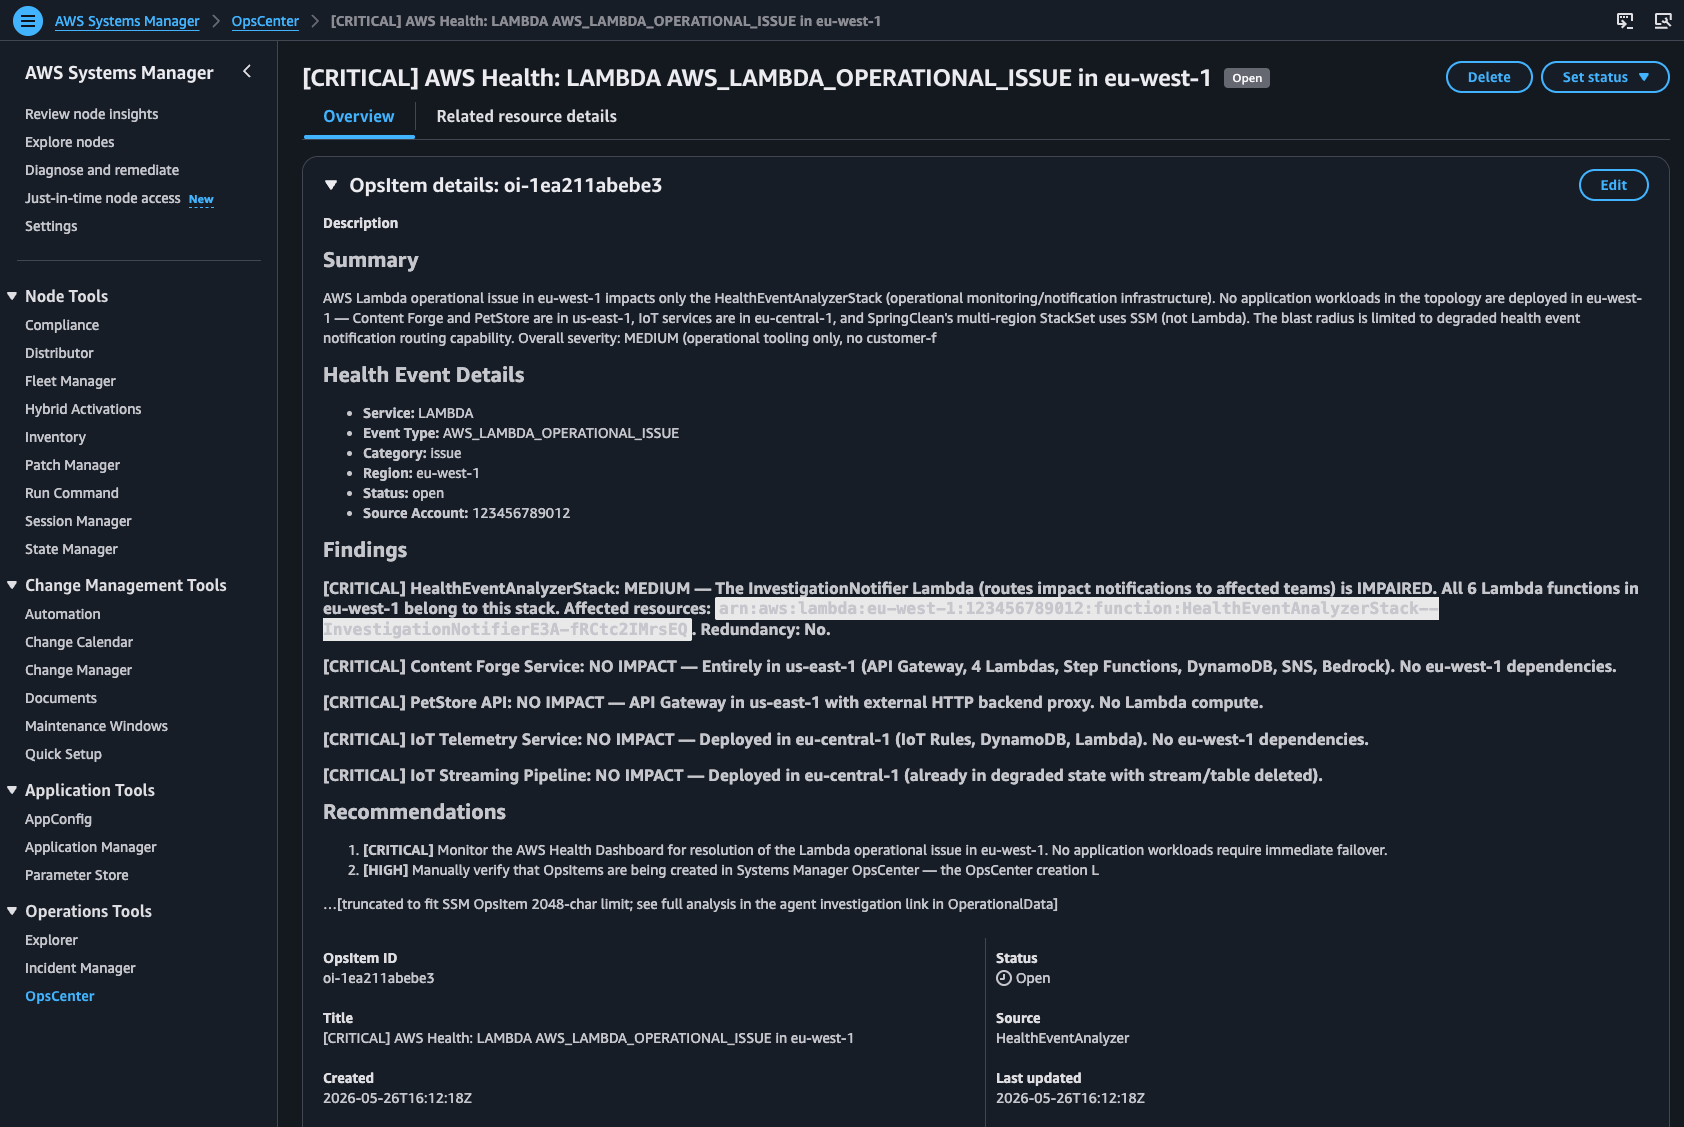
Figure 6: The OpsCenter OpsItem carrying the agent’s severity, summary, findings, and a link to the investigation.
Optional: File Jira tickets automatically
If your teams track work in Jira, you can have the agent open a ticket for any event it scores MEDIUM impact or higher. The setup wizard registers the Atlassian Rovo MCP server, associates it with your agent space, and writes the routing configuration to Parameter Store. To add this to an existing deployment, run npx ts-node scripts/setup-wizard.ts --jira-only.
Cleaning up
The pipeline is serverless and incurs no charges while idle, so you can leave it in place without ongoing cost. But if you deployed it to evaluate the solution and no longer need it, remove the resources it created. Run the cleanup script from the repository root:
npx ts-node scripts/cleanup.ts
The script removes the CDK stack, agent space associations, and SSM parameters that the setup wizard created. In a production configuration, the DynamoDB tables are retained by default to protect operational data; delete them manually if you no longer need their contents.
Finally, revoke any credentials you created for external integrations. The cleanup script removes the SSM parameters that held your Slack and Microsoft Teams webhook URLs, but the webhooks themselves still live in those services, so delete them there. If you set up the Jira integration, revoke the Atlassian API token and remove the Rovo MCP server association.
Conclusion
You now have an event-driven solution that uses AWS DevOps Agent to assess AWS Health event impact against your live topology and route confirmed-impact findings to the right teams. The agent does the analysis that an on-call engineer would otherwise do by hand: mapping resources to workloads, judging redundancy and severity, and finding the owning team. The workflow notifies people only when the impact is real. Because every component uses serverless and on-demand pricing, the pipeline incurs no charges while waiting for the next event.
From here, you can extend the notification channels to match how your teams work. You can also adopt the AWS Health organizational view to cover every account from one place and tune the agent’s skill methodology to reflect your own severity thresholds and ownership conventions. To get started, deploy the GitHub repository and read the AWS DevOps Agent documentation to learn more about topology discovery and custom skills. Leave a comment to share how you adapted it for your environment.