AWS Security Blog
Reduce alert fatigue by customizing threat detection features in Amazon GuardDuty
The teams responsible for security today don’t have a problem with the number of alerts they receive; they have a problem turning those alerts into something truly actionable. When an analyst concludes an investigation with “this was caused by our vulnerability scanner” or “this account is configured to share Amazon Machine Images (AMIs) publicly on purpose,” the detection worked as designed, it just wasn’t applicable to the environment. When this happens continuously at scale, alert fatigue sets in. As teams sort through these events, incident response slows down or, worse, teams stop paying attention to the alerts at all.
Amazon GuardDuty is a threat detection service that continuously monitors, analyzes, and processes Amazon Web Services (AWS) data sources and logs in your AWS environment for suspicious or potentially malicious activity. GuardDuty then delivers detailed security findings to you for visibility and remediation. GuardDuty accomplishes this by analyzing independent streams of available sources. This includes logging of management events in AWS CloudTrail, information about IP traffic through Amazon Virtual Private Cloud (Amazon VPC) Flow Logs, and Amazon Route 53 DNS query logs to name a few. These sources don’t need to be enabled or configured within your accounts for GuardDuty to use them. When GuardDuty observes activity that looks suspicious or anomalous, it produces a finding that’s a detailed security alert naming the behavior, the resources involved, and any supporting evidence. A finding is a signal to investigate, not a final verdict.
While the managed detections in GuardDuty work consistently across every AWS customer, personalizing detections for your specific architectures and environments is equally important. Over the past year, AWS has released a set of capabilities within GuardDuty that you can use to supply that missing context, most recently with the launch of Custom Detection Rules.
In this post, we walk through those capabilities in three distinct stages. These stages explore how to customize what GuardDuty detects, triage the findings that remain, and accelerate investigations. Throughout this blog post you’ll learn how to:
- Efficiently detect anomalous behavior that shouldn’t occur in a specific account, without building detection logic yourself
- Measure if a detection will be noisy before it generates a single finding, flooding security teams
- Feed your own custom threat intelligence, including file hashes, into GuardDuty
- Scope a suppression rule narrowly enough to archive expected activity while surfacing the same behavior elsewhere
- Get an automated analysis of a finding, with a risk level and recommended actions, before the finding is opened manually
Prerequisites
For the walkthrough in this post, you must have the following prerequisites in place.
- GuardDuty must be enabled in at least one AWS account and AWS Region. Note that these customization features aren’t currently available in all Regions, for more information, see Region-specific feature availability.
- Your user or role must have AWS Identity and Access Management (IAM) permissions to configure these features in GuardDuty. The
AmazonGuardDutyFullAccess_v2managed policy covers the required actions. - If you manage multiple accounts through AWS Organizations, AWS recommends administering GuardDuty using the delegated administrator account. By using this method, you can manage lists, suppression rules, and conduct investigations from a centralized location.
- GuardDuty Runtime Monitoring must be enabled to conduct file hash matching and to use Custom Detection Rules for Runtime Monitoring. This protection plan isn’t enabled automatically in GuardDuty.
- An Amazon Simple Storage Service (Amazon S3) bucket that you control for storage of custom threat entity lists.
- The AWS Command Line Interface (AWS CLI) installed.
Stage 1: How to customize what GuardDuty detects
An AMI is a pre-configured template that contains the software configurations needed to launch an Amazon Elastic Compute Cloud (Amazon EC2) instance on AWS. Sharing an AMI publicly can be a routine operation in an account whose purpose is distributing images, and a potential security event in any other account. The same might be said for disabling VPC Flow Logs, or signing in without multi-factor authentication for a legacy service account. Until the release of Custom Detection Rules, there was no way to account for these differences in GuardDuty.
Custom Detection Rules
Custom Detection Rules is a library of prebuilt, opt-in rules that AWS builds and maintains. At launch, it holds 90 rules across AWS CloudTrail management events and GuardDuty Runtime Monitoring events, producing 38 finding types mapped to 13 MITRE ATT&CK® tactics, described using vocabulary from ATT&CK and the Threat Technique Catalog for AWS. The catalog is maintained by the AWS Customer Incident Response Team (CIRT) and is based on the MITRE ATT&CK Cloud Matrix, documenting threat actor tactics, techniques, and procedures specific to AWS as observed by the AWS CIRT during customer engagements. Each entry includes detection guidance and mitigations specific to AWS environments, so a technique ID on a finding points to a public entry that your team can read.
Previously, detecting environment-specific behavior meant ingesting your own CloudTrail logs or host telemetry, normalizing them, building the logic, and maintaining that logic as APIs changed. Custom Detection Rules remove that work. You select the rules for GuardDuty to evaluate against the CloudTrail management events it already analyzes and, where Runtime Monitoring is enabled, the runtime events from the GuardDuty security agent, without the undifferentiated heavy lifting of log ingestion, normalization, and storage. Coverage is extended without adding unnecessary alerts that don’t add value to your teams.
Each rule runs in one of two modes. In dry run mode, GuardDuty evaluates the rule and publishes Amazon CloudWatch metrics showing how often an event matched the rule, but generates no findings. Dry run mode expires automatically after 14 days. In live mode, events that match generate findings, and live mode has no expiration.
Custom Detection Rules are currently available in all AWS commercial Regions and the AWS GovCloud (US) Regions. Custom Detection Rules for Runtime Monitoring are available in every region where GuardDuty Runtime Monitoring is available.
Walkthrough: Measure a rule, then turn it on
Start in dry run so you can measure the noise level before receiving a finding. This walkthrough uses the AMIExternalAccess rule, which detects when an AMI is shared with an external AWS account or made public, and applies it from the GuardDuty delegated administrator account. In an organization, the delegated administrator manages Custom Detection Rules for all member accounts through an organization configuration, and accounts that join the organization later inherit it.
Using the GuardDuty console
- Open the AWS Management Console for GuardDuty and choose Custom Detection Rules.
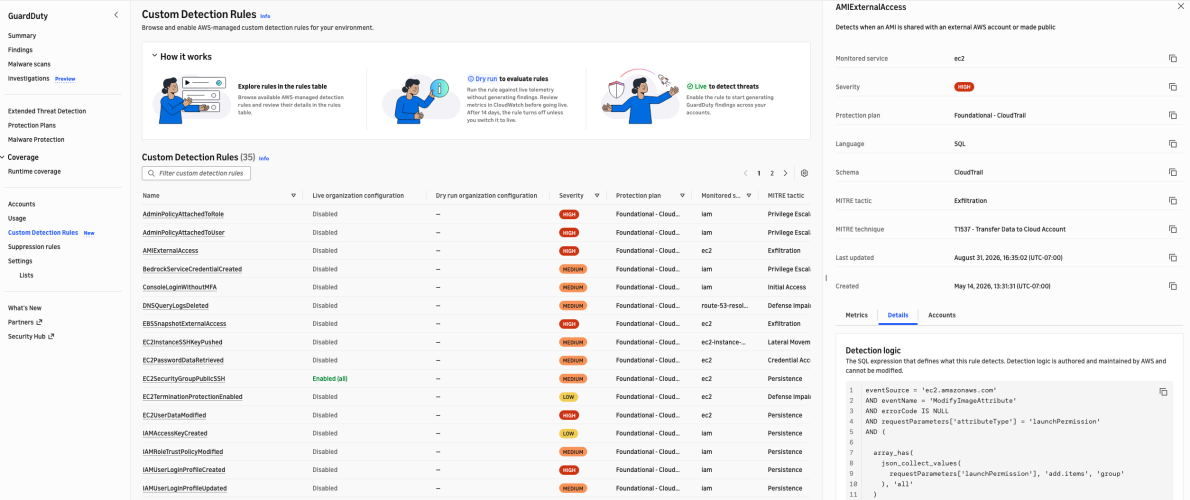
Figure 1. The Custom Detection Rules catalog with the detection logic for the AMIExternalAccess rule
- Select a rule name to see its detection logic on the Details tab. Rules are SQL conditions over CloudTrail fields, so you can review exactly what a rule matches before enabling it.
- Choose the rule’s Accounts tab, then under Organization configuration, choose Configure.
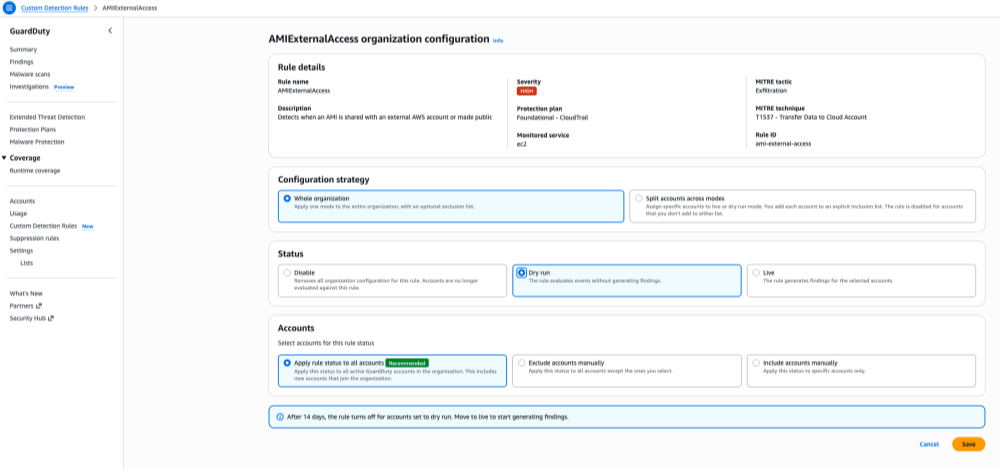
Figure 2. Configuring the AMIExternalAccess rule in dry run mode
- Under Configuration strategy, select Whole organization. Under Status, select Dry run. Under Accounts, select Apply rule status to all accounts, then choose Save.
- Watch the
CustomRuleDryRunSignalsMatchedmetric in CloudWatch. GuardDuty publishes the metric only when the rule matches an event, so a rule with no matching activity shows no data. Because dry run mode expires automatically after 14 days, a full dry-run period is the longest continuous sample GuardDuty collects without you re-enabling the rule. The metric data persists in CloudWatch under its standard retention after the dry run ends, so you can review it shortly before or after expiry and still base your decision on the most complete data available. Volume alone doesn’t tell you whether the activity is benign, so account for what you see before deciding. If a rule matches constantly and someone can point to the process that causes it, that account is a poor candidate for live mode. If nobody can explain the matches, investigate them as they stand, because a dry run measuring real attacker activity looks the same as one measuring routine operations.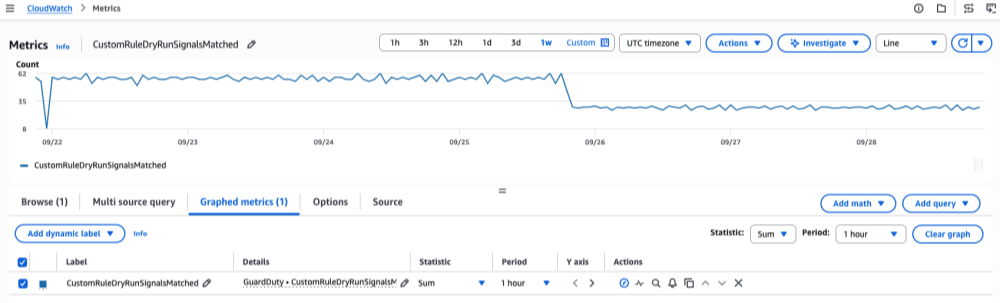
Figure 3. Dry-run match volume for a rule over one week, shown as hourly totals
- When you’re satisfied the rule is worth acting on, return to the rule’s organization configuration and change Status to Live to start generating findings. To keep the rule off in accounts where the activity is expected, such as an image-build account, choose Exclude accounts manually under Accounts and select those accounts.
Using the AWS CLI
- From the delegated administrator account, apply the rule in dry run to the whole organization. Omitting account lists targets every member account, including accounts that join later.
- Review the
CustomRuleDryRunSignalsMatchedmetric over the dry-run period, applying the same judgment described in the preceding console procedure. - Move the rule to live mode by updating the existing configuration. Creating a second whole-organization configuration for the same rule fails with a conflict error. To exclude accounts where the activity is expected, add
--exclude-account-ids.
Note: In a standalone account that isn’t part of an organization, you enable a rule for that account alone. With the AWS CLI, use
create-custom-detection-rule-associationwith the same--rule-idand--modeparameters. To change the mode later, useupdate-custom-detection-rule-associationwith the association ID. Member accounts in an organization can’t enable or change a rule themselves; the delegated administrator manages rules on their behalf. For details, see Managing Custom Detection Rules in multiple-account environments.
Threat entity lists
If your threat intelligence team already tracks known-bad infrastructure and files, you can pass those indicators to GuardDuty and generate findings when they appear in your AWS account.
GuardDuty has two list formats. An IP address list holds IP addresses only. An entity list, the newer format, can hold IP addresses, CIDR ranges, and domain names together in a single file. The difference that matters is coverage: entity list entries apply to CloudTrail, VPC Flow Logs, and Amazon Route 53 Resolver DNS query log findings, while IP address lists cover CloudTrail and VPC Flow Log findings only. If you still use IP address lists, the additional DNS coverage is a reason to move.
In addition, entity lists now also accept SHA-256 file hashes. Hashes sit alongside network indicators in the same file, and GuardDuty checks them against Runtime Monitoring. When the runtime agent sees an executable whose hash matches an active list, it generates a high severity Execution:Runtime/MaliciousFileExecuted.Custom finding and names the matching list, so your responder knows which intelligence source was used.
Note: If the entity list is changed, the list must be reactivated to include the updates. Uploading a new version of the file isn’t sufficient on its own. If this step is automated, build that reactivation step into the same process that refreshes the file.
Entity lists are currently available in all AWS commercial Regions, but not in the AWS GovCloud (US) Regions.
Stage 2: How to triage the findings that remain
Customizing detection reduces findings at the source, but the work is rarely finished there. New workloads appear, teams change how they operate, and some findings still describe activity that’s expected in your environment. You also need a precise way to route those events away from the queue your analysts work from.
A filter selects findings. A suppression rule is a filter that automatically archives a GuardDuty finding it matches. Archiving isn’t deletion: the finding is retained for 90 days and stays viewable, but the finding isn’t forwarded to AWS Security Hub, Amazon S3, Amazon Detective, or Amazon EventBridge, so it stays out of your security information and event management (SIEM) system and ticket queue.
Two changes have made that routing more customizable.
Wildcards
Filter criteria now support the Matches and NotMatches operators, where * matches any number of characters and ? matches one. Criteria used to be exact-match only, so suppressing findings from every AWS Lambda function in a service meant listing each name and updating it on every deployment. One pattern now covers the naming convention, including functions that don’t exist yet, so the rule stops going stale.
Additional property filter fields
You can now use over 1,000 supported fields from a finding as suppression criteria, including runtime process details, Kubernetes workload metadata, network connection information, and attack sequence signals. Take a vulnerability scanner in one Kubernetes namespace generating expected findings. With no namespace criterion available, you previously either suppressed the finding type more broadly than you wanted or wrote downstream logic to strip them. Now you scope the rule to that specific namespace and leave detection intact everywhere else in the cluster. This expanded field set is available in the aws partition; other partitions continue to use the console-supported fields only. See Filtering findings in GuardDuty for the full list of supported fields.
The recommended method is to assemble your criteria on the Findings page first, confirm the filtered list contains only findings you’re willing to archive, then choose Create suppression rule. The console and CLI procedures are detailed in the user guide.

Figure 4. Findings filtered by finding type and Kubernetes namespace, before creating a suppression rule
Before you write wildcard criteria, know that they can’t be validated with ListFindings or GetFindingsStatistics, the testing workflow AWS recommends for ordinary filters. Instead, start from a filter that takes no action and watch the suppression rule metrics to see how much it would match before you rely on it. Nothing is lost if the pattern is too broad, matched findings are archived rather than deleted, so you can lift the suppression rule and return them to your queue.
Stage 3: How to accelerate investigations
What remains consumes analyst hours. To decide whether a finding is a real event, an analyst pivots into CloudTrail for the operations that identity performed, lines up timestamps, checks IPs and domains against intelligence, and looks for a change ticket that explains the work. That can take hours, and most such investigations end in expected. When one doesn’t, all that time was spent before any actual containment could begin.
GuardDuty Investigation, also called AI-powered investigations performs that correlation automatically. GuardDuty Investigation analyzes the finding alongside related activity from the past 90 days, affected resources, threat intelligence, and threat indicators, and returns a structured summary in minutes: a risk level, a confidence rating, a written summary, supporting detail, MITRE ATT&CK classification, and recommended actions including the CLI commands to carry them out.
Note: Read the confidence rating as carefully as the risk level. High risk with low confidence is a very different indicator to an analyst than high risk with high confidence.
You can investigate a single finding, an account, or a whole organization, from the console, the AWS CLI, the API, or an AWS MCP Server. To turn on AI-powered investigations, go to Settings, find AI powered investigations – Preview, and choose Enable.
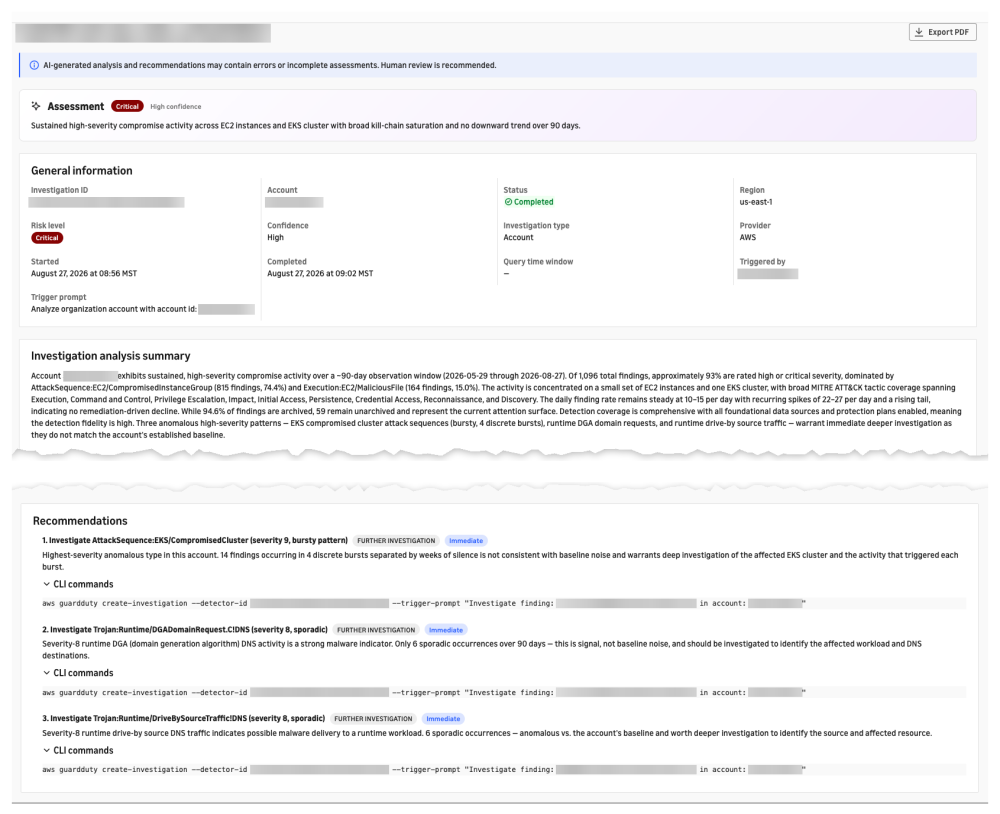
Figure 5. A completed account investigation with risk level, confidence, analysis summary, and recommended actions
The preview runs in 10 AWS Regions: US East (N. Virginia), US East (Ohio), US West (Oregon), Canada (Central), Europe (Frankfurt), Europe (Ireland), Europe (London), Europe (Paris), Europe (Stockholm), and Asia Pacific (Tokyo). It allows 10 investigations per account per day and 100 per account in total, and can only be started from an administrator account, member accounts can’t create investigations from their own accounts. The feature uses Amazon Bedrock models with Cross-Region Inference (CRIS), which automatically selects a Region within your geography to process the analysis and generate the report. Your data remains stored only in the Region where the investigation request originates, but investigation data and summary results might be processed outside that Region. Review that routing if you have data residency commitments. For GuardDuty Region-specific differences more broadly, see Region-specific feature availability in the user guide.
Putting it all together
Consider a team running containerized workloads on Amazon Elastic Kubernetes Service (Amazon EKS) across a handful of accounts in one organization.
The threat intelligence team uploads SHA-256 hashes from a recent brief as a threat entity list. Security engineering enables Custom Detection Rules in dry run mode and finds after 2 weeks that AMI sharing fires constantly in the image-build account and nowhere else, so they promote the rule to live across the organization and exclude the build account.
The team’s vulnerability scanner runs in a dedicated Kubernetes namespace, so they suppress that namespace and finding type while leaving the same behavior detected elsewhere. A second rule uses a wildcard on their Lambda naming convention, replacing a hand-maintained list.
Suppressed findings are archived instead of being sent to Security Hub, Amazon S3, EventBridge, or the SIEM, so they never reach the analyst queue. When a finding does warrant attention, an analyst starts an investigation and gets a disposition before manual work begins.
Each stage reduces the work of the next. Customizing detection means less to triage, effective triage means less to investigate, and automated investigation means the findings that reach a human get a decision faster.
Next steps
If you haven’t enabled GuardDuty, start with the 30-day free trial. Most protection plans enable automatically and are included, so you can evaluate them. Turn on Runtime Monitoring separately if you want to test hash matching or Custom Detection Rules for Runtime Monitoring..
If you’re already using GuardDuty:
- Enable two or three Custom Detection Rules in dry run mode. Choose behavior that shouldn’t occur in specific accounts, measure across the dry-run period, then promote selectively.
- Revisit existing suppression rules. Any rule written before the April 2026 field expansion might be broader than you intended, because the field you wanted wasn’t available then; narrow it to that field now.
- Audit filters for wildcard opportunities. Any filter with a growing list of exact-match names is maintenance a single pattern can replace.
- Migrate IP address lists to entity lists for the DNS query log coverage.
Conclusion
GuardDuty’s managed detections keep expanding, driven by AWS threat intelligence, security research, and customer feedback. These capabilities enable you to decide which activity is worth alerting on in which accounts, and which findings never need to be delivered to a human at all.
Learn more
- Custom Detection Rules in GuardDuty
- Managing Custom Detection Rules in multiple-account environments
- Customizing threat detection with entity lists and IP address lists
- Creating suppression rules in GuardDuty
- Suppression rule metrics
- Introducing the Amazon GuardDuty investigation agent: on-demand AI-powered threat assessment
- Amazon GuardDuty Regions and endpoints
- Amazon GuardDuty quotas
- Threat Technique Catalog for AWS
- Welcoming the AWS Customer Incident Response Team
- What the March 2026 Threat Technique Catalog update means for your AWS environment
- Amazon GuardDuty adds optional threat detection rules