AWS DevOps & Developer Productivity Blog
Improving the CPU and latency performance of Amazon applications using Amazon CodeGuru Profiler
Amazon CodeGuru Profiler is a developer tool powered by machine learning (ML) that helps identify an application’s most expensive lines of code and provides intelligent recommendations to optimize it. You can identify application performance issues and troubleshoot latency and CPU utilization issues in your application.
You can use CodeGuru Profiler to optimize performance for any application running on AWS Lambda, Amazon Elastic Compute Cloud (Amazon EC2), Amazon Elastic Container Service (Amazon ECS), AWS Fargate, or AWS Elastic Beanstalk, and on premises.
This post gives a high-level overview of how CodeGuru Profiler has reduced CPU usage and latency by approximately 50% and saved around $100,000 a year for a particular Amazon retail service.
Technical and business value of CodeGuru Profiler
CodeGuru Profiler is easy and simple to use, just turn it on and start using it. You can keep it running in the background and you can just look into the CodeGuru Profiler findings and implement the relevant changes.
It’s fairly low cost and unlike traditional tools that take up lot of CPU and RAM, running CodeGuru Profiler has less than 1% impact on total CPU usage overhead to applications and typically uses no more than 100 MB of memory.
You can run it in a pre-production environment to test changes to ensure no impact occurs on your application’s key metrics.
It automatically detects performance anomalies in the application stack traces that start consuming more CPU or show increased latency. It also provides visualizations and recommendations on how to fix performance issues and the estimated cost of running inefficient code. Detecting the anomalies early prevents escalating the issue in production. This helps you prioritize remediation by giving you enough time to fix the issue before it impacts your service’s availability and your customer’s experience.
How we used CodeGuru Profiler at Amazon
Amazon has on-boarded many of its applications to CodeGuru Profiler, which has resulted in an annual savings of millions of dollars and latency improvements. In this post, we discuss how we used CodeGuru Profiler on an Amazon Prime service. A simple code change resulted in saving around $100,000 for the year.
Opportunity to improve
After a change to one of our data sources that caused its payload size to increase, we expected a slight increase to our service latency, but we saw a higher than expected increase. Because CodeGuru Profiler is easy to integrate, we were able to quickly make and deploy the changes needed to get it running on our production environment.
After loading up the profile in Amazon CodeGuru Profiler, it was immediately apparent from the visualization that a very large portion of the service’s CPU time was being taken up by Jackson deserialization (37%, across the two call sites). As we had previously seen degraded latency during moderate CPU usage in our performance tests, it was also interesting that most of the blocking calls in the program (in blue) were happening in this Jackson deserialization.
Flame graphs represent the relative amount of time that the CPU spends at each point in the call graph. The wider it is, the more CPU usage it corresponds to.
The following flame graph is from before the performance improvements were implemented.

The Flame Graph before the deployment
Looking at the source for _createAndCacheValueDeserializer confirmed that there was a synchronized block. From within it, _createAndCache2 was called, which actually did the adding to the cache. Any serializer that wasn’t found in the cache was created here, which was problematic in our case because the flame graph showed expensive use of reflection as part of custom serializer creation for one of our types. Adding to the cache was guarded by a boolean condition which had a comment that indicated that caching would only be enabled for custom serializers if isCachable() was overrode to return true.
Solution
Checking the documentation for isCachable() confirmed that overriding this method looked like the correct solution for this performance issue. After we deployed a quick change to override isCachable() for our four custom deserializers, we observed that no visible time was spent in _createAndCacheValueDeserializer.
Results
Enabling caching of serializers directly reduced the amount of work that was needed to be done for each request to about half of its previous value. Also, because it was no longer holding a lock while it recreated the same deserializers for every call we were able to run the CPU at a higher utilization.
Reusing the deserializers avoided repeated work and saved us lot of resources.
After the CodeGuru Profiler recommendations were implemented, the amount of CPU spent in Jackson reduced from 37% to 5% across the two call paths. As this service didn’t call other services in most requests, this also dropped latency by about the same amount. As a bonus, because it was no longer holding a lock while it recreated the same deserializers for every call, we were able to run the CPU at a higher utilization without seeing latency degrade. This allowed us to reduce the fleet size even as traffic to the service grew 4x, saving $100,000 a year in Amazon EC2 costs.
The following flame graph shows performance after the deployment.

The Flame Graph after the deployment
Metrics
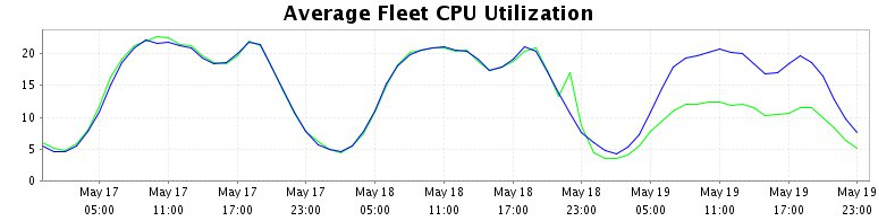
The following graph shows that CPU usage reduced by almost 50%. The blue line shows the CPU usage the week before we implemented CodeGuru Profiler recommendations, and green shows the dropped usage after deploying. We could later safely scale down the fleet to reduce costs, while still having better performance than prior to the change.
The following graph shows the server latency, which also dropped by almost 50%. The latency dropped from 100 milliseconds to 50 milliseconds as depicted in the initial portion of the graph. The orange line depicts p99, green p99.9, and blue p50 (mean latency).

Conclusion
With a few lines of changed code and a half-hour investigation, we removed the bottleneck which led to lower utilization of resources and thus we were able to decrease the fleet size.
Across Amazon, CodeGuru Profiler has been used internally among various teams and resulted in millions of dollars of savings and performance optimization. You can use CodeGuru Profiler for quick insights into performance issues of your application. The more efficient the code and application is, the less costly it is to run. You can find potential savings for any application running in production and significantly reduce infrastructure costs using CodeGuru Profiler. Reducing fleet size, latency, and CPU usage is a major win.
About the Authors

Neha Gupta is a Solutions Architect at AWS and have 16 years of experience as a Database architect/ DBA. Apart from work, she’s outdoorsy and loves to dance.

Ian is a Senior Software engineer with the Last Mile organization at Amazon. In his spare time, he enjoys exploring the Vancouver area with his family.