AWS Big Data Blog
Long-term Amazon Redshift observability with Datadog and Amazon S3 Tables
Building long-term observability for Amazon Redshift starts with a question: what happened in your data warehouse last month, last quarter, or last year? Amazon Redshift captures operational history across more than 25 system views. These views range from query execution details in SYS_QUERY_HISTORY and full query text in SYS_QUERY_TEXT to connection activity, user changes, workload management events, and resource consumption metrics. Together, these views form a detailed record of the operations running inside your Amazon Redshift clusters and Amazon Redshift serverless workgroups. Amazon Redshift retains this data for 7 days. After that window closes, the history is gone. You lose the ability to audit past activity, investigate slow-moving regressions, or satisfy compliance requirements that can span months or years.
The system table integration with Amazon S3 Tables, a capability of Amazon Redshift, changes this. When you enable the integration, Amazon Redshift automatically and continuously delivers system table data as Apache Iceberg tables to Amazon S3 Tables in your account. You own the data, you set the retention policy, and S3 Tables handles compaction and snapshot maintenance. You can query the exported data with Amazon Redshift, Amazon Athena, or any Iceberg-compatible engine. There’s no charge for delivery. You pay only for S3 Tables storage, requests, maintenance, and the engine you use to read the data.
AWS and Datadog collaborated to make this exported data actionable for observability. Datadog, an AWS Specialization Partner and AWS Marketplace Seller, provides an observability and security platform for cloud applications. Datadog Data Observability helps data teams improve the reliability of data for analytics and AI. It combines quality monitoring for warehouses such as Amazon Redshift with jobs monitoring for pipelines that run on AWS Glue, Amazon EMR, Apache Airflow, and dbt. It then connects them with lineage that spans from source pipelines to downstream dashboards. By reading query history directly from S3 Tables, Datadog turns it into column-level lineage, query analysis, and context for quality alerts, without adding load to your warehouses to collect it. For AWS managed monitoring of Amazon Redshift metrics and logs, you can also use Amazon CloudWatch. Datadog Data Observability is billed separately by Datadog.
In this post, we show how to configure Datadog Data Observability to read Amazon Redshift query history from S3 Tables. We walk through granting Datadog read access and using the query history for column-level lineage, query analysis, and data quality monitoring.
Solution overview
Datadog Data Observability uses Amazon Redshift query history to build column-level lineage, analyze query performance, and give context to data quality alerts. Previously, Datadog collected this history by running read-only SQL against each warehouse every hour. With this solution, Datadog reads the same history from S3 Tables instead. The following diagrams show the solution at a high level and compare query history collection before and after the integration.
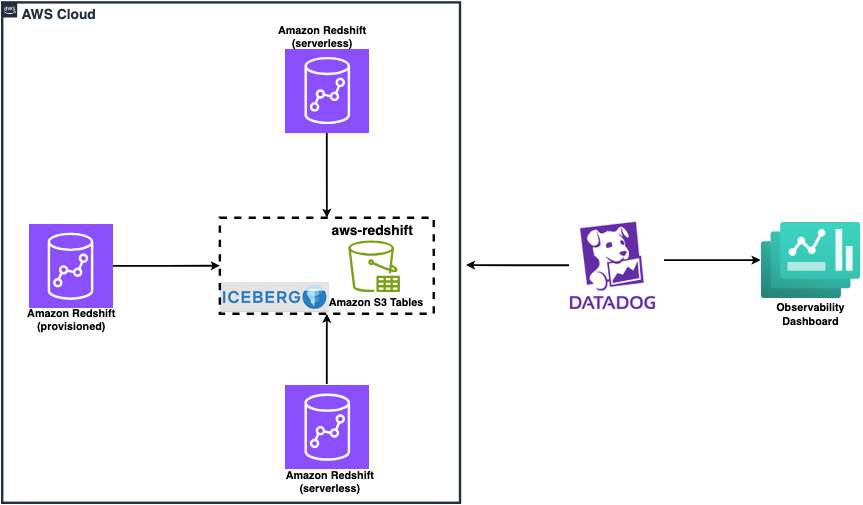
Figure 1: High-level solution overview
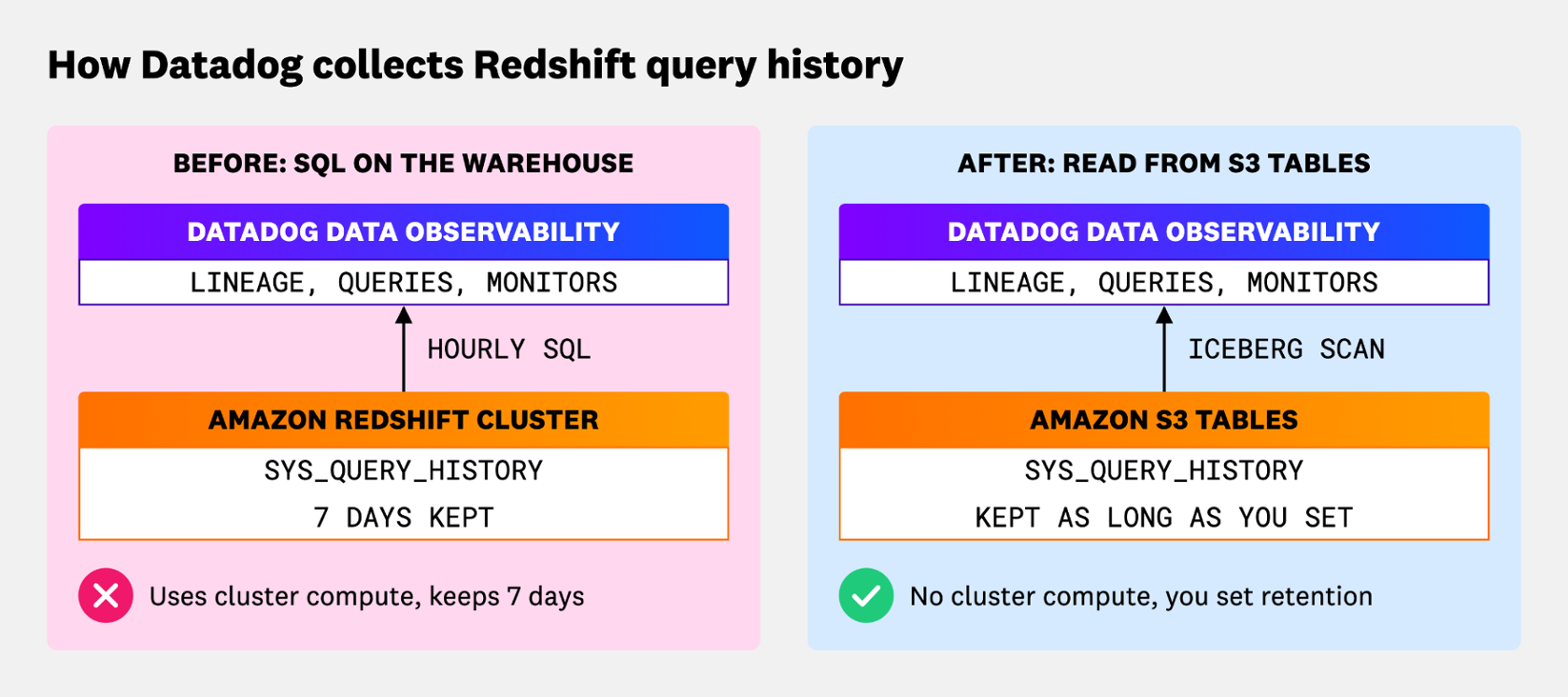
Figure 2: Query history collection before and after the S3 Tables integration
This approach offers the following benefits:
- Retention beyond 7 days. Query history remains in your account for as long as you choose to retain it. Because history is kept in S3 rather than expiring after 7 days in the cluster, Datadog can backfill any collection gap when it resumes. You don’t lose queries or lineage. Your audit and compliance teams also keep a long-term record of query activity in your own account.
- No added load on the warehouse. Datadog reads the Iceberg tables through the S3 Tables Iceberg REST endpoint. Collecting query history doesn’t run queries on your clusters or workgroups or consume their compute.
- One view across warehouses. Datadog combines query history from every connected cluster and workgroup into a single lineage graph, together with other connected tools such as dbt, Apache Airflow, Tableau, Looker, and Power BI.
The following diagram illustrates the solution architecture.
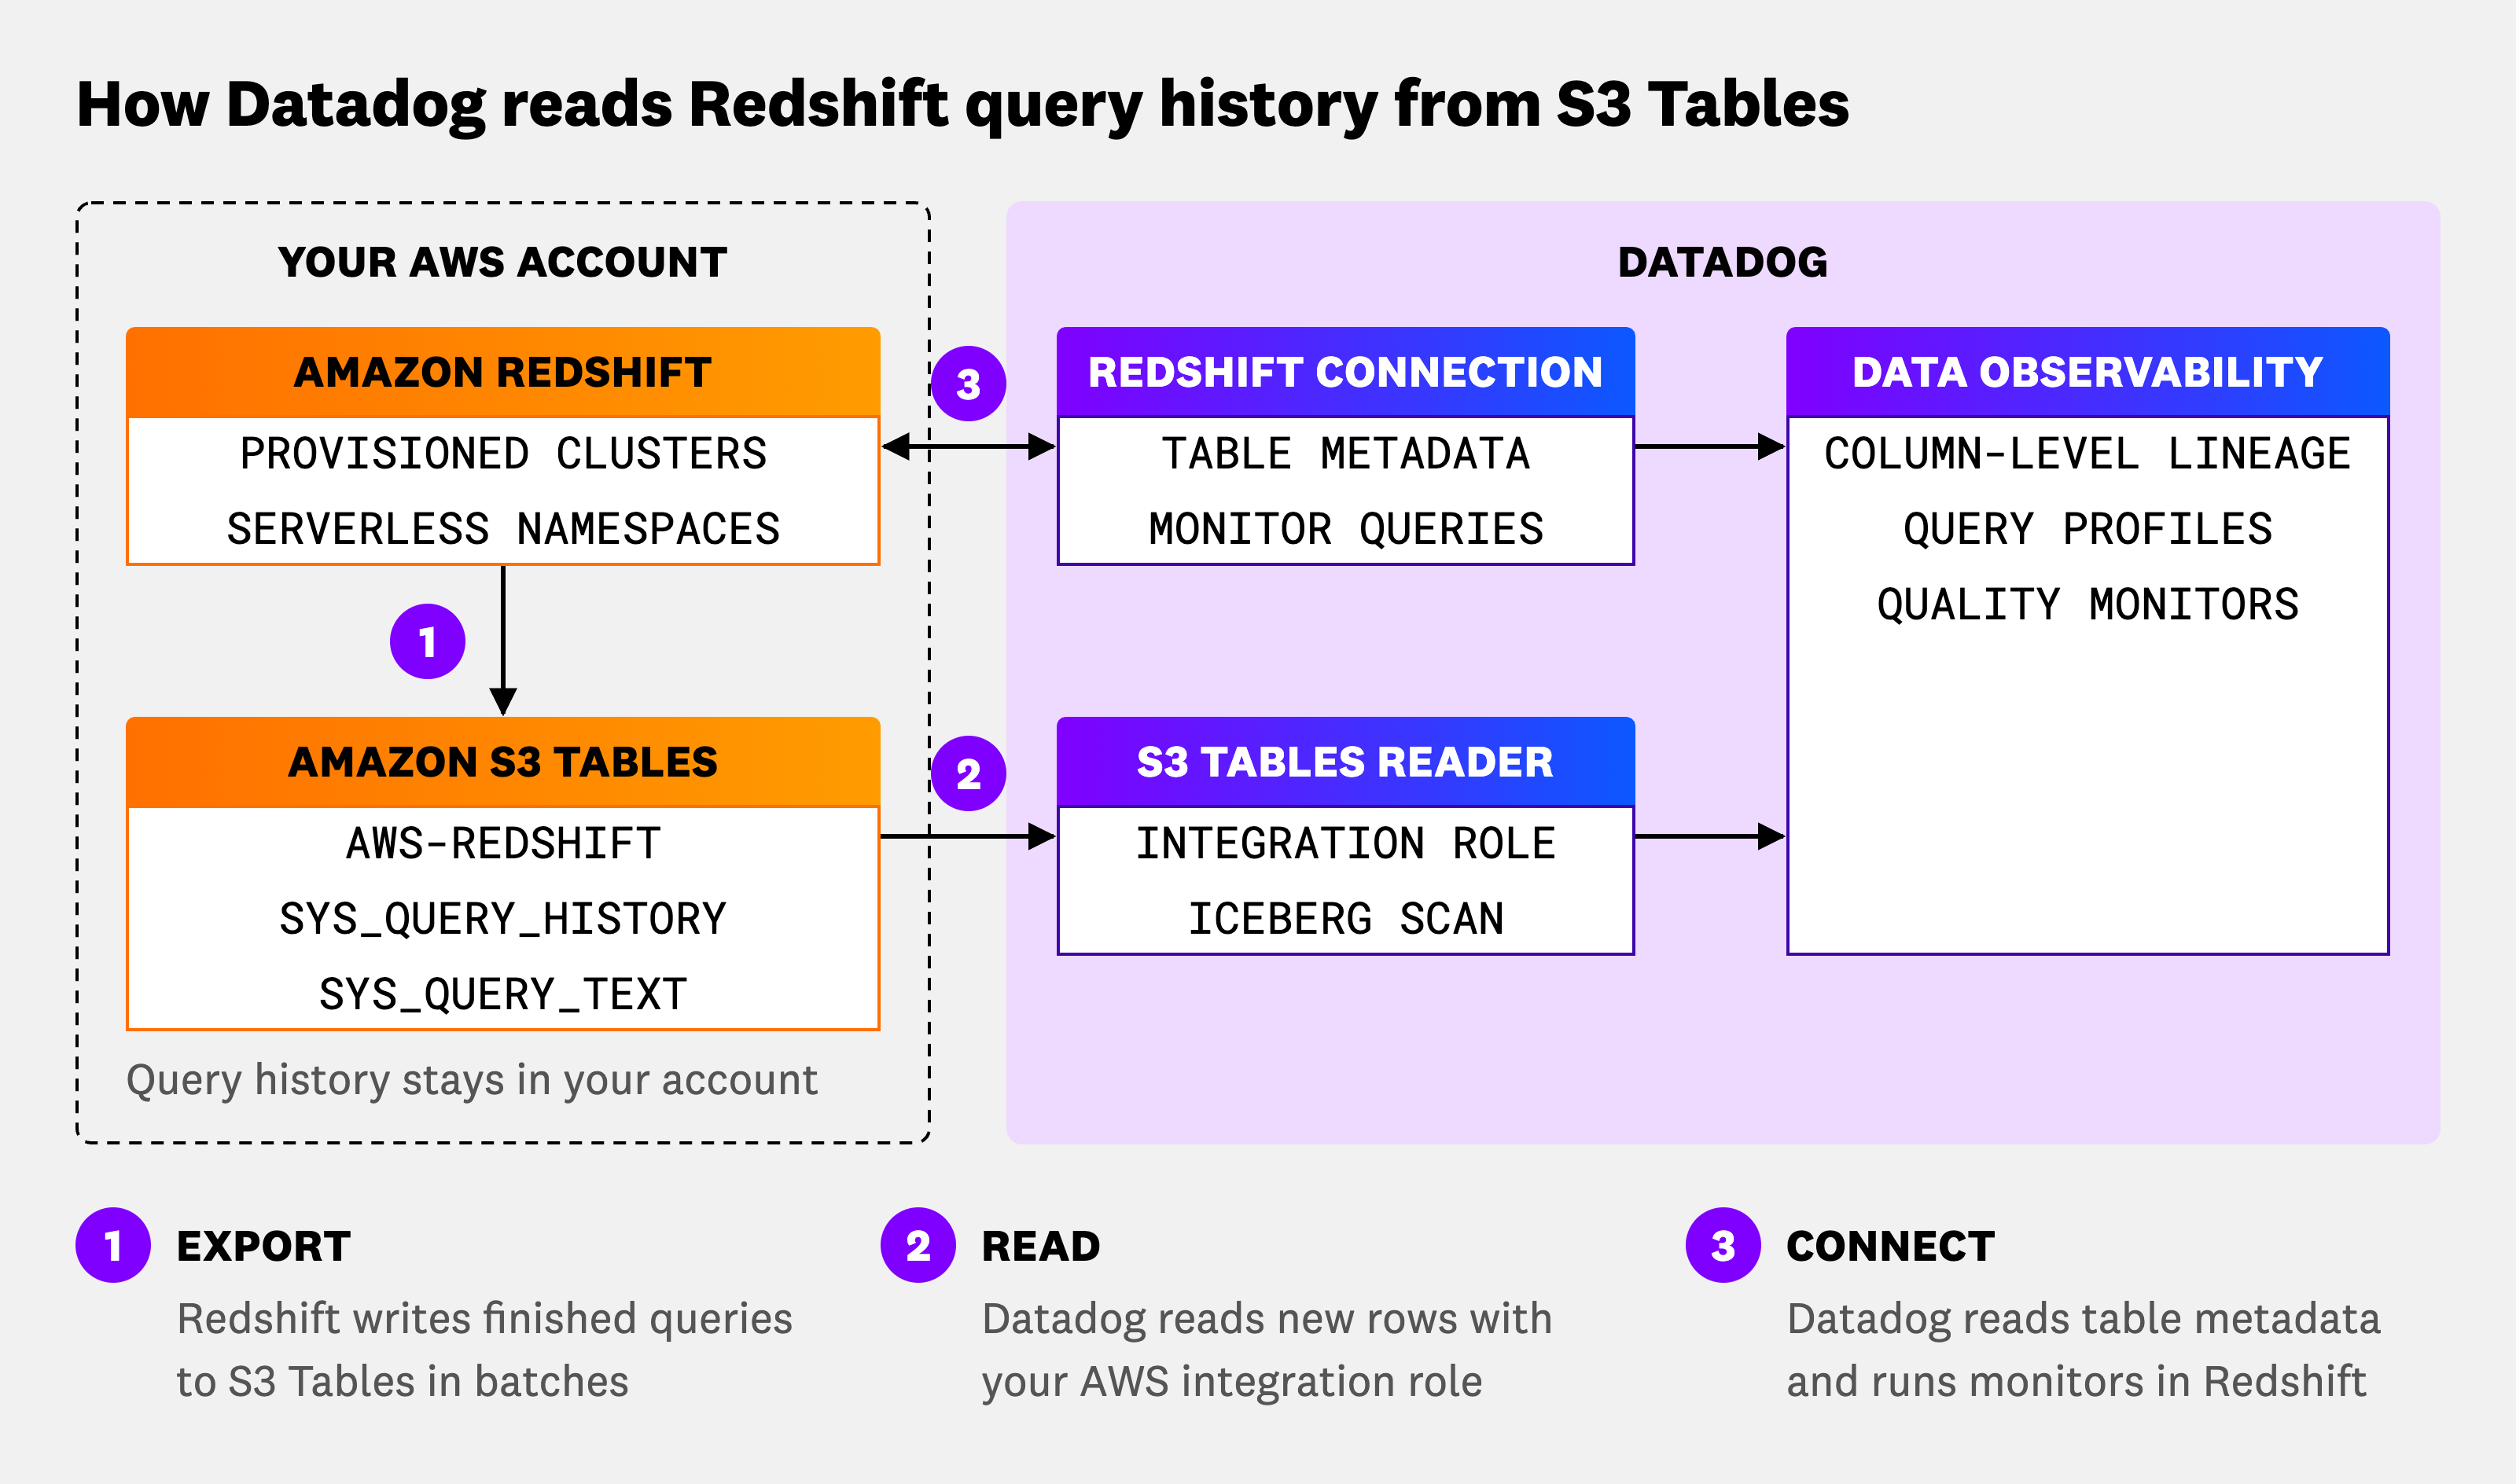
Figure 3: Solution architecture
The workflow consists of the following steps:
- Amazon Redshift periodically writes completed query records from
SYS_QUERY_HISTORYandSYS_QUERY_TEXTto the AWS managedaws-redshifttable bucket in Amazon S3 Tables. An isolated background process handles these writes, separate from your production workloads. - Datadog uses the AWS Identity and Access Management (IAM) role from your Datadog AWS integration to read new rows through the S3 Tables Iceberg REST endpoint. Because data is delivered in batches at a fixed frequency, Datadog tracks the last batch it read, so no batch is skipped or read twice.
- Datadog masks sensitive literals in the query text, parses each query into column-level lineage, and groups similar queries into normalized query profiles.
- Datadog still connects to Amazon Redshift for table metadata, such as schemas and row counts, and to run the data quality monitors that you configure.
Prerequisites
To implement this solution, you need the following:
- An AWS account with one or more Amazon Redshift provisioned clusters (RG or RA3 node types) or Amazon Redshift Serverless Workgroup.
- The system table integration with Amazon S3 Tables enabled for each warehouse you want to monitor. At minimum, enable
sys_query_historyandsys_query_text. Datadog reads per-warehouse exports, so set the granularity toclusterfor provisioned clusters orworkgroupfor Serverless namespaces. To enable the integration, see Enabling system table integration with Amazon S3 Tables. - The Amazon S3 Tables integration with the AWS Glue Data Catalog enabled in your account and Region. This is a one-time setup step. If you already integrated S3 Tables with the AWS Glue Data Catalog, no further action is needed. For instructions, see Integrating Amazon S3 Tables with AWS analytics services.
- An IAM principal with the following permissions:
redshift:EnableLogging(provisioned) orredshift-serverless:UpdateNamespace(Serverless).s3tables:CreateTableBucket,s3tables:PutTableBucketEncryption, ands3tables:PutTableBucketPolicy.
- The AWS Command Line Interface (AWS CLI) installed and configured.
- A Datadog account with the Datadog AWS integration configured and your warehouse connected to Datadog Data Observability for Amazon Redshift.
- Access to the Datadog Data Observability S3 Tables preview. To request access, contact your Datadog account team.
Note: Plan your encryption strategy before enabling the integration. If you encrypt the tables with a customer managed AWS Key Management Service (AWS KMS) key, you can’t change the key after the tables are created. If you plan to consolidate warehouses later, choose a shared AWS KMS key from the start.
Grant Datadog read access to the system tables
Datadog reads the system tables with the IAM role that your Datadog AWS integration uses. Complete the following steps:
- On the IAM console, in the navigation pane, choose Roles, then choose the role used by your Datadog AWS integration.
- Choose Add permissions, then choose Create inline policy.
- Choose the JSON tab and enter the following policy, replacing
<region>and<account-id>with your values:
- Enter a name for the policy, for example
DatadogRedshiftSystemTablesRead, and choose Create policy.
Note: If you encrypted the tables with a customer managed AWS KMS key, also grant the role kms:Decrypt permission on that key.
Use S3 Tables as the query history source in Datadog
During the preview, your Datadog account team enables S3 Tables as the query history source for your Datadog organization. Datadog then reads query history for each connected Amazon Redshift warehouse from S3 Tables instead of from the warehouse. Datadog tracks its position in the query history for each warehouse, so switching between sources doesn’t skip or duplicate queries.
Analyze query history in Datadog Data Observability
Query history feeds three parts of Datadog Data Observability:
- Lineage. Shows how data moves between tables, jobs, and dashboards.
- Query analysis. Shows who produces and consumes that data, and at what cost.
- Quality monitoring. Uses both to decide which tables to watch and to explain each alert.
Datadog builds all three from the same query history, so they work the same way whether the history comes from the warehouse or from S3 Tables.
The examples in this section use an Amazon Redshift table named analytics.fct_orders. A nightly job loads it from staging.stg_orders, and a Tableau dashboard reports revenue from it.
Note: The figures use a sample environment, so they show a database named prod and a table named int_orders_enriched instead of analytics.fct_orders.
Column-level lineage
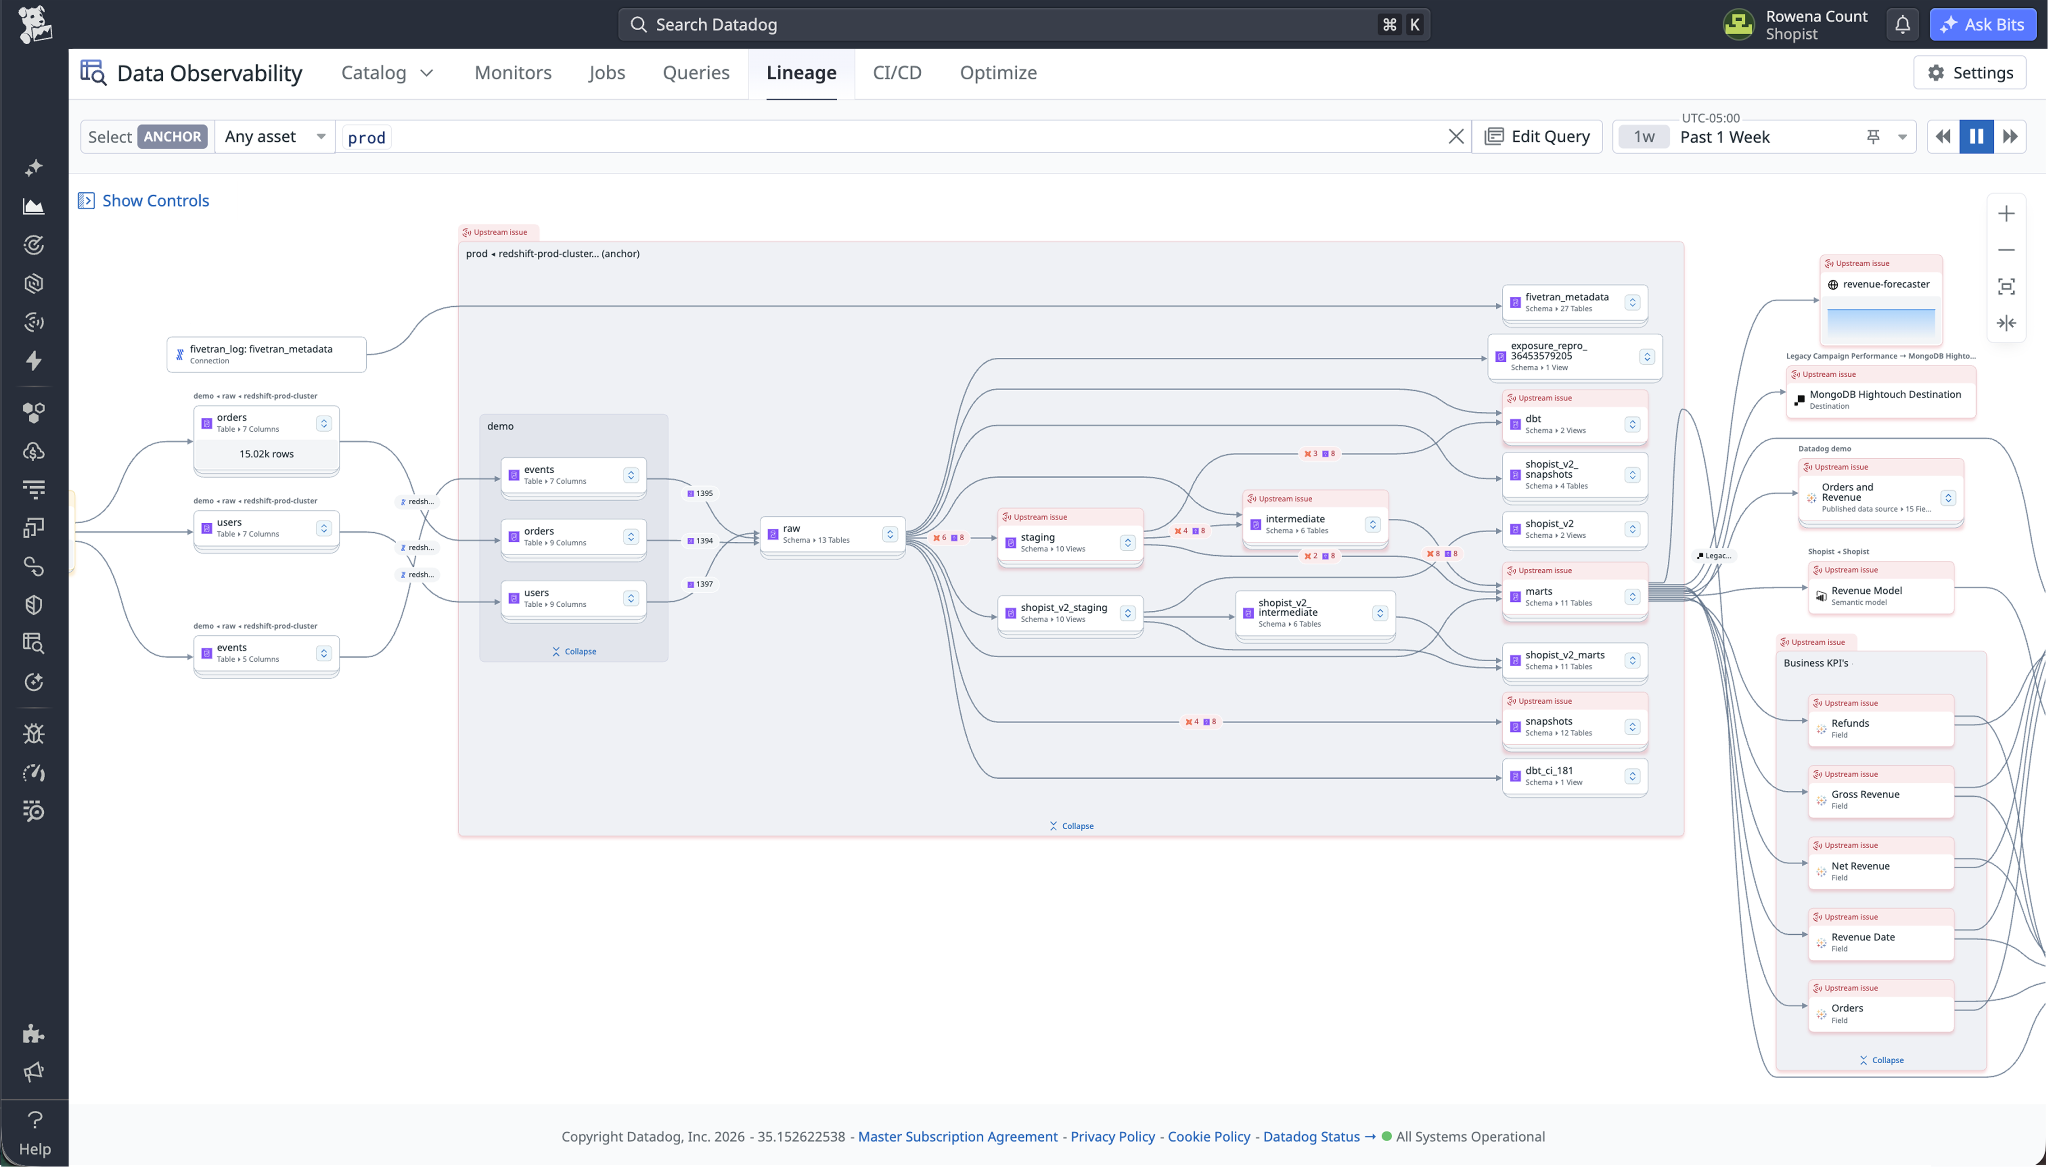
Figure 4: End-to-end lineage upstream of, through, and downstream of the prod database
Datadog parses each query in the history into column-level lineage. To explore it, complete the following steps:
- Choose Data Observability, then Lineage.
- Search for
prodto anchor the graph on the database. Figure 4 shows the result: source tables such asordersflow through theraw,staging, andintermediateschemas intomarts. To focus on a single table such asusers, search for that table instead. - Review upstream tables and jobs to the left, and downstream tables and dashboards to the right. An Upstream issue label marks assets affected by a problem further upstream.
- To see column-level lineage, expand a table to show its columns and how each one flows into downstream tables. To trace a single column from source to dashboard, change the asset type to Column and search for it.
In addition to Amazon Redshift, the lineage graph supports other sources. When you connect other integrations, upstream jobs from Apache Airflow or dbt and downstream dashboards from Tableau, Looker, or Power BI appear in the same graph. Datadog builds lineage from the query history in the time window you choose, so widen the window to include jobs that run weekly or monthly.
Two common lineage workflows are:
- Root cause analysis. Anchor on a broken table or dashboard, set the downstream depth to 0, and step upstream. Tables flagged by a quality monitor show their status on the graph, so you can see where a problem starts.
- Impact analysis. Before you change or drop a column, anchor on it, set the downstream depth to the maximum, and switch to the List view to see every table and dashboard that depends on it.
Query analysis
Query analysis turns your Amazon Redshift query history into trends, so you can catch queries that slow down or scan more data over weeks and months, not just the last 7 days. Figure 5 shows the result for the last question: an INSERT run by the etl_svc user.
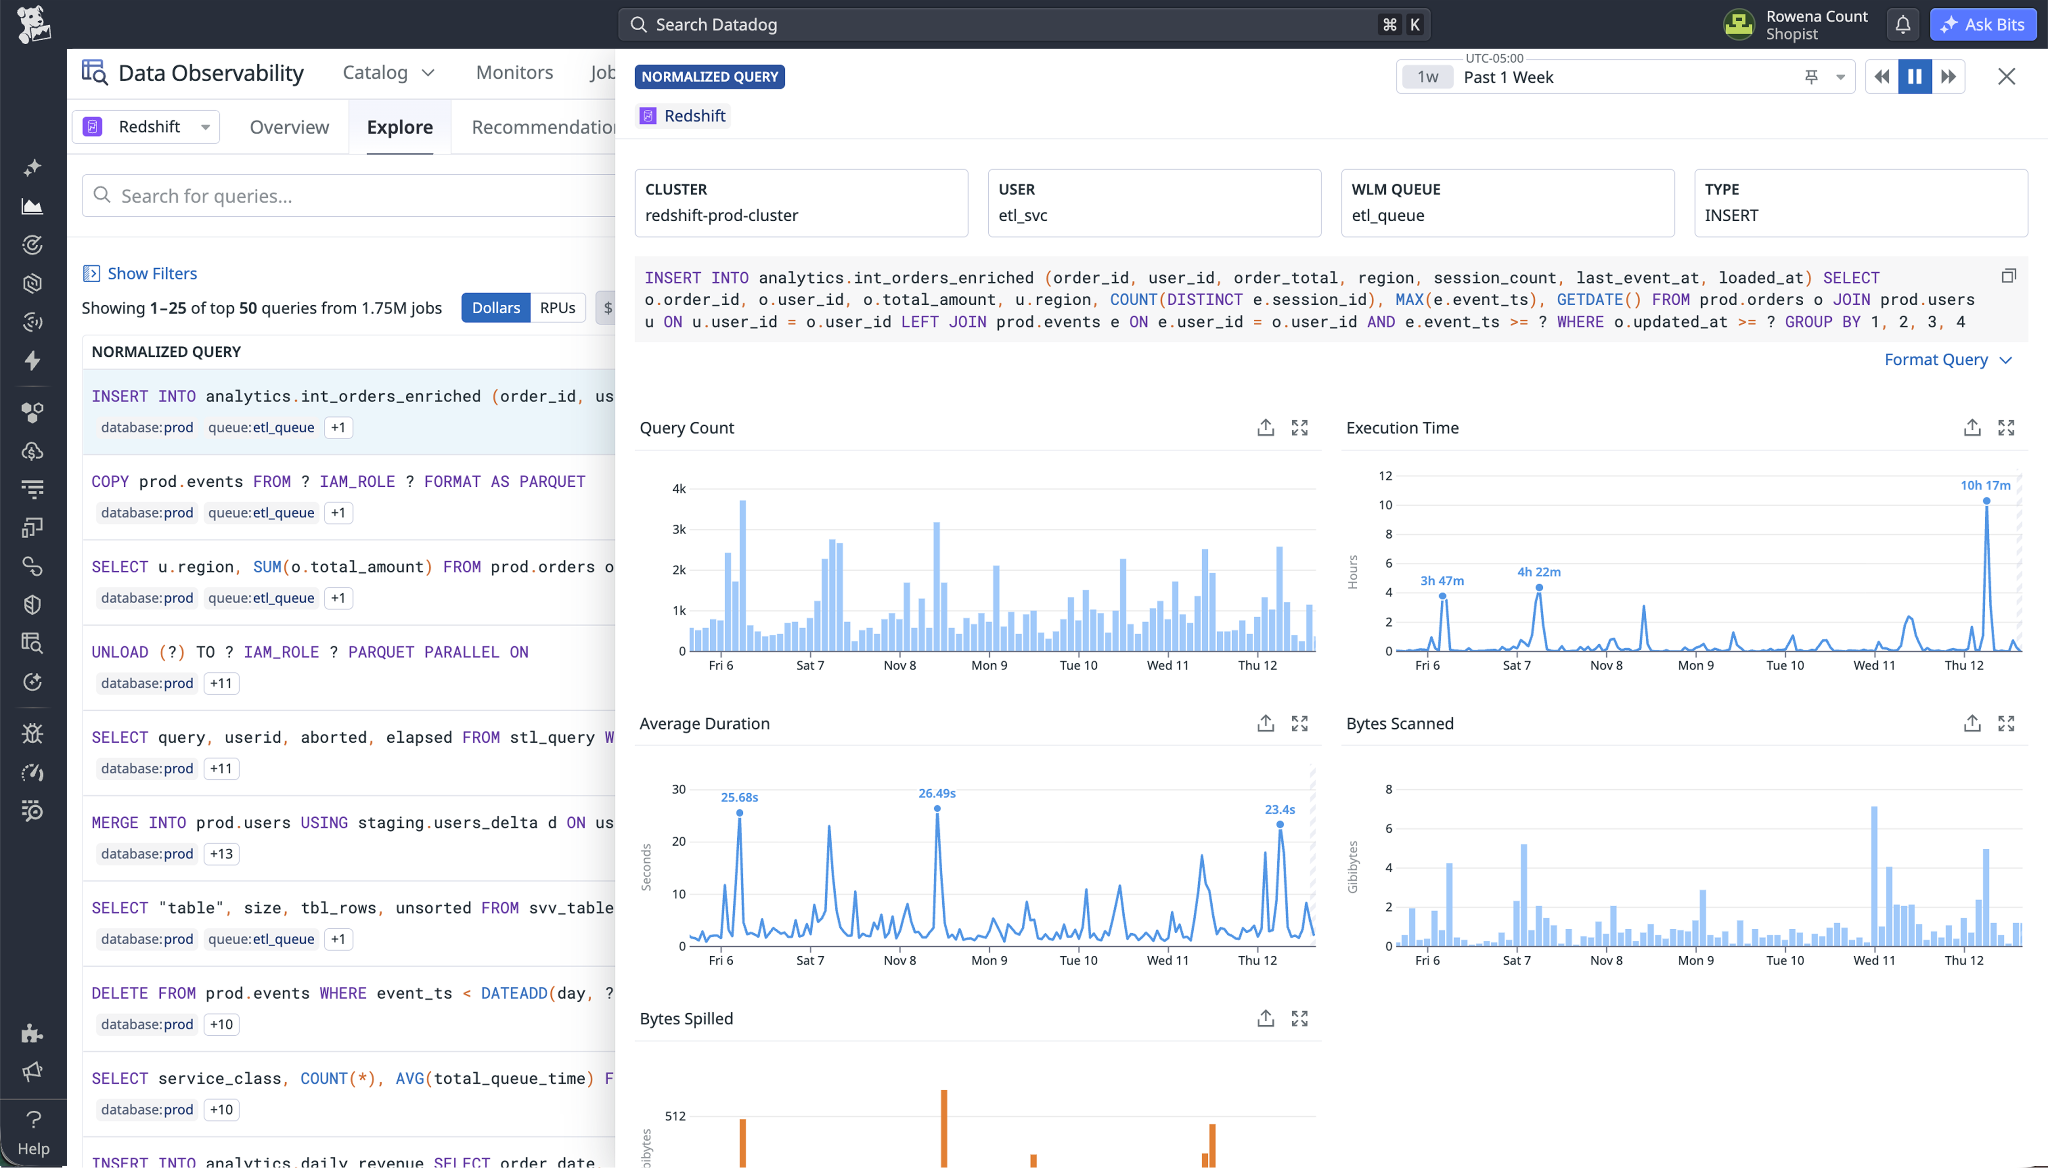
Figure 5: Query count, execution time, and data scanned for a normalized INSERT pattern
To explore query patterns:
- Choose Data Observability, then Queries, and choose Amazon Redshift.
- Review normalized query patterns. For each pattern, Datadog shows how often it runs, how long it takes, and how much data it scans.
- Group patterns by query, cluster, user, database, or statement type.
- Filter by the tables they read or write.
Because Datadog combines the query history from every connected cluster and workgroup, you can answer the following questions across your whole Amazon Redshift footprint:
- Which query patterns take the longest or read the most data?
- Which users or service accounts run the most expensive queries?
- Which queries write to
analytics.int_orders_enriched, and how has their runtime changed over time?
Quality monitoring
Quality monitors alert you when an Amazon Redshift table is not updated, changes unexpectedly in volume, or contains values that fall outside its normal range. Lineage then shows the upstream cause and the downstream impact.
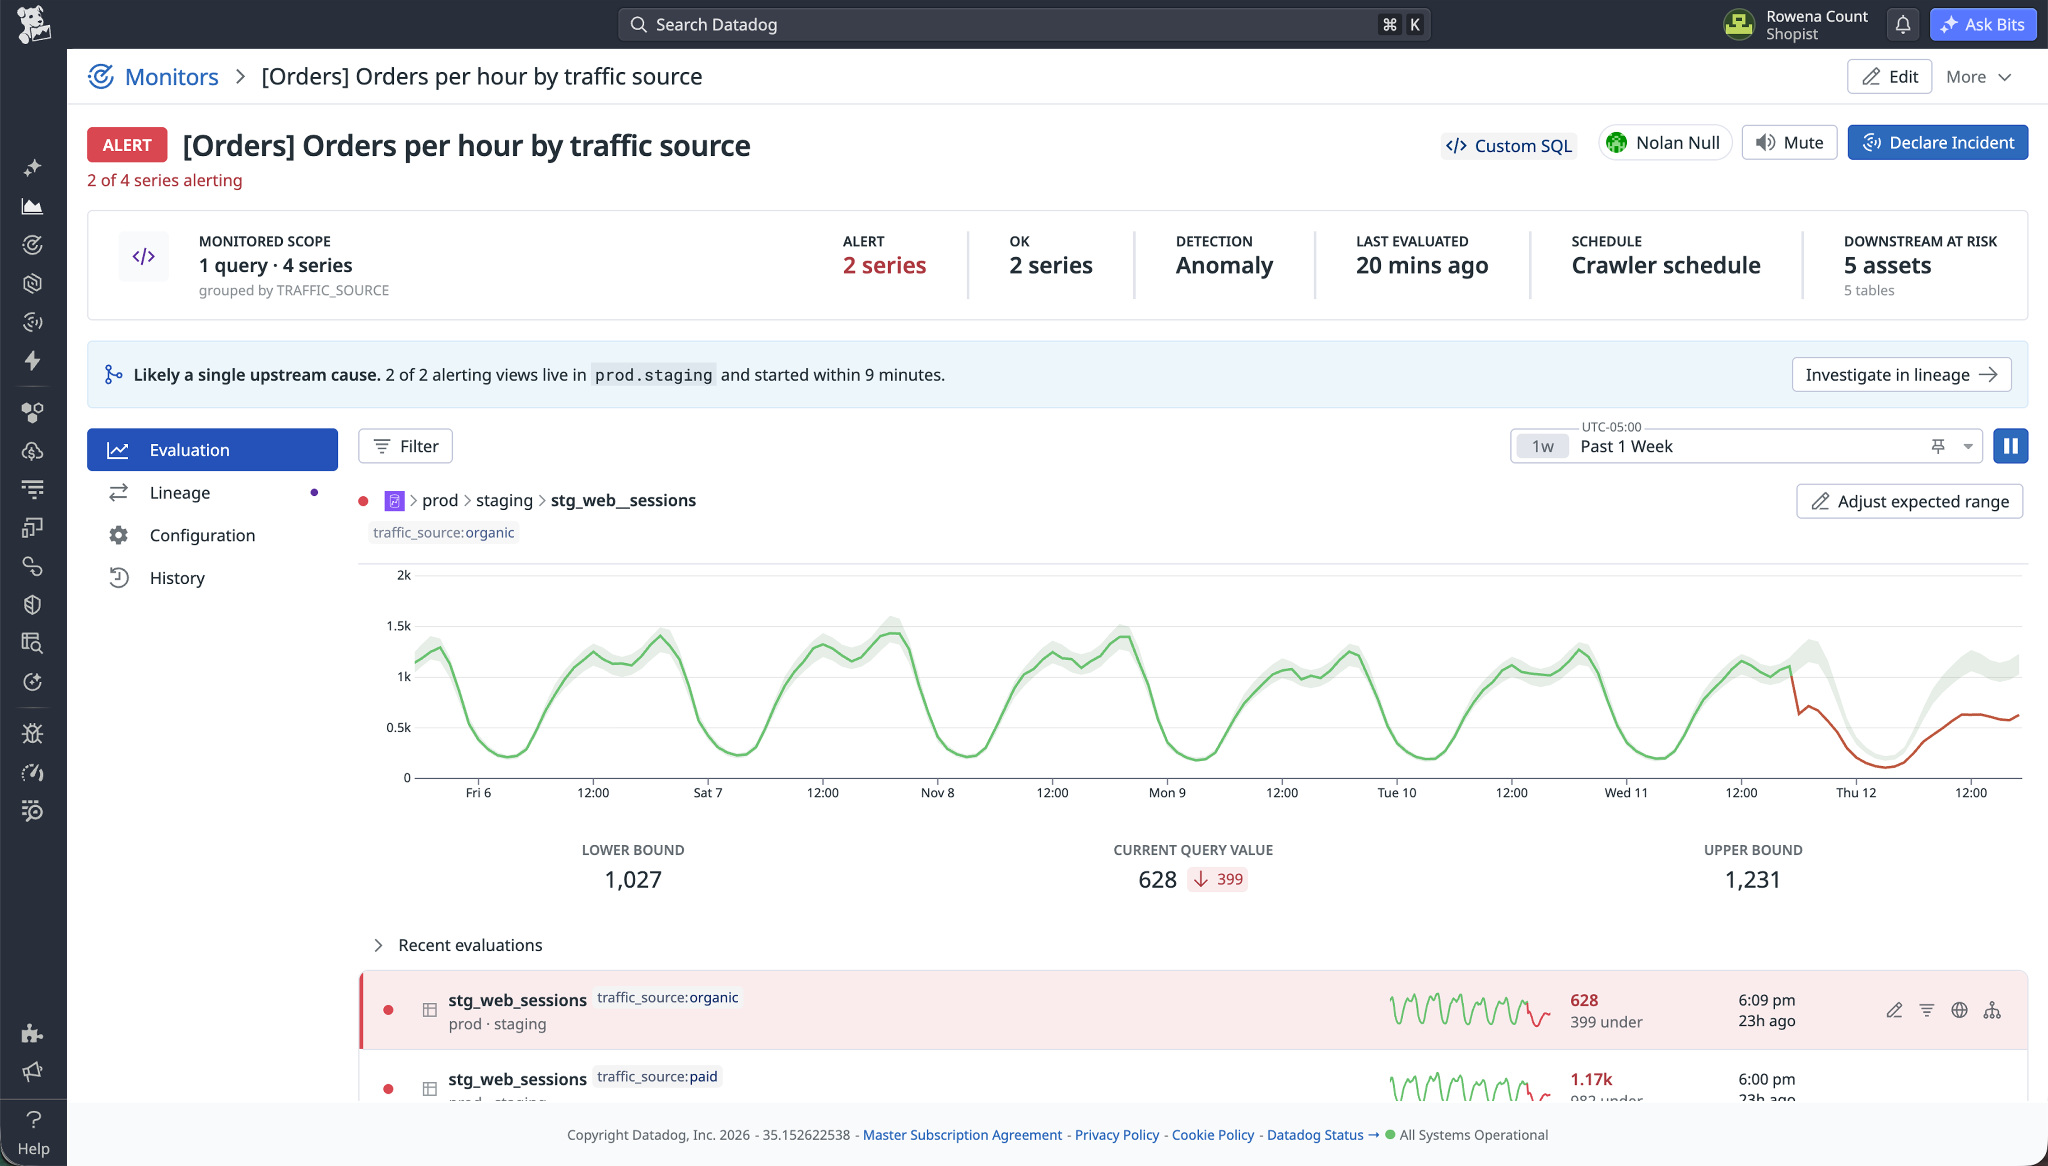
Figure 6: An anomaly monitor on orders per hour in Datadog
Data Observability monitors track the following metrics:
- Freshness
- Row count
- Column-level metrics such as nullness and uniqueness
- Custom SQL metrics
Each monitor can use anomaly detection, which learns a metric’s trends and seasonality so that you don’t need to set a threshold for every table. Figure 6 shows an anomaly monitor on orders per hour, grouped by traffic source. When the metric falls outside its expected range, Datadog flags the likely upstream cause and the downstream assets at risk. Schema change monitors (currently in preview) alert when an Amazon Redshift table or column is added, removed, or renamed, or when a column type changes.
Lineage also helps you decide what to monitor. For example, add a relation filter to monitor every table upstream of a specific dashboard.
Quality monitoring runs aggregate queries in Amazon Redshift, such as COUNT(*) and MAX(<timestamp_column>), and sends only the resulting values to Datadog, not rows from your tables. To protect sensitive columns, you can use Amazon Redshift dynamic data masking.
Example: Trace a stale dashboard to its cause
The following steps show how these features work together when the revenue dashboard stops updating:
- A freshness monitor on
analytics.fct_ordersalerts in Slack that the table hasn’t updated since its usual 02:00 load. - On the Lineage page, you anchor on
fct_orders. The monitor on the upstream tablestaging.stg_ordersis healthy, so the source data arrived and the problem is in the step that buildsfct_orders. The graph also shows that the Tableau revenue dashboard depends onfct_orders. - On the Queries page, you filter to queries that write to
analytics.fct_orders. The nightlyINSERTpattern run by theetl_svcuser shows failed runs starting at 02:00. - You fix the job and, before you rerun it, use impact analysis to list the downstream tables and dashboards whose owners you notify.
Clean up
To stop writing system table data to S3 Tables, for a provisioned cluster, run the following command:
For an Amazon Redshift Serverless namespace, run the following command:
Before you run the preceding commands, ask your Datadog account team to switch the query history source back to the warehouse. Datadog then resumes collecting query history from your warehouse where it left off, so lineage and query analysis continue without a gap.
Disabling the integration stops new deliveries but keeps the data that was already written. Amazon Redshift doesn’t deliver system table data to S3 Tables while the integration is disabled, so your long-term record in S3 Tables won’t include that period. Re-enabling the integration doesn’t backfill that period, and after 7 days, Amazon Redshift no longer retains those queries in the warehouse either. To stop incurring storage charges, delete the tables. Deleting the tables permanently removes the retained data, and Amazon Redshift doesn’t recreate them automatically.
Conclusion
In this post, we showed how to configure Datadog Data Observability to read Amazon Redshift query history from Amazon S3 Tables. With this integration, you can:
- Retain query history beyond the 7-day in-cluster limit for auditing and compliance.
- Collect query history without adding load to your warehouses.
- Analyze lineage and query activity across all your clusters and workgroups in one place.
AWS and Datadog built this integration together so you can use Amazon Redshift system table data in your existing observability workflows.
If you’re new to Datadog, you can sign up for a free trial. If you have questions or suggestions, leave them in the comments.
Additional resources
- Amazon Redshift documentation: System table integration with Amazon S3 Tables
- Datadog documentation: Data Observability Overview
- Related post: Long-term system tables retention in Amazon Redshift with Amazon S3 Tables