AWS Big Data Blog
Run usage analytics on Amazon QuickSight using AWS CloudTrail
Amazon QuickSight is a cloud-native BI service that allows end users to create and publish dashboards in minutes, without provisioning any servers or requiring complex licensing. You can view these dashboards on the QuickSight product console or embed them into applications and websites. After you deploy a dashboard, it’s important to assess how they and other assets are being adopted, accessed, and used across various departments or customers.
In this post, we use a QuickSight dashboard to present the following insights:
- Most viewed and accessed dashboards
- Most updated dashboards and analyses
- Most popular datasets
- Active users vs. idle users
- Idle authors
- Unused datasets (wasted SPICE capacity)
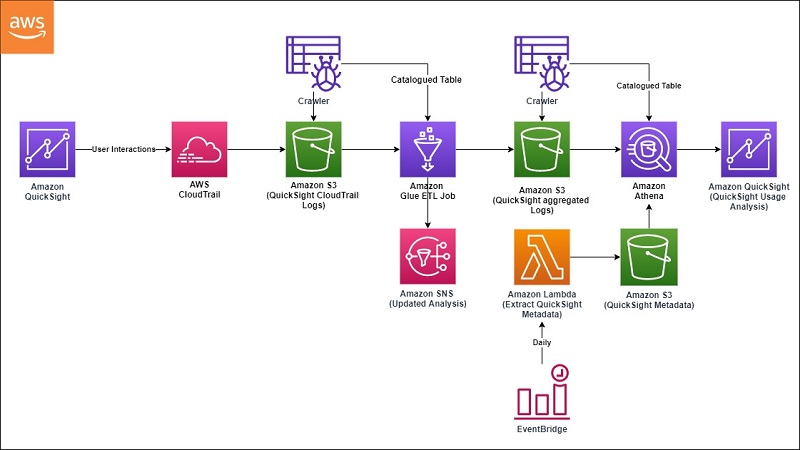
You can use these insights to reduce costs and create operational efficiencies in a deployment. The following diagram illustrates this architecture.
Solution components
The following table summarizes the AWS services and resources that this solution uses.
| Resource Type | Name | Purpose |
| AWS CloudTrail logs | CloudTrailMultiAccount | Capture all API calls for all AWS services across all AWS Regions for this account. You can use AWS Organizations to consolidate trails across multiple AWS accounts. |
| AWS Glue crawler |
QSCloudTrailLogsCrawler QSProcessedDataCrawler |
Ensures that all CloudTrail data is crawled periodically and that partitions are updated in the AWS Glue Data Catalog. |
| AWS Glue ETL job | QuickSightCloudTrailProcessing | Reads catalogued data from the crawler, processes, transforms, and stores it in an S3 output bucket. |
| AWS Lambda function | ExtractQSMetadata_func | Extracts event data using the AWS SDK for Python, Boto3. The event data is enriched with QuickSight metadata objects like user, analysis, datasets, and dashboards. |
| Amazon Simple Storage Service (s3) |
CloudTrailLogsBucket QuickSight-BIonBI-processed |
One bucket stores CloudTrail data. The other stores processed data. |
| Amazon QuickSight | Quicksight_BI_On_BO_Analysis | Visualizes the processed data. |
Solution walkthrough
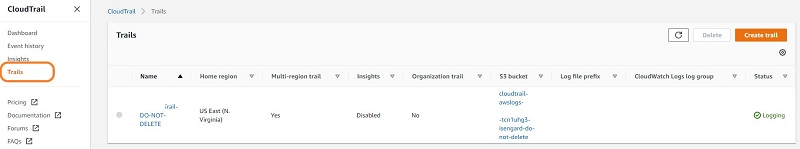
AWS CloudTrail is a service that enables governance, compliance, operational auditing, and risk auditing of your AWS account. You can use CloudTrail to log, continuously monitor, and retain account activity related to actions across your AWS infrastructure. You can define a trail to collect API actions across all AWS Regions. Although we have enabled a trail for all Regions in our solution, the dashboard shows the data for single Region only.
After you enable CloudTrail, it starts capturing all API actions and then, at 15-minute intervals, delivers logs in JSON format to a configured Amazon Simple Storage Service (Amazon S3) bucket. Before the logs are made available to our ad hoc query engine, Amazon Athena, they must be parsed, transformed, and processed by the AWS Glue crawler and ETL job.
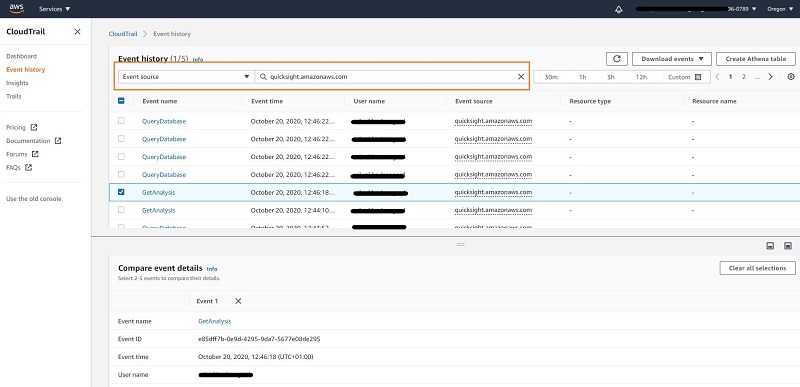
This will be handled by AWS Glue Crawler & AWS Glue ETL Job. The AWS Glue crawler crawls through the data every day and populates new partitions in the Data Catalog. The data is later made available as a table on the Athena console for processing by the AWS Glue ETL job. Glue ETL Job QuickSightCloudtrail_GlueJob.txt filters logs and processes only those events where the event source is QuickSight. (for example, eventSource = quicksight.amazonaws.com’).
The following screenshot shows the sample JSON for the QuickSight API calls.
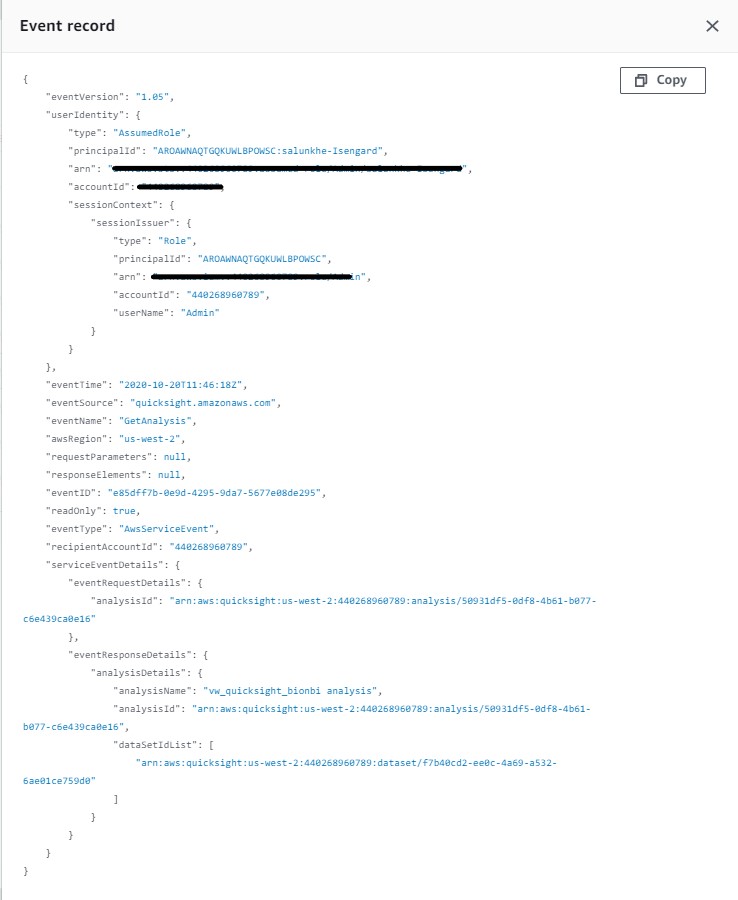
The job processes those events and creates a Parquet file. The following table summarizes the file’s data points.
| Quicksightlogs | |
| Field Name | Data Type |
eventtime |
Datetime |
eventname |
String |
awsregion |
String |
accountid |
String |
username |
String |
analysisname |
String |
Date |
Date |
The processed data is stored in an S3 folder at s3://<BucketName>/processedlogs/. For performance optimization during querying and connecting this data to QuickSight for visualization, these logs are partitioned by date field. For this reason, we recommend that you configure the AWS Glue crawler to detect the new data and partitions and update the Data Catalog for subsequent analysis. We have configured the crawler to run one time a day.
We need to enrich this log data with metadata from QuickSight, such as a list of analyses, users, and datasets. This metadata can be extracted using descibe_analysis, describe_user, describe_data_set in the AWS SDK for Python.
We provide an AWS Lambda function that is ideal for this extraction. We configured it to be triggered once a day through Amazon EventBridge. The extracted metadata is stored in the S3 folder at s3://<BucketName>/metadata/.
Now that we have processed logs and metadata for enrichment, we need to prepare the data visualization in QuickSight. Athena allows us to build views that can be imported into QuickSight as datasets.
We build the following views based on the tables populated by the Lambda function and the ETL job:
 QuickSight visualization
Follow these steps to connect the prepared data with QuickSight and start building the BI visualization.
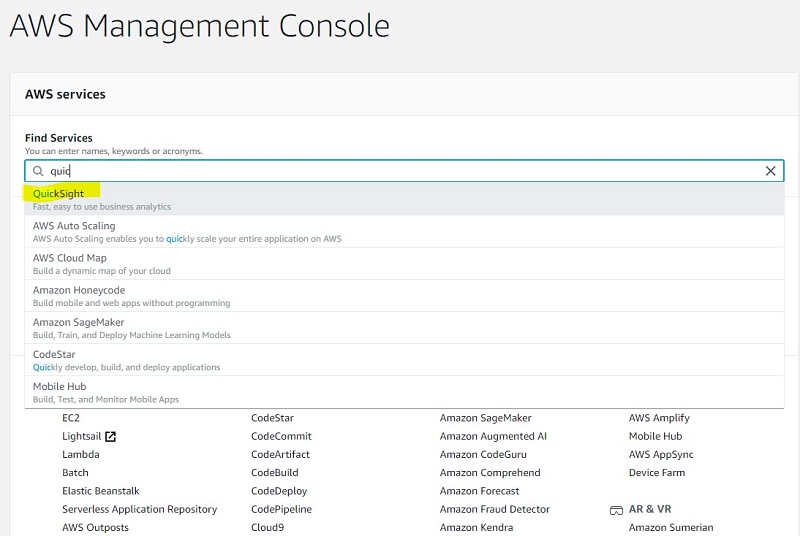
- Sign in to the AWS Management Console and open the QuickSight console.
You can set up QuickSight access for end users through SSO providers such as AWS Single Sign-On (AWS SSO), Okta, Ping, and Azure AD so they don’t need to open the console.
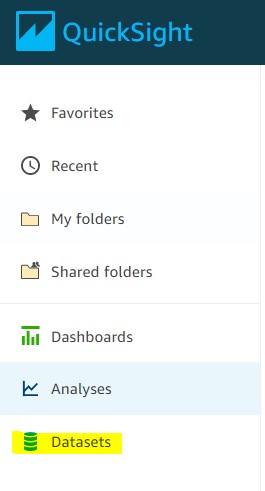
- On the QuickSight console, choose Datasets.
- Choose New dataset to create a dataset for our analysis.
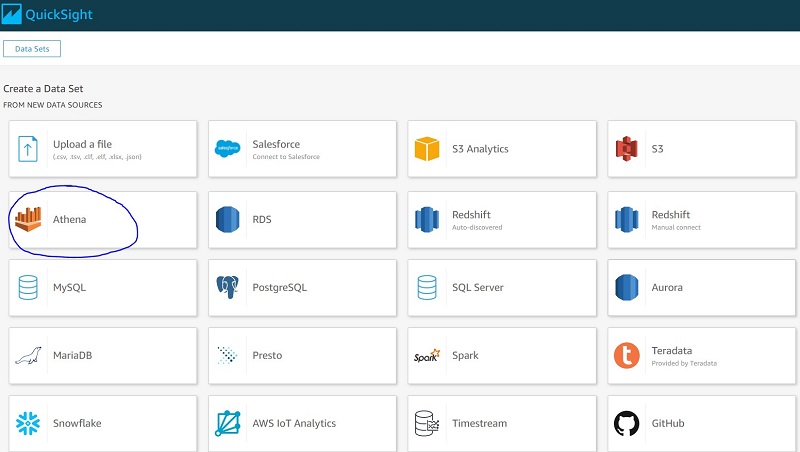
- For Create a Data Set, choose Athena.
In the previous steps, we prepared all our data in the form of Athena views.
- Configure permission for QuickSight to access AWS services, including Athena and its S3 buckets. For information, see Accessing Data Sources.
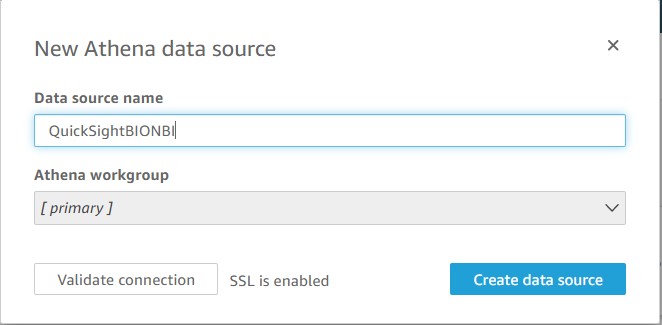
- For Data source name, enter
QuickSightBIbBI. - Choose Create data source.
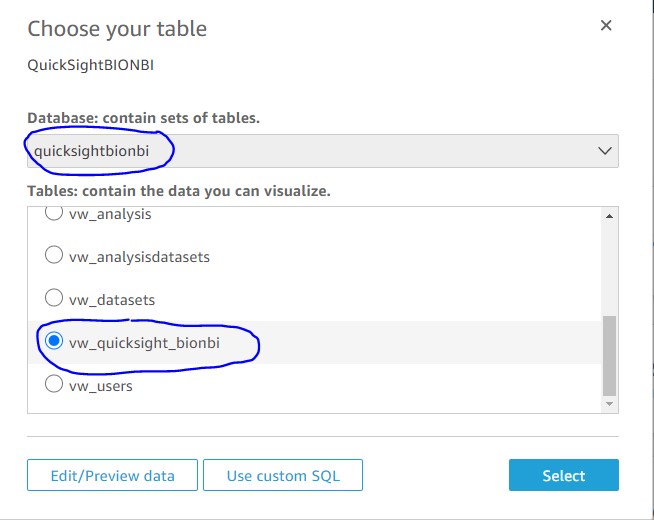
- On Choose your table, for Database, choose quicksightbionbi.
- For Tables, select vw_quicksight_bionbi.
- Choose Select.
- For Finish data set creation, there are two options to choose from:
- Import to SPICE for quicker analytics – Built from the ground up for the cloud, SPICE uses a combination of columnar storage, in-memory technologies enabled through the latest hardware innovations, and machine code generation to run interactive queries on large datasets and get rapid responses. We use this option for this post.
- Directly query your data – You can connect to the data source in real time, but if the data query is expected to bring bulky results, this option might slow down the dashboard refresh.
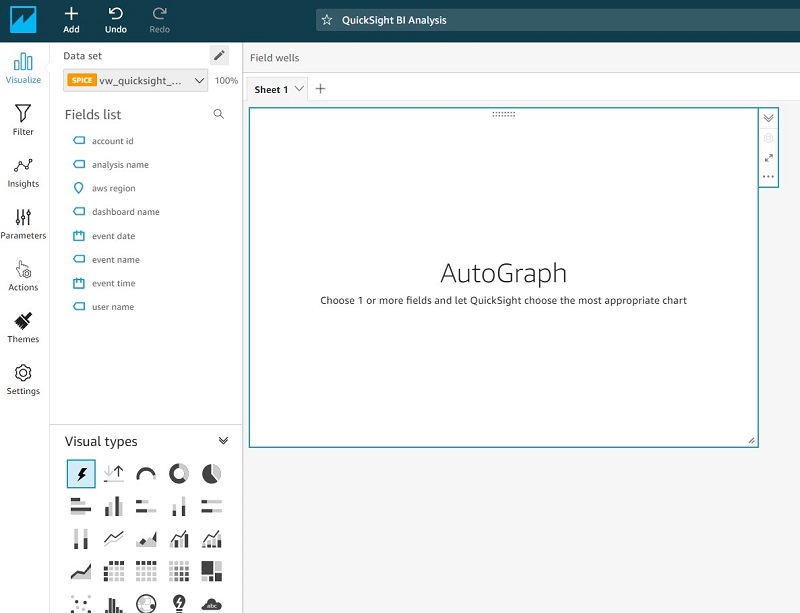
- Choose Visualize to complete the data source creation process.

Now you can build your visualizations sheets. QuickSight refreshes the data source first. You can also schedule a periodic refresh of your data source.
The following screenshot shows some examples of visualizations we built from the data source.

This dashboard presents us with two main areas for cost optimization:
- Usage analysis – We can see how analyses and dashboards are being consumed by users. This area highlights the opportunity for cost saving by looking at datasets that have not been used for the last 90 days in any of the analysis but are still holding a major chunk of SPICE capacity.
- Account governance – Because author subscriptions are charged on a fixed fee basis, it’s important to monitor if they are actively used. The dashboard helps us identify idle authors for the last 60 days.
Based on the information in the dashboard, we could do the following to save costs:
- Use the idle authors data to delete these user accounts. For information, see Managing User Access Inside Amazon QuickSight
- Use the SPICE capacity data to manage SPICE capacity by deleting unused datasets or purchasing additional capacity
Conclusion
In this post, we showed how you can use CloudTrail logs to review the use of QuickSight objects, including analysis, dashboards, datasets, and users. You can use the information available in dashboards to save money on storage, subscriptions, understand maturity of QuickSight Tool adoption and more.
About the Author
 Sunil Salunkhe is a Senior Solution Architect working with Strategic Accounts on their vision to leverage the cloud to drive aggressive growth strategies. He practices customer obsession by solving their complex challenges in all the aspects of the cloud journey including scale, security and reliability. While not working, he enjoys playing cricket and go cycling with his wife and a son.