AWS Big Data Blog
Category: Management Tools
Set up production-ready monitoring for Amazon MSK using CloudWatch alarms
In this post, I show you how to implement effective monitoring for your Kafka clusters using Amazon MSK and Amazon CloudWatch. You’ll learn how to track critical metrics like broker health, resource utilization, and consumer lag, and set up automated alerts to prevent operational issues.
Best practices for right-sizing Amazon OpenSearch Service domains
In this post, we guide you through the steps to determine if your OpenSearch Service domain is right-sized, using AWS tools and best practices to optimize your configuration for workloads like log analytics, search, vector search, or synthetic data testing.
Amazon OpenSearch Ingestion 101: Set CloudWatch alarms for key metrics
This post provides an in-depth look at setting up Amazon CloudWatch alarms for OpenSearch Ingestion pipelines. It goes beyond our recommended alarms to help identify bottlenecks in the pipeline, whether that’s in the sink, the OpenSearch clusters data is being sent to, the processors, or the pipeline not pulling or accepting enough from the source. This post will help you proactively monitor and troubleshoot your OpenSearch Ingestion pipelines.
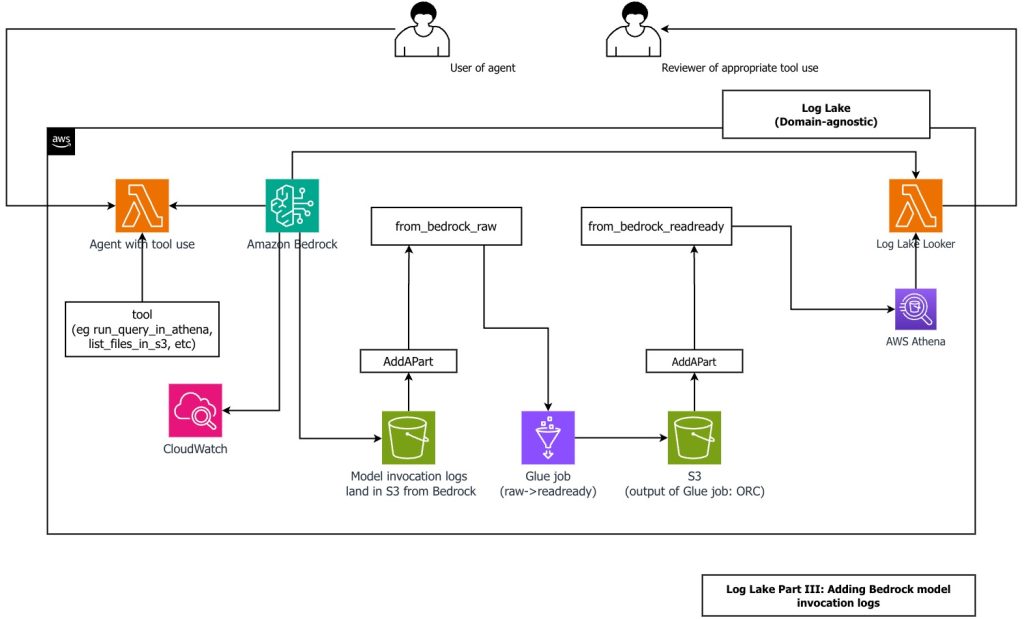
Create a customizable cross-company log lake, Part II: Build and add Amazon Bedrock
In this post, you learn how to build Log Lake, a customizable cross-company data lake for compliance-related use cases that combines AWS CloudTrail and Amazon CloudWatch logs. You’ll discover how to set up separate tables for writing and reading, implement event-driven partition management using AWS Lambda, and transform raw JSON files into read-optimized Apache ORC format using AWS Glue jobs. Additionally, you’ll see how to extend Log Lake by adding Amazon Bedrock model invocation logs to enable human review of agent actions with elevated permissions, and how to use an AI agent to query your log data without writing SQL.
Amazon OpenSearch Serverless monitoring: A CloudWatch setup guide
In this post, we explore commonly used Amazon CloudWatch metrics and alarms for OpenSearch Serverless, walking through the process of selecting relevant metrics, setting appropriate thresholds, and configuring alerts. This guide will provide you with a comprehensive monitoring strategy that complements the serverless nature of your OpenSearch deployment while maintaining full operational visibility.
Automate and orchestrate Amazon EMR jobs using AWS Step Functions and Amazon EventBridge
In this post, we discuss how to build a fully automated, scheduled Spark processing pipeline using Amazon EMR on EC2, orchestrated with Step Functions and triggered by EventBridge. We walk through how to deploy this solution using AWS CloudFormation, processes COVID-19 public dataset data in Amazon Simple Storage Service (Amazon S3), and store the aggregated results in Amazon S3.
Migrating from API keys to service account tokens in Grafana dashboards using Terraform
In this blog post, we walk through how to migrate from API keys to service account tokens when automating Amazon Managed Grafana resource management. We will also show how to securely store tokens using AWS Secrets Manager and automate token rotation with AWS Lambda.
Enhance Amazon EMR observability with automated incident mitigation using Amazon Bedrock and Amazon Managed Grafana
In this post, we demonstrate how to integrate real-time monitoring with AI-powered remediation suggestions, combining Amazon Managed Grafana for visualization, Amazon Bedrock for intelligent response recommendations, and AWS Systems Manager for automated remediation actions on Amazon Web Services (AWS).

Process millions of observability events with Apache Flink and write directly to Prometheus
In this post, we explain how the new connector works. We also show how you can manage your Prometheus metrics data cardinality by preprocessing raw data with Flink to build real-time observability with Amazon Managed Service for Prometheus and Amazon Managed Grafana.

Correlate telemetry data with Amazon OpenSearch Service and Amazon Managed Grafana
In this post, we show you how to use Amazon OpenSearch Service and Amazon Managed Grafana to correlate the various observability signals that improve root cause analysis, thereby resulting in reduced Mean Time to Resolution (MTTR). We also provide a reference solution that can be used at scale for proactive monitoring of enterprise applications to avoid a problem before they occur.