AWS Business Intelligence Blog
How Huron built an Amazon QuickSight Asset Catalogue with AWS CDK Based Deployment Pipeline
| All your trusted BI capabilities of Amazon QuickSight now come with powerful new AI features that integrate chat agents, deep research, and automation in one seamless experience with Amazon Quick Suite! Learn more » |
This is a guest blog post co-written with Corey Johnson from Huron.
In this post, we walk you through a solution that Huron Consulting Group implemented to keep track of and manage the lifecycle for all Amazon QuickSight resources across the organization by collaborating with AWS Data Lab Resident Architects and the AWS Professional Services team.
Having an accurate and up-to-date inventory of all technical assets helps an organization ensure it can keep track of all its resources with metadata information such as their assigned owners, last updated date, used by whom, how frequently, and more. It helps engineers, analysts, and businesses access the most up-to-date release of the software asset, which brings accuracy to the decision-making process. By keeping track of this information, organizations are able to identify technology gaps, refresh cycles, and expire assets as needed for archival.
In addition, an inventory of all assets is one of the foundational elements of an organization that facilitates the security and compliance team to audit the assets for improving privacy and security posture, and mitigate risk to ensure that business operations run smoothly. Organizations may have different ways of maintaining an asset inventory, such as an Excel spreadsheet or a database with a fully automated system to keep it up to date, but with the common objective of keeping it accurate. Even if organizations follow manual approaches to update their inventory records, it’s recommended to build automation so that it’s accurate at any point of time.
The DevOps practices that revolutionized software engineering in the last decade have yet to come to the world of business intelligence (BI) solutions. BI tools by their nature use a paradigm of UI-driven development, with code-first practices being secondary or nonexistent. As the need for applications that can use an organization’s internal and client data increases, the same DevOps practices (BIOps) can drive and deliver quality insights more reliably.
About Huron Consulting Group
Huron Consulting Group is a global professional services firm that collaborates with clients to put the possible into practice by creating sound strategies, optimizing operations, accelerating digital transformation, and empowering businesses and their people to own their future. By embracing diverse perspectives, encouraging new ideas, and challenging the status quo, Huron Consulting Group creates sustainable results for the organizations we serve.
Use case overview
Huron’s BI use case represents visualizations as a service, in which Huron has a core set of visualizations and dashboards available as products for its customers. The products exist in different industry verticals (healthcare, education, commercial) with independent development teams. Huron’s consultants use the products to provide insights as part of consulting engagements. The insights from the product help Huron’s consultants accelerate their customer’s transformation. As part of its overall suite of offerings, product dashboards are featured in a software application following a standardized development lifecycle. In addition, these product dashboards may be forked for customer-specific customization to support a consulting engagement while still consuming from Huron’s productized data assets and datasets. In the next stage of the cycle, Huron’s consultants experiment with new data sources and insights that are fed back into the product dashboards.
When a customer subscribes to a product, Huron needs to create a customer-specific visualization from the existing reference analysis and then link them to the customer-specific datasets or multi-tenant datasets depending on the product, so that the final visualization and dashboard shows insights on customer data. Challenges arise when changes need to be made for a product analysis because of a new feature release or a bug fix, and all the customer visualizations that are created from it also need to be updated. To maintain the integrity of embedded visualizations, all metadata and lineage must be available to the parent application. This access to the metadata supports the need for updating visuals based on changes as well as automating row- and column-level security, ensuring customer data is properly governed.
In addition, a few customers request customizations on top of the base visualizations, for which the Huron team needs to create a replica of the base reference and then customize it for the customer. These are maintained by Huron’s field consultants rather than the product development team. These customer-specific visualizations create operational overhead because they require Huron to keep track of new customer-specific visualizations and maintain them for future releases when the product visuals change.
Huron uses Amazon QuickSight for their Business Intelligence (BI) reporting needs, enabling them to embed visualizations at scale with higher efficiency and lower cost. A large attraction for Huron to adopt QuickSight came from the forward-looking API capabilities that enable and set the foundation for a BIOps culture and technical infrastructure. To address the above requirement, Huron Global Product team decided to build a QuickSight Asset Tracker and QuickSight Asset Deployment Pipeline.
The QuickSight Asset Tracker serves as a catalogue of all QuickSight resources (datasets, analysis, templates, dashboards etc.) with its interdependent relationship. It will help;
- Create an inventory of all QuickSight resources across all business units
- Enable dynamic embedding of visualizations and dashboards based on logged in user
- Enable dynamic row and column level security on the dashboards and visualizations based on the logged-in user
- Meet compliance and audit requirements of the organization
- Maintain the current state of all customer specific QuickSight resources
The solution integrates an AWS CDK based pipeline to deploy QuickSight Assets that:
- Supports Infrastructure-as-a-code for QuickSight Asset Deployment and enables rollbacks if required.
- Enables separation of development, staging and production environments using QuickSight folders that reduces the burden of multi-account management of QuickSight resources.
- Enables a hub-and-spoke model for Data Access in multiple AWS accounts in a data mesh fashion.
Solution overview
The QuickSight Asset Tracker was built as an independent service, which was deployed in a shared AWS service account that integrated Amazon Aurora Serverless with PostgreSQL compatibility to store metadata information, AWS Lambda as the serverless compute, and Amazon API Gateway to provide the REST API layer.
It also integrated the AWS CDK and AWS CloudFormation to deploy the product- and customer-specific QuickSight resources and keep them in a consistent and stable state. The metadata of QuickSight resources, created using either the AWS Management Console or the AWS CDK-based deployment, were maintained in an Aurora database through the QuickSight Asset Tracker REST API service.
The AWS CDK-based deployment pipeline is triggered via a continuous integration (CI) and continuous deployment (CD) pipeline that performs the following functions:
- Takes the ARN of the QuickSight assets (dataset, analysis, etc.)
- Describes the asset and dependent resources (if selected)
- Creates a copy of the resource in another environment (in this case a QuickSight folder) using the AWS CDK
The solution architecture integrated the following AWS services.
- Amazon Aurora Serverless as the backend database to store metadata information of all QuickSight resources with customer and product information they are related to.
- Amazon QuickSight as the BI service, with which visualization and dashboards can be created and embedded into the online applications.
- AWS Lambda as the serverless compute service that gets invoked by online applications using Amazon API Gateway.
- Amazon Simple Queue Service (Amazon SQS) to store customer request messages, so that the AWS CDK-based pipeline can read from it for processing.
- AWS CodeCommit to store the AWS CDK deployment scripts and AWS CodeBuild, AWS CloudFormation integrated to deploy the AWS resources using an infrastructure as a code approach.
- AWS CloudTrail to audit user actions and trigger Amazon EventBridge rules when a QuickSight resource is created, updated or deleted, so that the QuickSight Asset Tracker is up-to-date.
- Amazon S3 to store metadata information, which is used by AWS CDK based pipeline to deploy the QuickSight resources.
- AWS LakeFormation to enable cross-account data access in support of the QuickSight Data Mesh
The following diagram provides a high-level view of the solution architecture.
![]()
The following provides a detailed walkthrough of the above architecture.
- QuickSight dataset, template, analysis, dashboard and visualization relationships:
- Steps 1 and 2 represent the QuickSight reference analysis reading data from different data sources that may include Amazon S3, Amazon Athena, Amazon Redshift, Aurora, or any other JDBC-based sources.
- Step 3 represents QuickSight templates being created from reference analysis when a customer-specific visualization needs to be created. Steps 4.1 and 4.2 represent customer analysis and dashboards being created from the templates.
- Steps 7 and 8 represent QuickSight visualizations getting generated from analysis or dashboards, and step 6 represents the customer analysis, dashboard, or visualizations referring to their own customer datasets.
- Step 10 represents a new fork being created from the base reference analysis for a specific customer, which will create a new QuickSight template and reference analysis for that customer.
- Step 9 represents end users accessing QuickSight visualizations.
- Asset Tracker REST API service:
- Steps 15.2–15.4 represent the asset tracker service, which is deployed in a shared AWS service account, where API Gateway provides the REST API layer, which invokes a Lambda function to read from or write to the backend Aurora database (Aurora Serverless v2 with PostgreSQL engine). The database captures all relationship metadata between QuickSight resources, its owners, assigned customers, and products.
- Online application: QuickSight asset discovery and creation
- Step 15.1 represents the frontend online application reading QuickSight metadata information from the asset tracker service to help customers or end-users discover visualizations available and be able to dynamically render based on the user login.
- Steps 11 and 12 represent the online application requesting creation of new QuickSight resources, which pushes requests to Amazon SQS, and then Lambda triggers CodeBuild to deploy new QuickSight resources. Steps 13.1 and 13.2 represents the AWS CDK-based pipeline maintaining the QuickSight resources to keep them in a consistent state. Finally, the AWS CDK stack invokes the asset tracker service to update its metadata, as represented in step 13.3.
- Tracking QuickSight resources created outside of the AWS CDK stack
- Step 14.1 represents users creating QuickSight resources using the console, and step 14.2 represents that activity getting logged into CloudTrail.
- Step 14.3–14.5 represent triggering the EventBridge rule for CloudTrail activities that represents the QuickSight resource being created, updated, or deleted, and then invoking the asset tracker REST API to register the QuickSight resource metadata.
Architecture decisions
The following are a few architecture decisions we made while designing the solution.
- Choosing an Aurora database for the asset tracker – We evaluated Amazon Neptune for the asset tracker database because most of the metadata information we capture is primarily maintaining relationships between QuickSight resources. But when we looked at the query patterns, we found the query pattern is always just one level deep to find who is the parent of a specific QuickSight resource, and that can be solved with a relational database’s primary key or foreign key relationship and with a simple self-join SQL query. Knowing the query pattern doesn’t require a graph database, we decided to go with Aurora to keep it simple, so that we can avoid introducing a new database technology and can reduce the operational overhead of maintaining it. In the future as the use case evolves, we can evaluate the need for a graph database and plan for integrating it. For Aurora, we choose Aurora Serverless because the usage pattern isn’t consistent to reserve a server capacity and the serverless tech stack will help reduce operational overhead.
- Decoupling the asset tracker as a common REST API service – The asset tracker has a future scope to be a centralized metadata layer to keep track of all the QuickSight resources across all business units of Huron. So instead of each business unit having its own metadata database, if we build it as a service and deploy it in a shared AWS service account, then we will benefit from reduced operational overhead and no duplicate infrastructure cost, and will be able to get a consolidated view of all assets and their integrations. The service enables applications to consume metadata about the QuickSight assets and then apply their own mapping of security policies to the assets based on their own application data and access control policies.
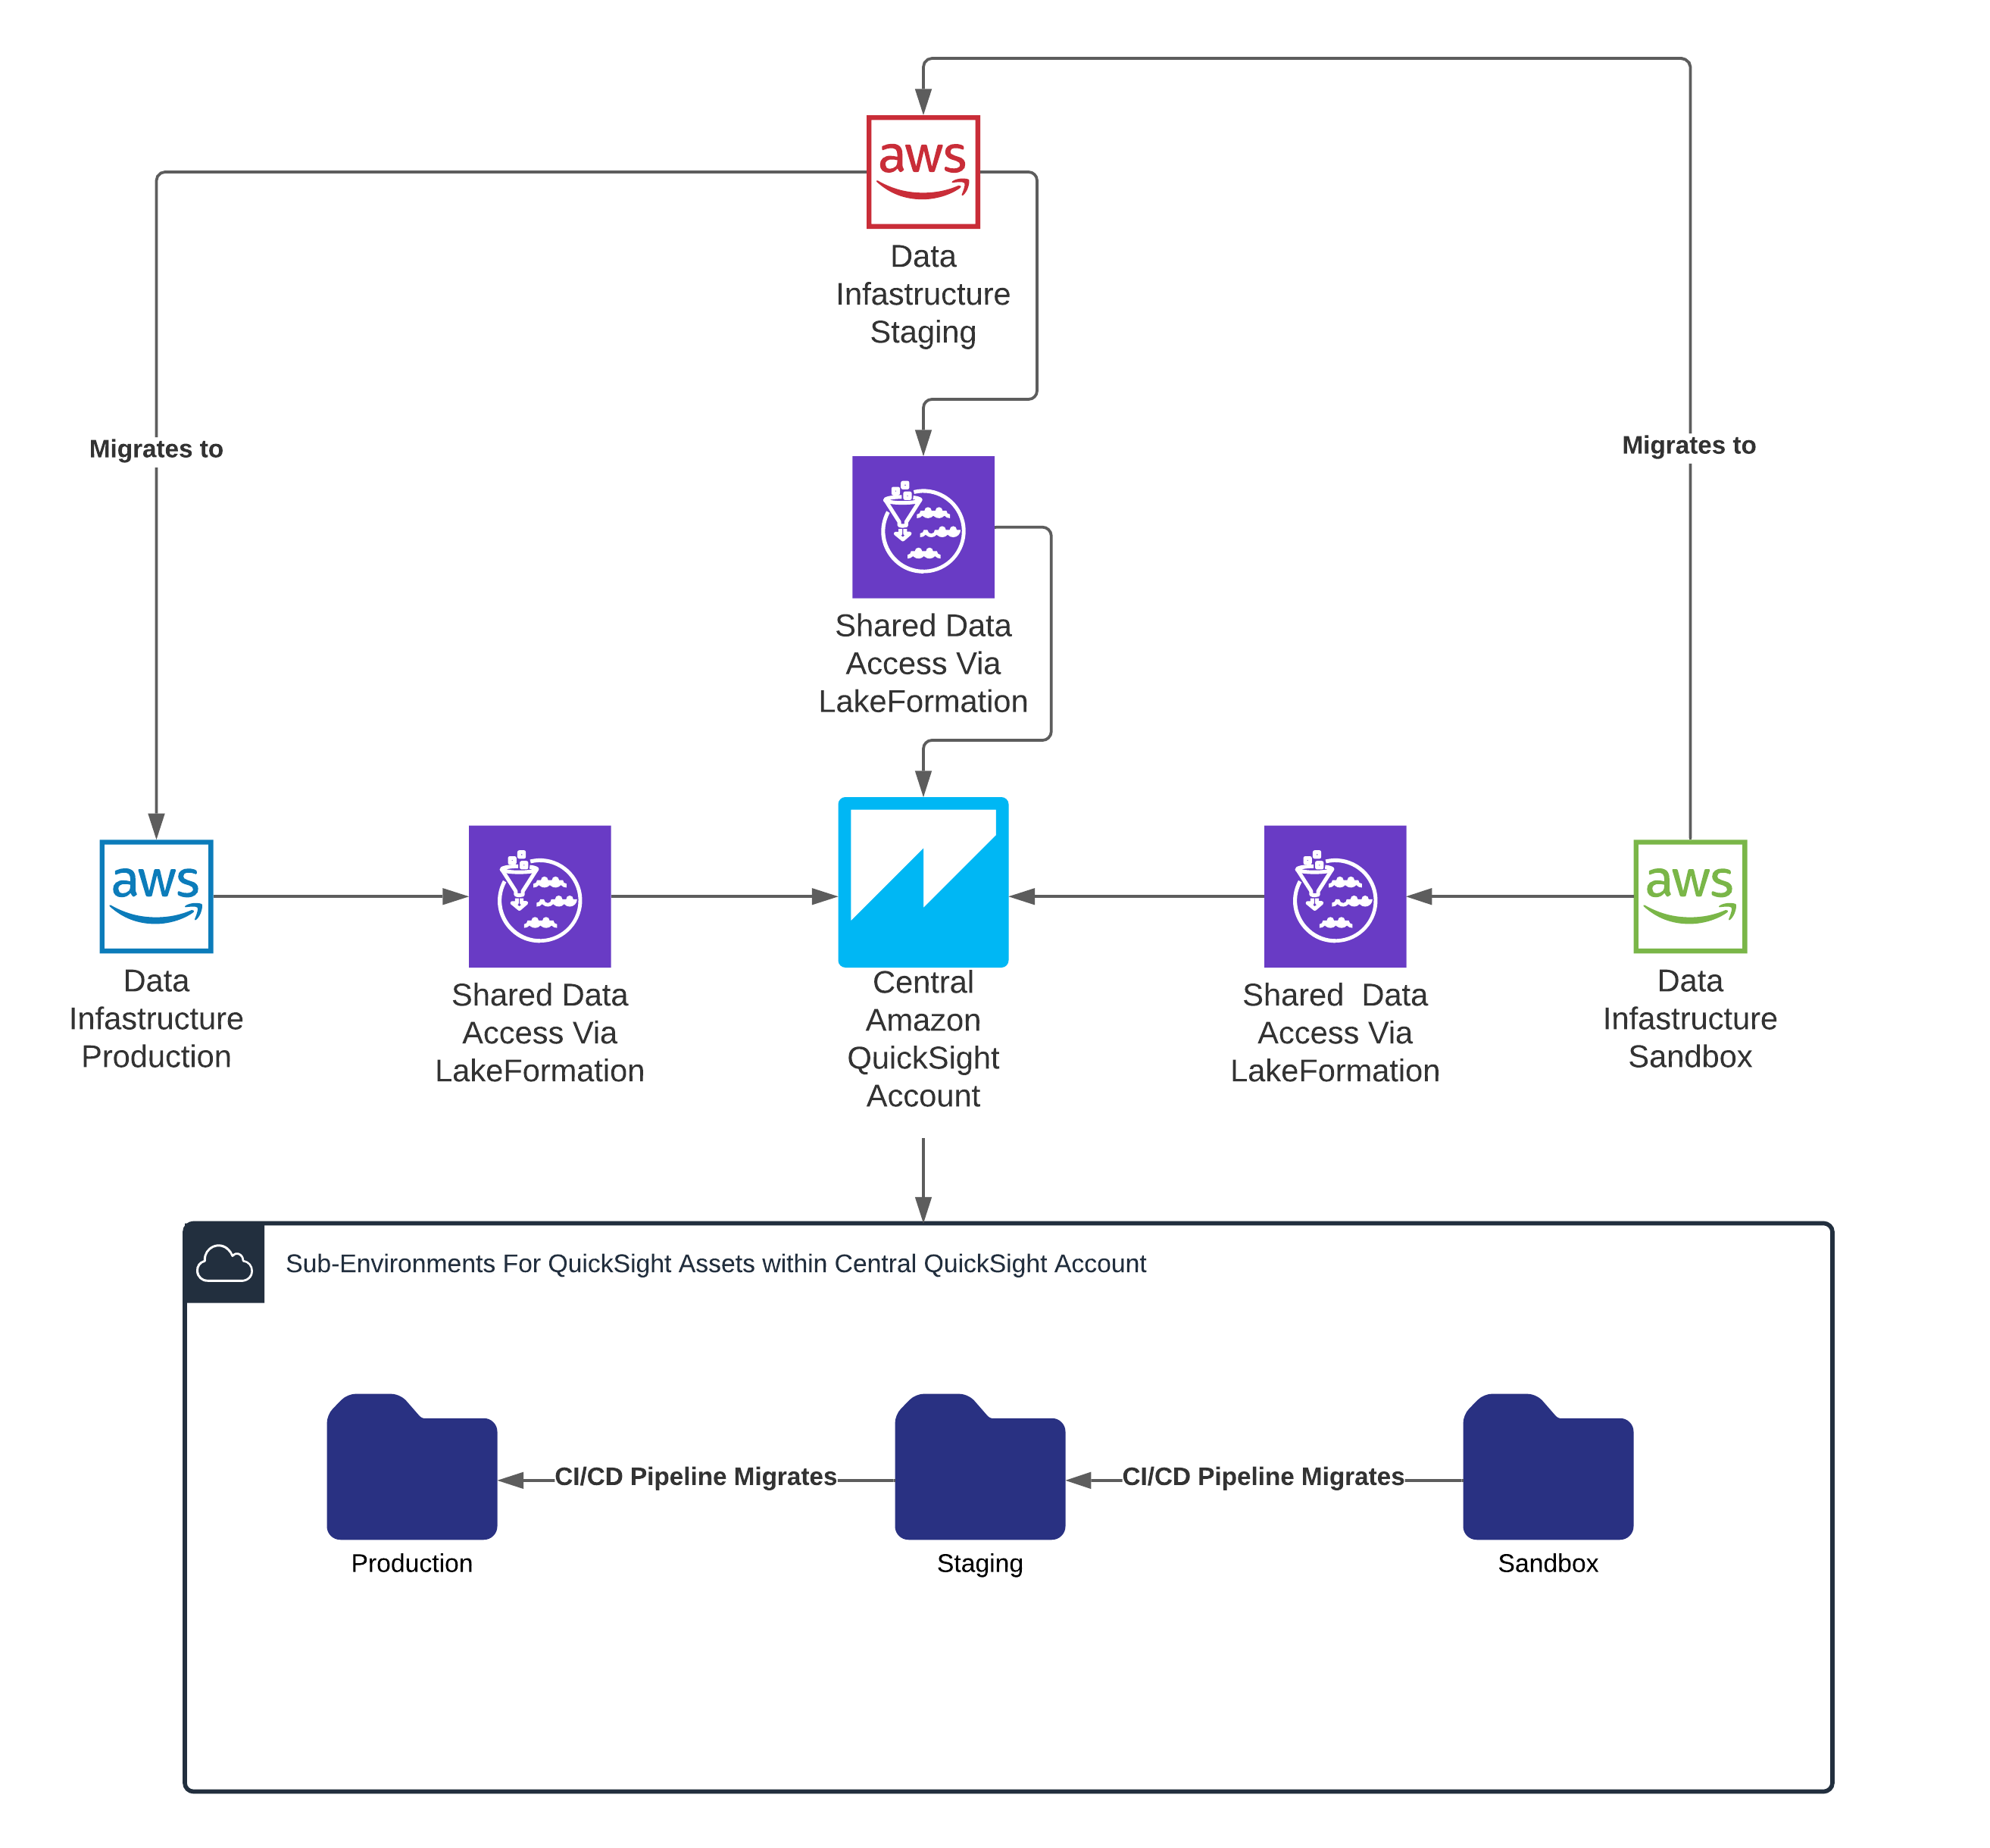
- Using a central QuickSight account with a subfolder for environments – We decided to use a central account, which reduces developer friction of having multiple accounts with multiple identities, and end-users having to manage multiple accounts and access to resources. QuickSight folders allow for appropriate permissions for separating environments. Furthermore, by using folder-based sharing with QuickSight groups, users with appropriate permissions already have access to the latest versions of QuickSight assets without having to share their individual identities.
The solution included an automated CI/CD pipeline to deploy the resources from development to staging and then finally to production. The following diagram provides a high-level view of the QuickSight CI/CD deployment strategy.
Aurora database tables and reference analysis update flow
The following are the database tables integrated to capture the QuickSight resource metadata.
- QS_Dataset – This captures metadata of all QuickSight datasets that are integrated in the reference analysis or customer analysis. This includes AWS ARN (Amazon Resource Name), data source type, ID and more.
- QS_Template – This table captures metadata of all QuickSight templates, from which customer analysis and dashboards will be created. This includes AWS ARN, parent reference analysis ID, name, version number and more.
- QS_Folder – This table captures metadata about QuickSight folders which logically groups different visualizations. This includes AWS ARN, name, and description.
- QS_Analysis – This table captures metadata of all QuickSight analysis that includes AWS ARN, name, type, dataset IDs, parent template ID, tags, permissions and more.
- QS_Dashboard – This table captures metadata information of QuickSight dashboards that includes AWS ARN, parent template ID, name, dataset IDs, tags, permissions and more.
- QS_Folder_Asset_Mapping – This table captures folder to QuickSight asset mapping that includes folder ID, Asset ID, and asset type.
As the solution moves to the next phase of implementation, we plan to introduce additional database tables to capture metadata information about QuickSight sheets and asset mapping to customers and products. We will extend the functionality to support visual based embedding to enable truly integrated customer data experiences where embedded visuals mesh with the native content on a web page.
While explaining the use case, we have highlighted it creates a challenge when a base reference analysis gets updated and we need to track the templates that are inherited from it make sure the change is pushed to the linked customer analysis and dashboards. The following example scenarios explains, how the database tables change when a reference analysis is updated.
Example Scenario: When “reference analysis” is updated with a new release
When a base reference analysis is updated because of a new feature release, then a new QuickSight reference analysis and template needs to be created. Then we need to update all customer analysis and dashboard records to point to the new template ID to form the lineage.
The following sequential steps represent the database changes that needs to happen.
- Insert a new record into the analysis table to represent the new reference analysis creation.
- Insert a new record into the template table with the new reference analysis ID as parent, created in Step 1.
- Retrieve analysis and dashboard table records that point to the previous template ID and then update those records with the new template ID created in Step 2.
Enabling a more robust embedding experience
The QuickSight asset tracker integration with Huron’s products provides users with a personalized, secure, and modern analytics experience. When users log in through Huron’s online application, it uses the logged-in user’s information to dynamically identify the products they are mapped to and then renders the QuickSight visualizations and dashboards that the user is entitled to see. This will improve the user experience, enable granular permission management, and also increase performance.
How AWS collaborated with Huron to help the solution
The AWS team collaborated with Huron team to design and implement the solution. An AWS Data Lab Resident Architect collaborated with Huron’s lead architect for the initial architecture design that compared different options for integration and derived trade-offs between them, before finalizing the final architecture. Then with the help of an AWS Professional Services engineer, we built the base solution that can be extended by the Huron team to roll it out to all business units and integrate additional reporting features on top of it.
The AWS Data Lab Resident Architect program provides AWS customers with guidance in refining and implementing their data strategy and solutions roadmap. Resident Architects are dedicated to customers for 6 months, with opportunities for extension, and help customers (Chief Data Officers, VPs of Data Architecture, and builders) make informed choices and trade-offs about accelerating their data and analytics workloads and implementation.
AWS Professional Services is a global team of experts that can help you realize your desired business outcomes when using the AWS Cloud. The AWS Professional Services team works together with your team and your chosen member of the AWS Partner Network (APN) to implement your enterprise cloud computing initiatives.
Next steps
Huron has rolled out the solution for one business unit, and as a next step we plan to roll it out to all business units, so that the asset tracker service is populated with assets available across all business units of the organization to provide a consolidated view.
In addition, Huron will be building a reporting layer on top of the Aurora asset tracker database, so that the leadership has a way to discover assets by business unit or owner, reports created between a specific date range, or reports that haven’t been updated for a while.
After the asset tracker is populated with all QuickSight assets, it will be integrated into the frontend online application that can help end-users discover existing assets and request creation of new assets.
Newer QuickSight APIs such as assets as a bundle and assets as code further accelerate the capabilities of the service by improving the development velocity and reliability of making changes.
Conclusion
This post explained how the Huron Consulting Group built an asset tracker to keep track of all QuickSight resources across the organization. This solution may provide a reference to other organizations who would like to build an inventory of visualization reports, ML models, or other technical assets. This solution used Aurora as the primary database, but if you would like to build a detailed lineage of all the assets to understand how they are interrelated, you can consider integrating Neptune as an alternate database.
If you have a similar use case and want to collaborate with AWS Data Analytics Specialist Architects to brainstorm on the architecture, rapidly prototype it, and implement a production-ready solution, then connect with your AWS Account Manager or AWS Solutions Architect to start an engagement with the AWS Data Lab team.
About the Authors
 Corey Johnson is the Lead Data Architect at Huron, where he leads its data architecture for their Global Products Data and Analytics initiatives.
 Sakti Mishra is a Principal Data Analytics Architect at AWS, where he helps customers modernize their data architecture, help define end to end data strategy including data security, accessibility, governance, and more. He is also the author of the book Simplify Big Data Analytics with Amazon EMR. Outside of work, Sakti enjoys learning new technologies, watching movies, and visiting places with family.