AWS Database Blog
Uncover financial fraud with Amazon Neptune and Tom Sawyer Perspectives
This is a guest post written by Janet M. Six, Senior Product Manager at Tom Sawyer Software.
 Fraud and corruption affect the lives of millions of people by impacting the financial health of corporations and individuals. Fraud is typically carried out by multiple parties that, by their very nature, strive to remain hidden in plain sight. As a result, many industries have adopted fraud detection solutions. Fraudulent activities like identity theft and compromises to corporate and government networks have increased dramatically in recent years. Because of the high stakes involved, fraud detection is critical to governance in finance and banking, government, law enforcement, insurance, healthcare, taxation, and other industries.
Combining graph databases with graph visualizations and analytics can help detect fraud. The power of social network analysis enables organizations to identify key, highly connected individuals participating in fraud, to track down the influencers and ringleaders and disrupt these networks. Analysts can visualize the steps that individuals take to commit fraud, see the relationships between fraudulent activities, view the pathways through which transactions occur, and review the patterns in historical fraudulent behavior to inform predictive analysis and prevention tactics. Analytic services can mine data for patterns and report those incidents to other systems and analysts.
In this post, we discuss the power of Amazon Neptune in discovering financial fraud, and how graph visualization and analysis applications built with Tom Sawyer Perspectives help analysts investigate and validate fraud.
Detect fraud with Amazon Neptune and Tom Sawyer Perspectives
Graph databases are especially useful for fraud detection and analysis because they natively show relationships between accounts, customers, businesses, transactions, and other network elements. Also, it’s more efficient to explore connected data in graph databases than in relational databases because there is no need to perform expensive join operations to traverse a path of connections in the data.
Neptune is a fast, reliable, fully managed graph database service that makes it simple to build and run applications that work with highly connected datasets. Neptune supports leading graph query languages, Apache TinkerPop Gremlin, and openCypher for labeled property graphs and W3C SPARQL for RDF.
Tom Sawyer Perspectives is a low-code graph visualization and analysis SDK that works especially well with graph databases. Integrated design and preview interfaces and extensive API libraries allow developers to quickly create custom, production-quality visualization and analysis applications. With the Perspectives point-and-click Designer interface, you can design and develop applications with custom drawing, map, chart, table, tree, inspector, and timeline views to gain insights into data federated from multiple sources. Perspectives provides top-tier graph visualizations, analysis, and navigation using five automated layouts, swimlanes, nested drawings, and 30 built-in analytics, for a powerful user experience that cuts through complex data. Perspectives also includes an optimized Neptune integrator for both reading and updating data with schema extraction for rapid application development. Applications created with Perspectives can also consume Neptune streams and employ AWS Lambda functions, enabling graph analytics on incoming data in real-time.
Once created, Perspectives applications can be deployed on-premises, onto an Amazon Elastic Compute Cloud (Amazon EC2) instance, or through scalable container orchestration utilizing Amazon Elastic Container Service (Amazon ECS), Amazon Elastic Kubernetes Service (Amazon EKS), and AWS Fargate with a subscription to the Tom Sawyer Perspectives Deployment Container on the AWS Marketplace.
Within the financial sector, investigators looking to discover fraud and disrupt it can benefit from graph databases, visualization, and analysis in the following ways:
- Exploring the relationships inherent in the graph database data
- Identifying suspicious patterns of behavior both visually and through data-driven analytics
- Reducing the number of false positives from automated alerts through further investigation of related elements
- Provide context to machine learning and other analysis of the data
The example application we built with Perspectives includes two ways in which you can explore potential fraud rings: the Alerts module visualizes potential fraud rings found through automated queries, while the Explorer module allows you to examine accounts or transactions of your interest and interactively explore the data from that point. The visualization in the Alerts module shows potential fraud rings that have been discovered through Gremlin query alerts and supports exploration of related Neptune elements. The Explorer module presents results of a Gremlin query of your choice and supports exploration through loading of related elements and interactive filtering. Let’s take a closer look at these two ways to detect fraud.
Bringing two techniques together to disrupt fraud
Investigators can utilize automated alerts and user-directed exploration of Neptune data together in order to disrupt fraud.

Figure 1: Using Perspectives, you can create an application which utilizes background analytics to create alerts. You can visualize the results of these alerts to validate alerts and reduce false positives.
First, analytic processes are running constantly in the background in order to discover potential fraud and create alerts. Next, the alerts are prioritized and presented to an investigator for further explorations. Then, the investigator can validate or dismiss the alerts using a rich set of graph-based visualizations and analysis. The investigator can combine the results of these alerts with ad hoc investigative findings in order to discover and disrupt fraud in multiple fraud rings of varying interrelation. Additionally, investigators can annotate the graph data with their findings and initiate additional procedures to disrupt the fraud.
The Neptune example fraud dataset
For this post, we created an example fraud detection application that uses the data described in Building a Fraud Graph Application on Amazon Neptune. This data has been produced by AWS specifically for experiments and demonstrations and obtained from GitHub. To the best of our knowledge, the data is fictitious. However, we also obfuscated it to ensure that it doesn’t accidentally match personally identifiable information.
The following table summarizes the schema for this fraud detection application.
| Schema Node | Description |
Account |
Account number and associated name |
Address |
Location for account |
DateOfBirth |
Date of birth for account holder |
EmailAddress |
Email address for account holder |
FraudRing |
List of accounts suspected to be in a fraud ring |
IPAddress |
IP address associated with account |
Merchant |
Business that conducts credit card transactions |
PhoneNumber |
Phone number associated with account |
Transaction |
A transaction initiated with an account at a merchant |
| Schema Edge | Source Node | Target Node | Description |
ACCOUNT |
Account |
Transaction |
A transaction that happened on this account |
MERCHANT |
Transaction |
Merchant |
A transaction that happened at this merchant |
In Perspectives, you interact with the schema through a graph-based visualization. The following figure shows the schema from the example fraud detection application. A property graph represents the schema elements with nodes in green and detailed relationship information in orange. Attributes can be element values or references to attributes in another schema element. A model element can inherit attributes from one or more existing model element types as long as they have the same object model type.

Figure 2: Using the Perspectives Schema Editor, you can see an overview of the types of nodes or elements in Neptune and how they connect to types of edges or relationships.
Discovering fraud rings with automated alerts
Investigators can more quickly discover fraud through the use of automated analysis and alerts. However, sometimes alerts create false positives that aren’t actually fraud. Further exploration of the data surrounding that which spawned an automated alert can reduce false positives and their costly effects. In our example application, the Alerts module uses Gremlin query alerts to find fraud rings in the Neptune database by looking for a group of accounts that share the same features, such as physical addresses, phone numbers, or email addresses. The following visualization shows a fraud ring involving 10 accounts. Swimlanes visually separate ring elements by type so you can quickly see how many different IP addresses, phone numbers, email addresses, dates of birth, and physical addresses are used.

Figure 3: Applying swimlanes, you can quickly add a categorization of elements to your graph visualization.
Many potential fraud rings look suspicious; however, let’s look at these 10 accounts, which share six features, as an example to investigate further. In the following visualization, we focus on the phone number used by seven different accounts.

Figure 4: You can focus on the seven accounts which use a single phone number by applying a Hierarchical layout.
Because they share so many features, in the following visualization, we mark the accounts as fraudulent by right-clicking each and choosing Fraudulent from the menu.

Figure 5: By selecting a node, and right-clicking to open a context menu, you can mark specific accounts as fraudulent.
Next, we focus on one of the accounts, Lei Ai****. Adding swimlanes to the following visualization helps us quickly see all the fraud alerts and transactions associated with this account. Swimlanes not only add a layer of categorization information to the visualization, they also give context to the elements within in it. In this case, we can very quickly see the account in question, the recent transactions associated with this account, and the involved IP address.
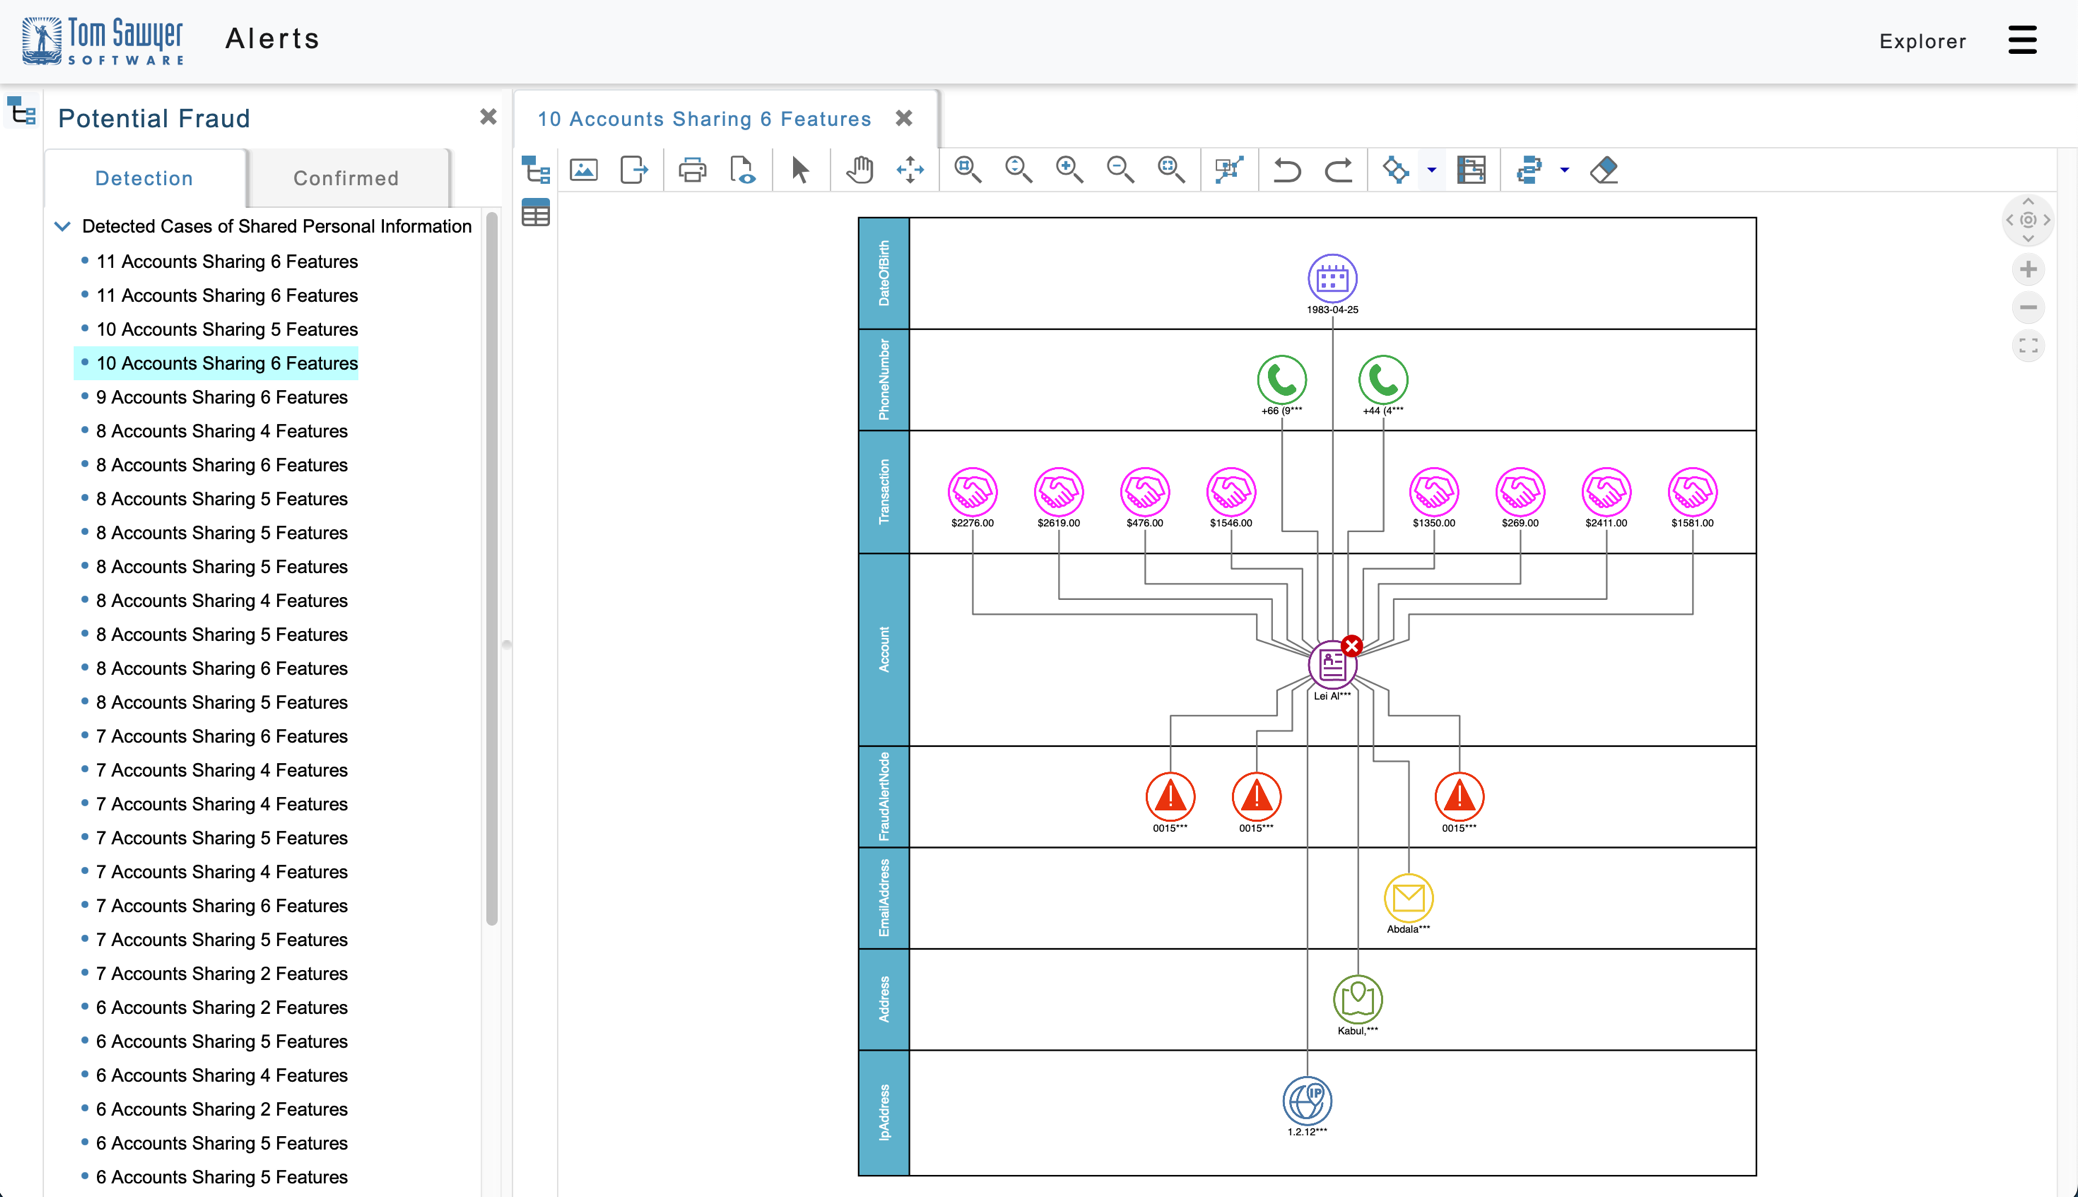
Figure 6: By selecting a node, and right-clicking to open a context menu, you can load additional elements to explore additional transactions from a fraudulent account. In addition, you can apply swimlanes to add categorization of the data.
Due to the numerous activities in this account and the relationship to other suspicious accounts, you can load additional Neptune data into the following visualization by selecting nodes and loading related elements to identify how far the fraud may go beyond the initial ring. In the following visualization, you can see the results of interactively loading neighbors of many suspicious accounts to see that many accounts and businesses may be affected by this suspected fraud ring. You can interactively explore this information visually, through search, through table listings, and with the results of betweenness and degree centrality analyses, which direct us to points of especially high activity.

Figure 7: By selecting a group of nodes, and right-clicking to open a context menu, you can load additional elements related to the selected nodes and exploring data near the fraud ring.
When you have a high-level view of not only the initially suspected fraud rings that were discovered with Gremlin fraud detection queries, but also related elements that may include additional fraud, you can gain insights on the most central participants of the fraud rings and understand the relationships between different fraud rings.
Discovering fraud through navigation
Sometimes investigators need to employ ad hoc exploration of Neptune data to identify fraud when they have performed their own investigations separate from the data. The example application we built supports this type of investigation in the Explorer module by allowing you to search for certain accounts or merchants and then explore the related elements. For example, you may suspect, or have received outside evidence, that a certain merchant is associated with fraudulent activity even if Gremlin fraud detection queries haven’t produced an alert. In the following figure, we load a merchant of interest and recent transactions into the application by running a Gremlin query:
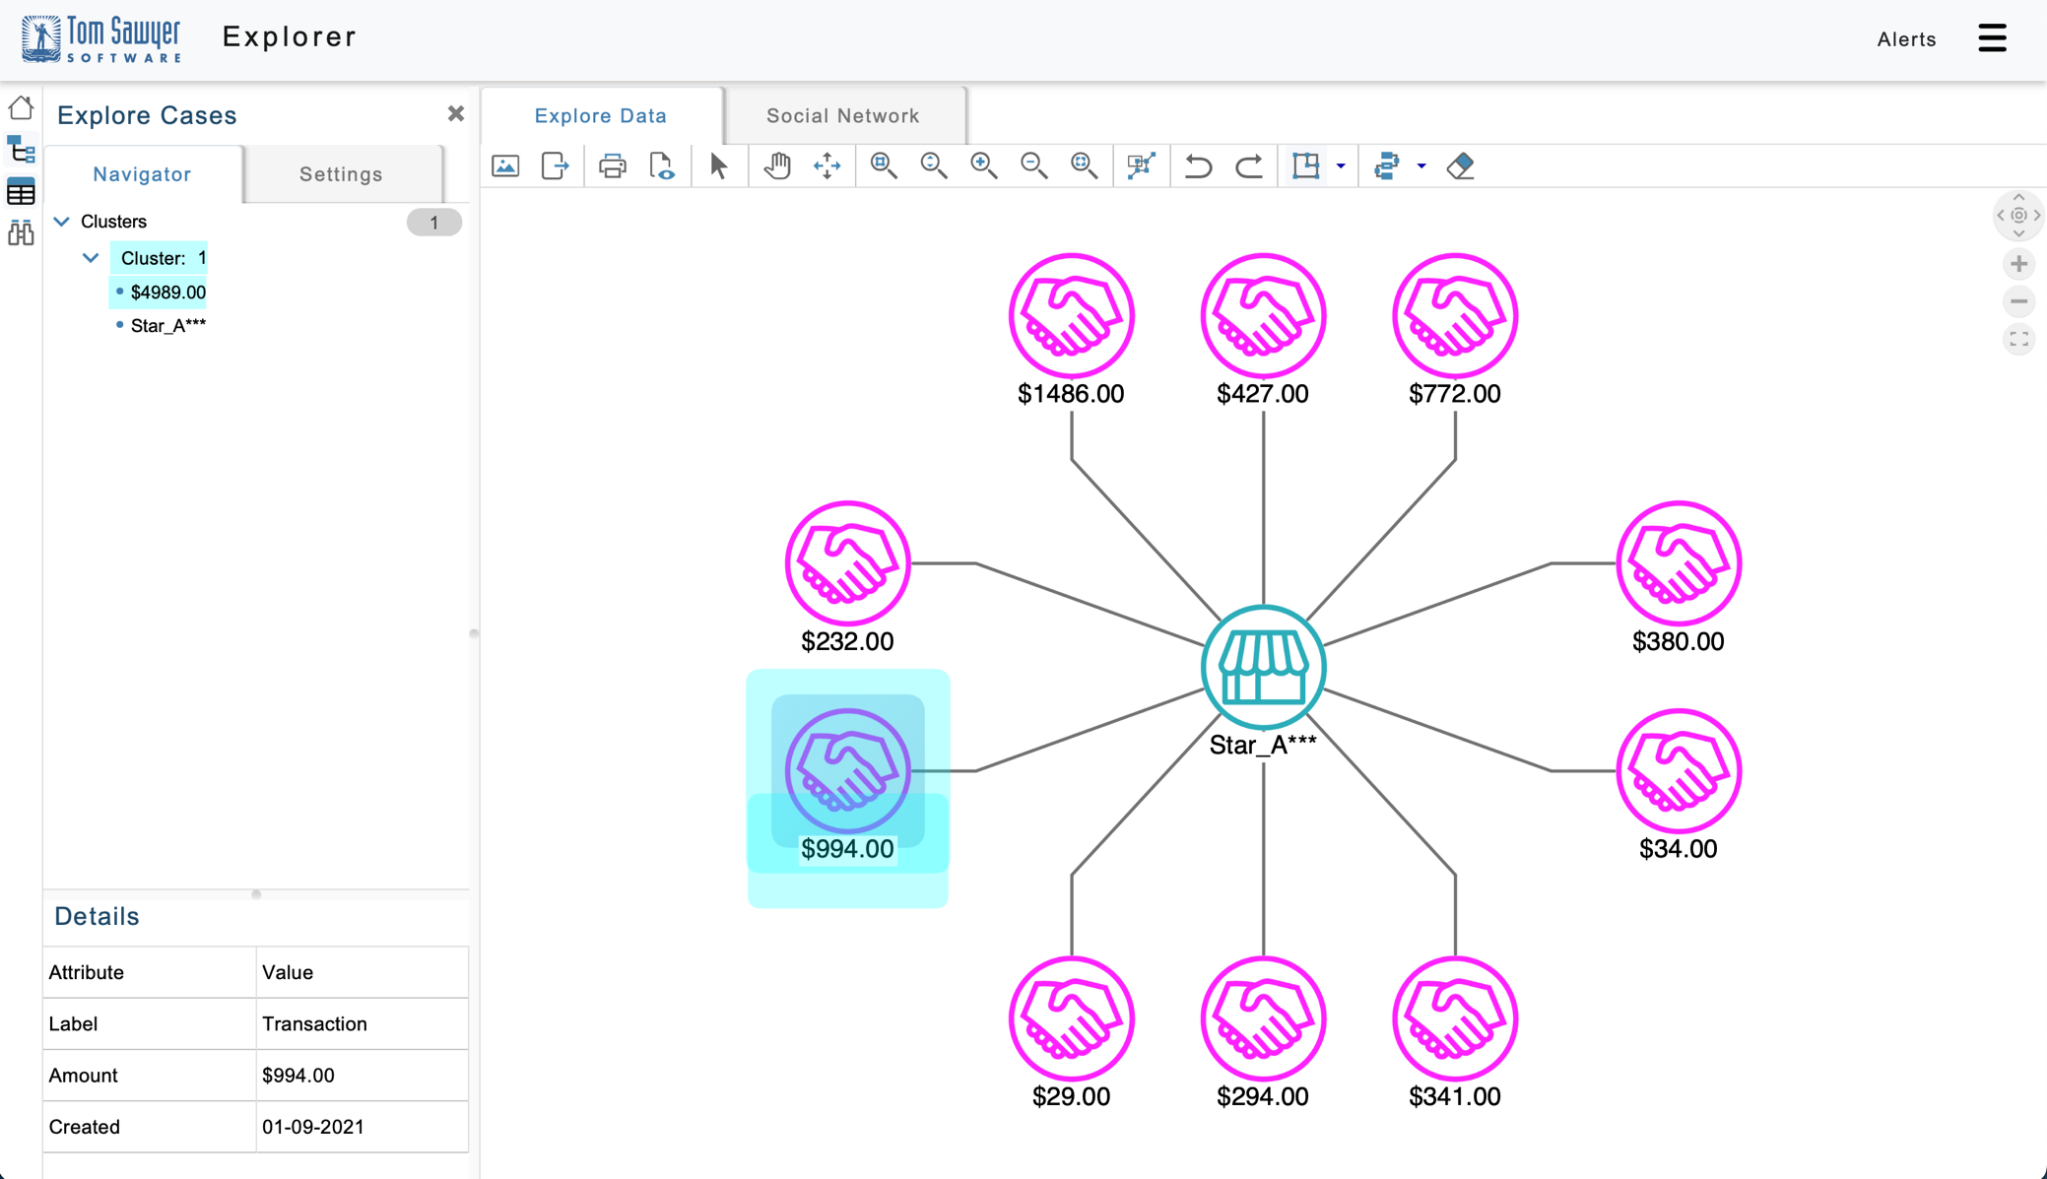
Figure 8: You can focus on a suspicious transaction by clicking on the node and seeing details of that element in the inspector in left, bottom corner of the application.
You can explore the $994 transaction by right-clicking on that transaction and loading related elements. The following figure shows the account and IP address associated with that transaction.

Figure 9: By selecting a node, and right-clicking to open a context menu, you can load the account and IP address associated with the suspicious transaction.
In the following figure, you can load additional transactions associated with this IP address by right-clicking on it and loading neighbors.
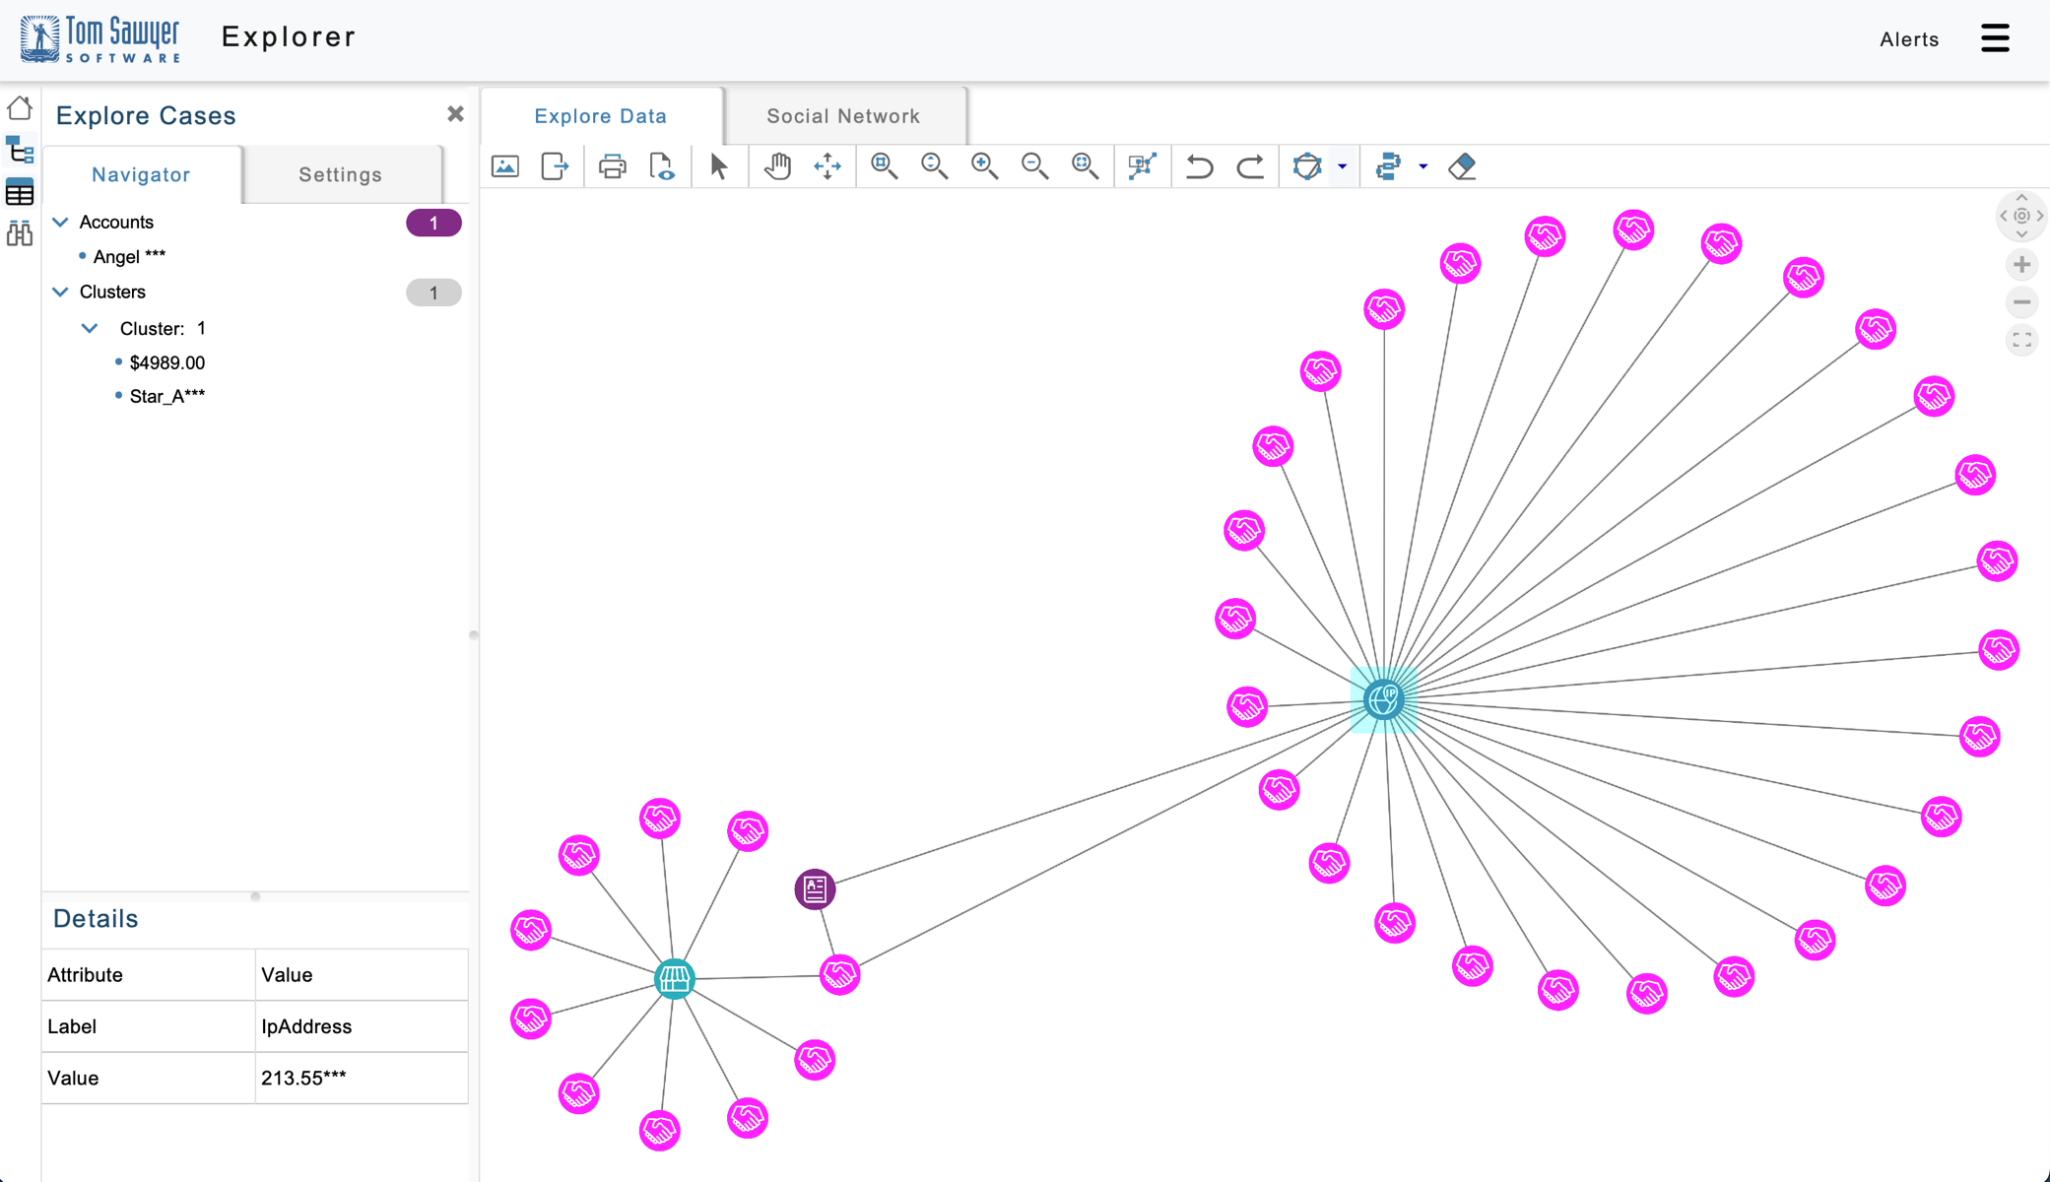
Figure 10: By selecting the IP address with a suspicious transaction, and right-clicking to open a context menu, you can load additional transactions from that IP address.
This IP address is associated with many recent transactions. In the following figure, you can explore the timeline view that shows exactly when these transactions occurred.

Figure 11: Using the timeline view, you can examine how many transactions occurred from the suspicious IP address and when they occurred.
This visualization shows many large transactions happening in a short space of time, which could indicate fraud. In the following figure, we load more Neptune elements to show the business associated with the $945 transaction.
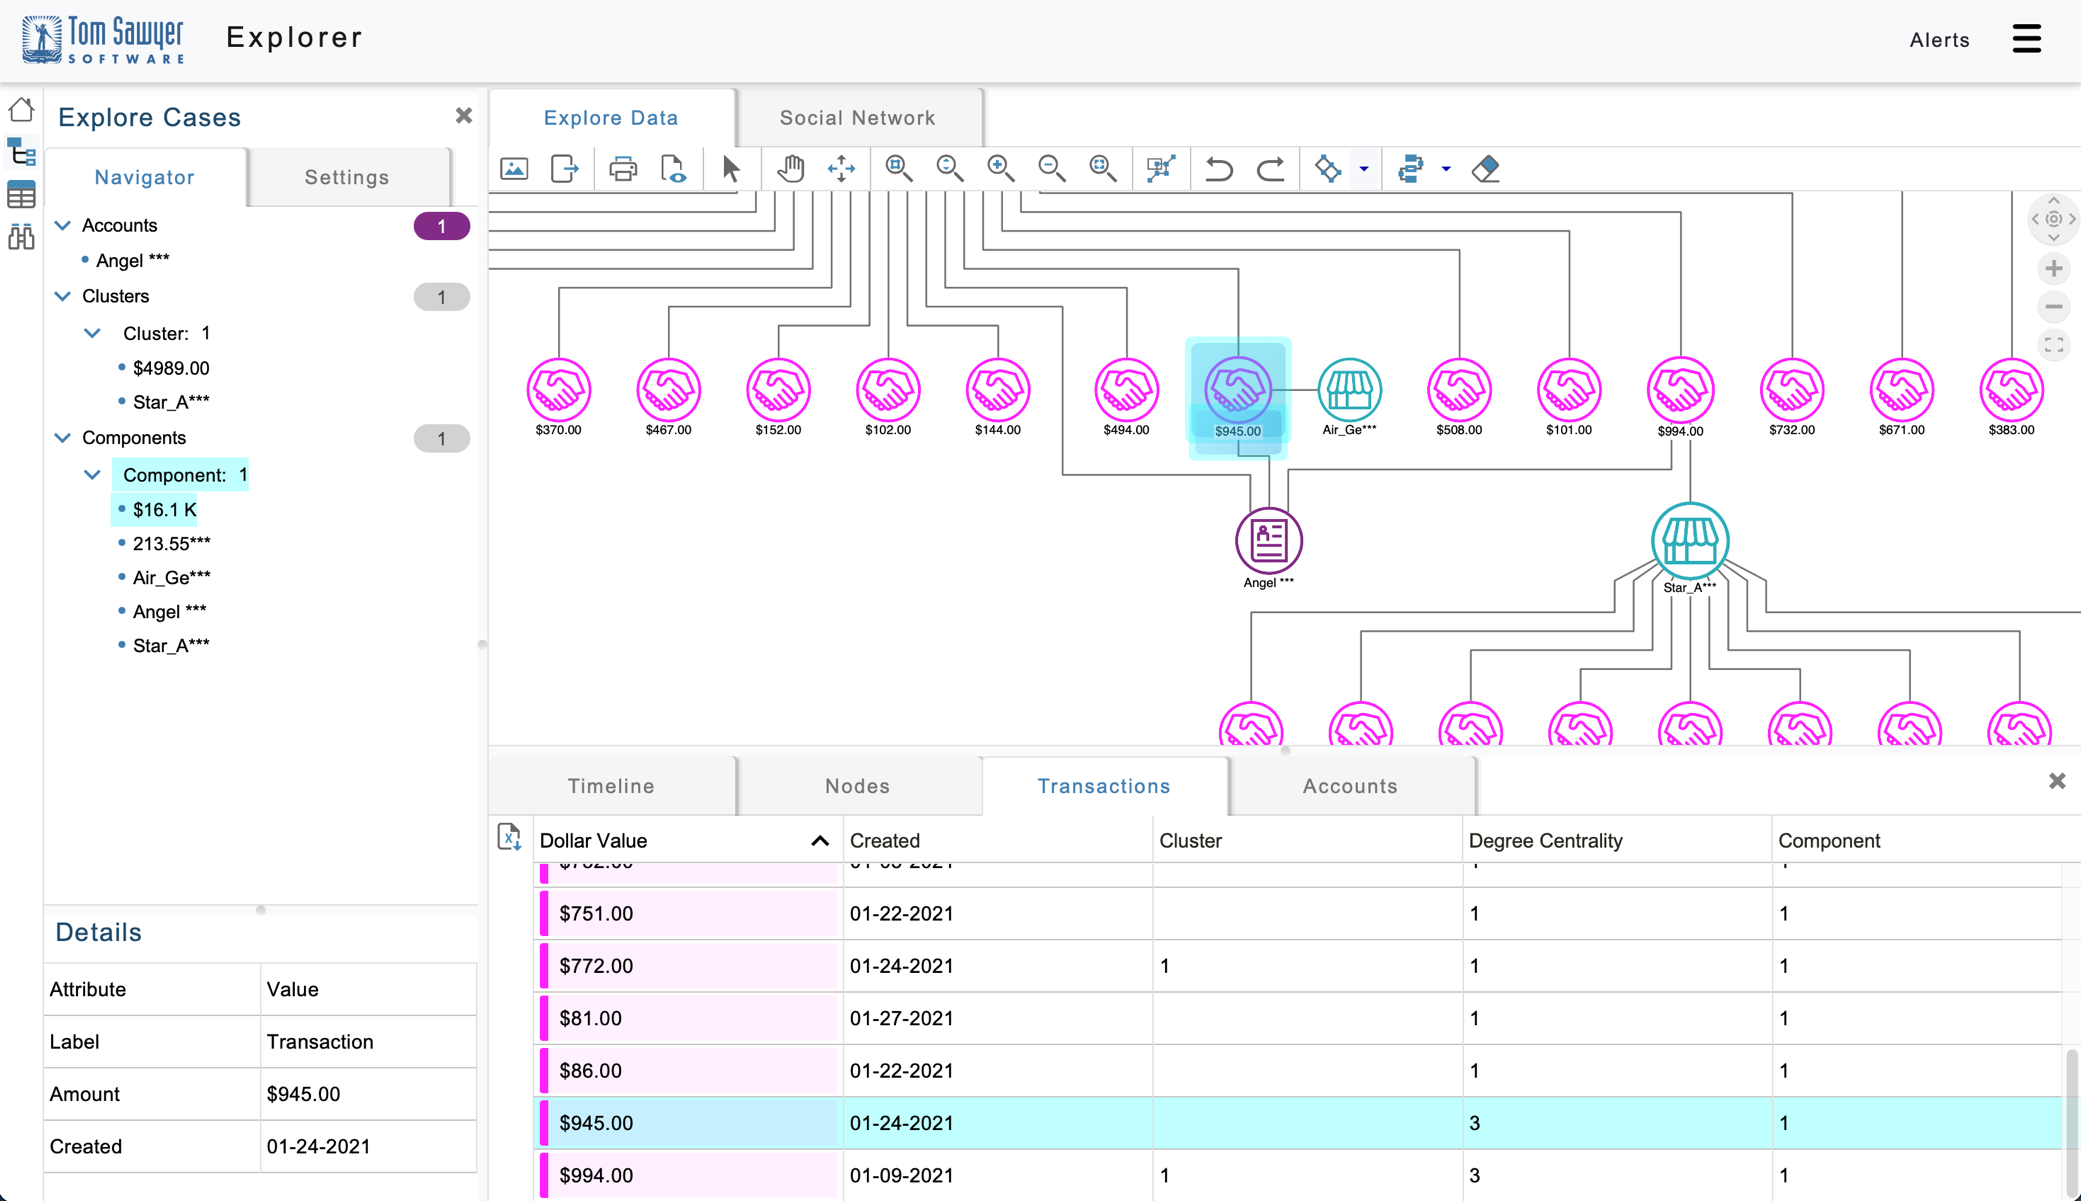
Figure 12: You can use the table view to see information about several elements at one time, and also select elements in the table to zoom to those elements in the graph visualization.
This is another merchant related to the airline industry, so in the next figure we load more Neptune elements to understand more about the transactions associated with this IP address.

Figure 13: Using the synchronized views in the application, you can simultaneously examine the suspicious transactions in the graph visualization, the tree view, and the table view.
Four transactions are related to the airline industry from this IP address, which shows the potential for this account to be associated with fraud targeted on the airline industry. After we find this area of interesting activity, an investigation can be opened to further explore the potential fraud and disrupt it.
Conclusion
With the power of Neptune combined with Perspectives visualization, navigation, and analysis, you can build and deploy a custom application that explores fraud rings, their related elements, and the overall transaction system to find and disrupt systemic fraud. This exploration allows you to better understand fraud detection alerts created through Gremlin queries and conduct interactive investigations on elements not flagged through alerts.
This ability to incorporate automated real-time detection with interactive investigation supports financial institutions in quickly discovering fraud.
To learn more about Neptune, refer to the User Guide. To see the Financial Fraud example application, visit Tom Sawyer Software. Ready to build your fraud application with Tom Sawyer Perspectives? We can help you get started with a guided evaluation. You’ll receive our software with complete product documentation. We also offer consulting and training during the evaluation for a smooth and successful experience. Just getting your feet wet on your graph transformation journey? Try out Tom Sawyer Graph Database Browser with your Neptune database to understand where graphs could deliver the most value for your business.
About the author
 Janet M. Six, PhD., is Senior Product Manager at Tom Sawyer Software. She stands at the intersection of the technical, business, and design sectors and helps to weave together the complex needs for today’s leading-edge data visualization and analysis products. Her interests include graph visualization, analysis, and artificial intelligence.