Artificial Intelligence
Amazon SageMaker AI now detects latency drift, idle GPUs, and missed optimizations on your inference endpoints
Every inference endpoint is well tuned the day it goes into production. Teams choose an instance type, serving configuration, and scaling settings that suit the model and its traffic at launch. With the endpoint serving smoothly, they understandably move on to the next priority. The workload, however, rarely stays still. Traffic patterns evolve, prompts grow longer, serving engines such as vLLM ship new releases, SageMaker inference develops new optimization techniques, and new fine-tuned checkpoints change the resources your model needs. Over time, a well-tuned endpoint quietly drifts. Latency and time to first token edge upward. A configuration that was never quite ideal keeps missing available performance gains. A GPU provisioned for demand that never materialized sits idle week after week. Because nothing has failed, no alarm sounds, and the drift goes unnoticed until users feel it or the bill reflects it.
Amazon SageMaker AI now monitors your generative AI inference endpoints and tells you when a change could improve performance or lower cost by using Generative AI optimized inference recommendations feature with Agentic experience in Amazon SageMaker Studio. Monitoring is on by default for SageMaker AI inference endpoints using vLLM serving containers and GPU instances, with no setup required, and you can opt out of endpoints. SageMaker AI looks only at operational signals: latency, GPU utilization, and the endpoint’s serving configuration. It does not read your requests or responses. From those signals, it surfaces three kinds of findings:
- Latency drift: A week-over-week rise in median (p50) end-to-end latency or time to first token.
- Unused capacity: GPUs you pay for that sit mostly idle.
- Configuration gaps: A serving container that’s missing newer performance improvements or security patches, or an optimization such as speculative decoding or GPU kernel tuning that your model supports but the endpoint doesn’t use.
SageMaker AI sends a finding through AWS Health, with one notification per endpoint that covers that endpoint’s findings. When a notification arrives, you can act on it in one place. It opens the SageMaker AI agentic experience in Amazon SageMaker Studio with the endpoint, and its recent traffic already filled in. From there, you run inference recommendations to benchmark your current configuration against alternatives and compare them side by side on response time, throughput, and cost per million tokens. That turns a judgment call into a decision backed by data. Benchmarks run on separate compute, and nothing changes on your endpoint until you choose to apply a result.
In this post, we show how SageMaker AI monitors your endpoints and how to read the notifications it sends through AWS Health. We then show how to go from a notification to a benchmarked decision in SageMaker Studio. We walk through three example scenarios, show how to apply or dismiss a recommendation safely, and explain how to opt an endpoint out of monitoring.
Solution overview
SageMaker AI inference recommendations follow a four-step loop: observe, notify, recommend, and decide. Each step is designed so that you stay in control, and your production endpoint isn’t changed without your explicit action.
- Observe – Monitoring of latency and capacity usage is on by default for eligible endpoints. It doesn’t read your requests or responses, and it carries no additional GPU cost.
- Notify – When there is something worth acting on, you receive a plain language notification in AWS Health, plus email, explaining what was observed, why it matters, and a recommended next step.
- Recommend (opt in) – One selection opens the SageMaker AI agentic experience in SageMaker Studio, prefilled with the endpoint and its observed traffic, so you can benchmark alternatives on separate compute.
- Decide – Compare response time, throughput, and cost side by side. Production is not changed until you apply a result.
The feature produces a few types of findings. The following table summarizes what triggers each one and what gets tested when you choose to benchmark.
| Finding | What triggers it | What a benchmark tests |
| Latency drift | Response time moves relative to the endpoint’s week-over-week trends | Tensor parallelism settings and alternate instance types or sizes |
| Underutilized GPUs | GPU utilization stays well below capacity over the window | Cheaper instance types and smaller sizes at observed peak traffic |
| Speculative decoding not enabled | Model and container support it, but it is off (configuration based) | Current configuration compared to speculative decoding enabled |
| Serving container | The endpoint’s serving container has a newer version with a performance improvement and security patches for critical and high finding Common Vulnerabilities and Exposures (CVEs). | Current compared to updated container |
| Untuned GPU kernels | Kernel configuration is not tuned for the model and hardware | Default compared to tuned kernels |
Prerequisites
Monitoring itself needs no setup, it is on by default. The following prerequisites apply when you choose to act on a finding by running a benchmark and, optionally, applying a change:
- Access to AWS Health and the AWS User Notifications console.
- A SageMaker Studio domain and AWS Identity and Access Management (IAM) permissions to run inference recommendation jobs and update endpoints.
- Sufficient service quota for the benchmark instances you want to test.
Cost note: Monitoring has no GPU cost. Benchmarks use standard SageMaker AI charges, or your machine learning (ML) reservation if you have one.
Understand a finding notification
You receive notifications in AWS Health on the console and by email and each one follows the same structure, so it’s quick to scan:
- Endpoint: Which endpoint the finding applies to.
- What we noticed: The observation, stated plainly, with estimates clearly labeled as estimates.
- Why it matters: The impact on latency, capacity, or cost.
- Recommended action: A single selection into the agentic experience in SageMaker Studio to investigate.
Notifications report observations and label estimates. No benchmark has run at this point. A representative notification reads as follows:
|
Subject: [Action may be required] SageMaker AI inference improvements for your endpoint SageMaker AI tracks the latency and capacity usage of your inference endpoints by default, and found improvements for one of them. It does not read your requests or responses. What we noticed: Over the past week, time to first token on this endpoint increased compared with the week before. Recommended action: Open SageMaker Studio to benchmark alternatives on separate compute. Your production endpoint is not changed. |
Cadence: Each endpoint gets one notification that covers the applicable findings. You get at most one notification per endpoint at a time, covering all its findings, and SageMaker AI limits how many an account receives at once. Notifications are AWS Region specific, so you see an endpoint’s findings when you’re signed in to that endpoint’s Region.
Walkthrough: From notification to decision
In this section, we review a few scenarios of endpoint optimizations that will trigger findings to be reported.
Scenario 1: Catch week-over-week latency regression
A team runs a chat assistant on a single SageMaker AI endpoint. They add retrieval to improve answer quality, so every request now carries pages of retrieved context and prompts get much longer. Nothing breaks, and no alarm they set trips, but responses start more slowly.
SageMaker AI compares the endpoint’s median (p50) time to first token and median end-to-end latency with the previous week. When either one rises enough over the week, it flags the change. Because the comparison is against the endpoint’s own history, the team doesn’t need to set a threshold in advance.
- Notification: AWS Health reports that time to first token increased relative to the prior week.
- Studio session: One selection opens the agentic experience, prefilled with the endpoint and its observed traffic.
- Benchmark: The session tests tensor parallelism settings and other instance types or sizes on separate compute.
- Decision: The team compares latency, throughput, and cost, then applies the winning configuration to one variant.
The following screenshot shows an AWS Health event for a latency drift finding. The message reports that median time to first token rose about 200 ms week over week, and the Recommended actions pane links to SageMaker AI to run inference recommendations.
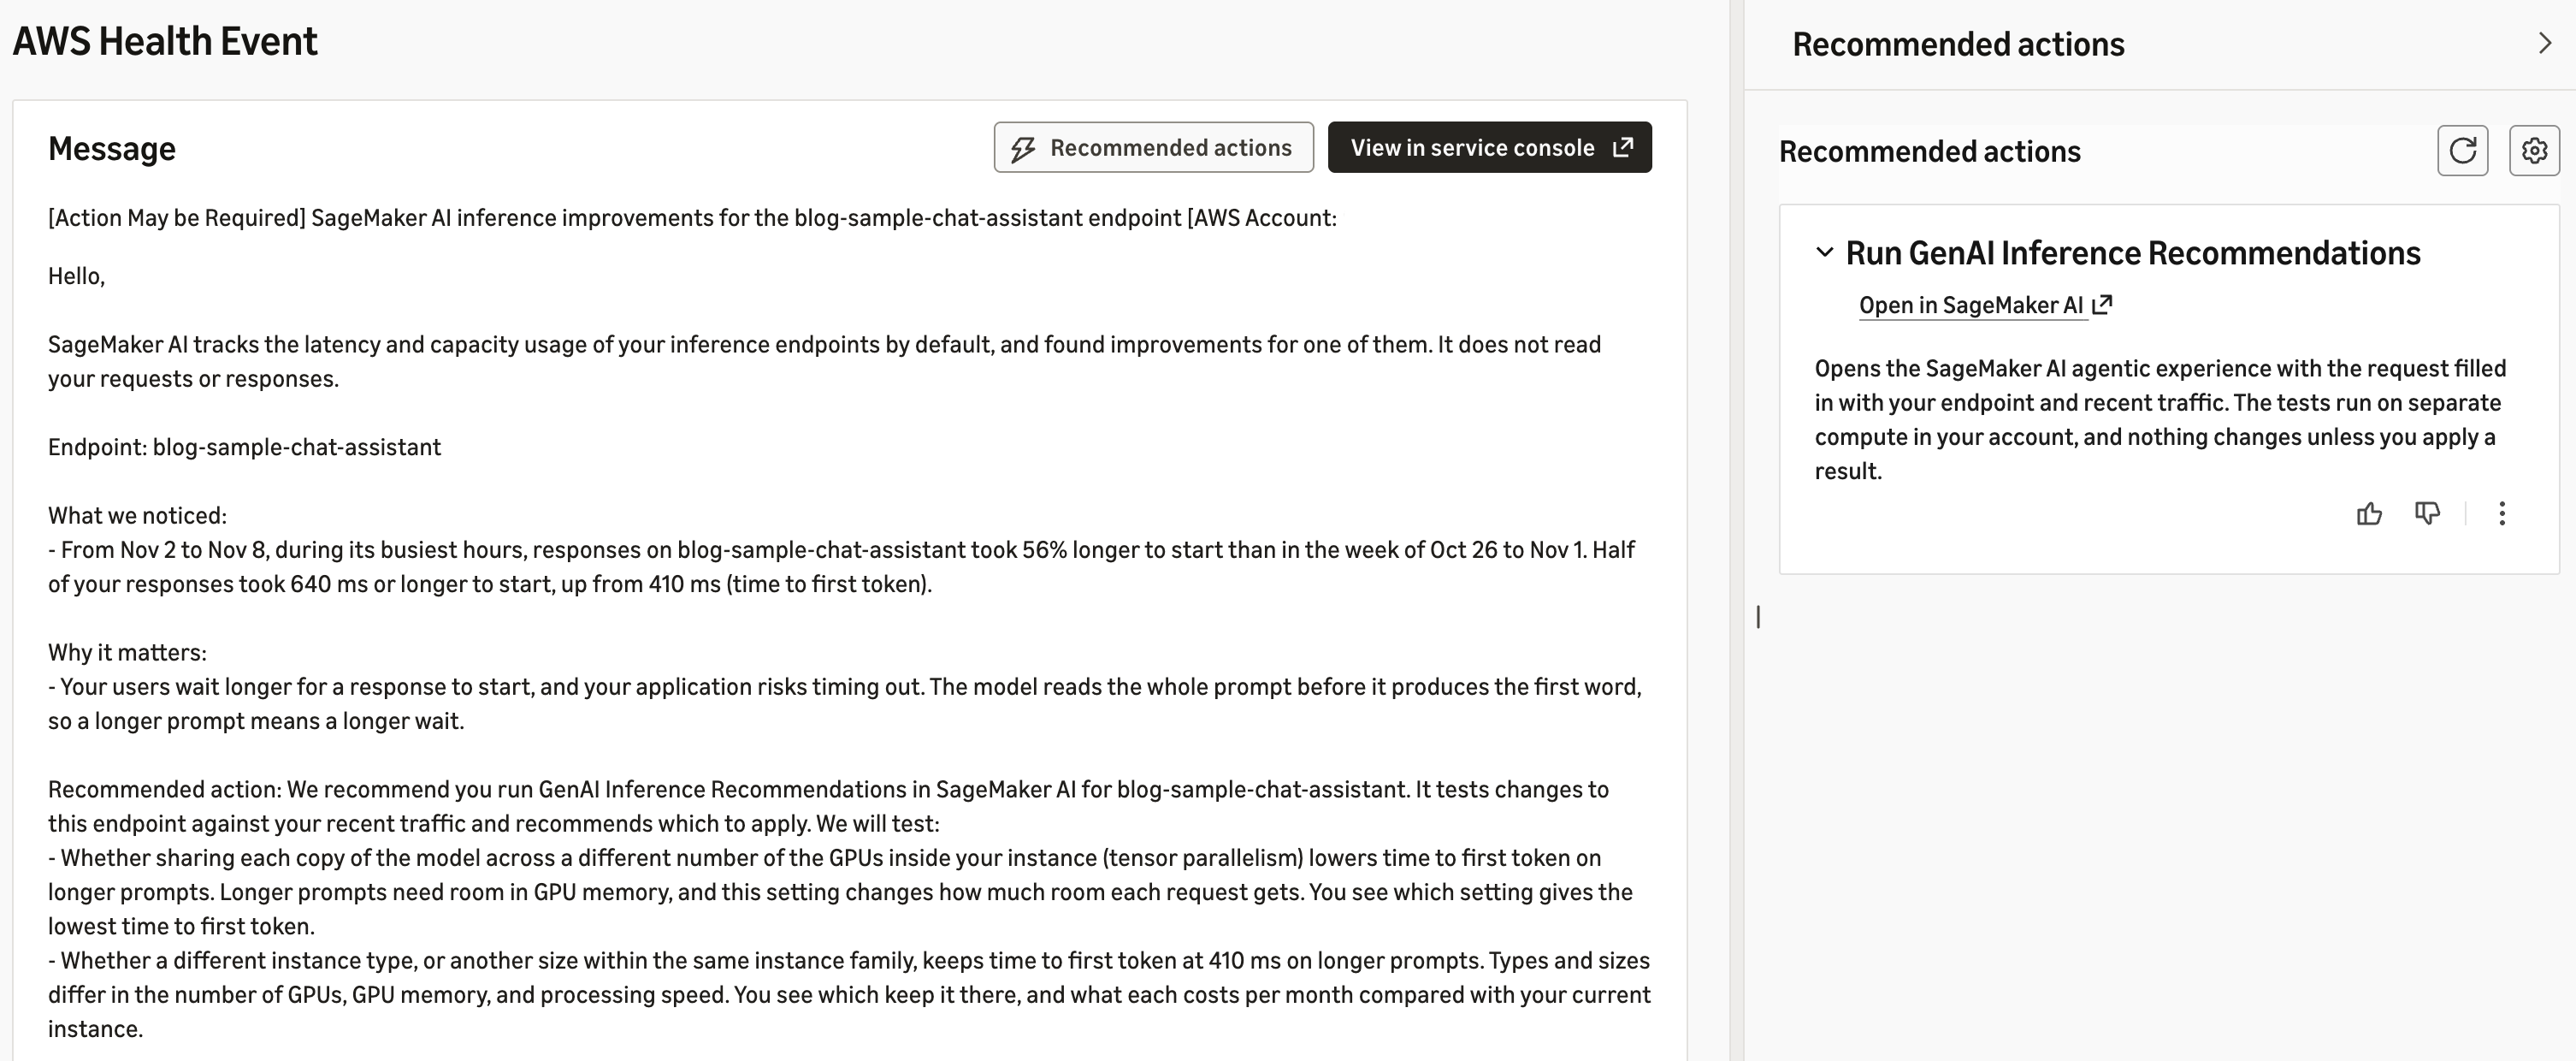
Figure 1: AWS Health event for a latency drift finding, with a link to run inference recommendations in SageMaker AI
Scenario 2: Turn on an optimization your traffic can benefit from
A platform team hosts an internal code-completion model on a SageMaker AI endpoint. They deployed it with default serving settings and never revisited them. The model and serving container support speculative decoding, a technique for faster responses, but it isn’t enabled. SageMaker AI flags this as an opportunity. Whether it helps depends on the endpoint’s traffic, such as how many requests run concurrently and how long prompts and responses are. The notification recommends running inference recommendations, which benchmarks speculative decoding against the endpoint’s recent traffic and shows whether it’s worth turning on.
- Notification: AWS Health reports that a technique designed to make responses faster is supported but not enabled.
- Studio session: The agentic experience opens with the endpoint configuration loaded.
- Benchmark: The session compares the current configuration with speculative decoding enabled. Results may differ at peak compared to off-peak traffic.
- Decision: If the gain holds at the traffic that matters, the team applies it. Otherwise, they keep the current configuration.
The following screenshot shows an AWS Health event for a speculative decoding finding. The message reports that the model and serving container support speculative decoding, but the endpoint doesn’t use it. The Recommended actions pane links to SageMaker AI to run inference recommendations.
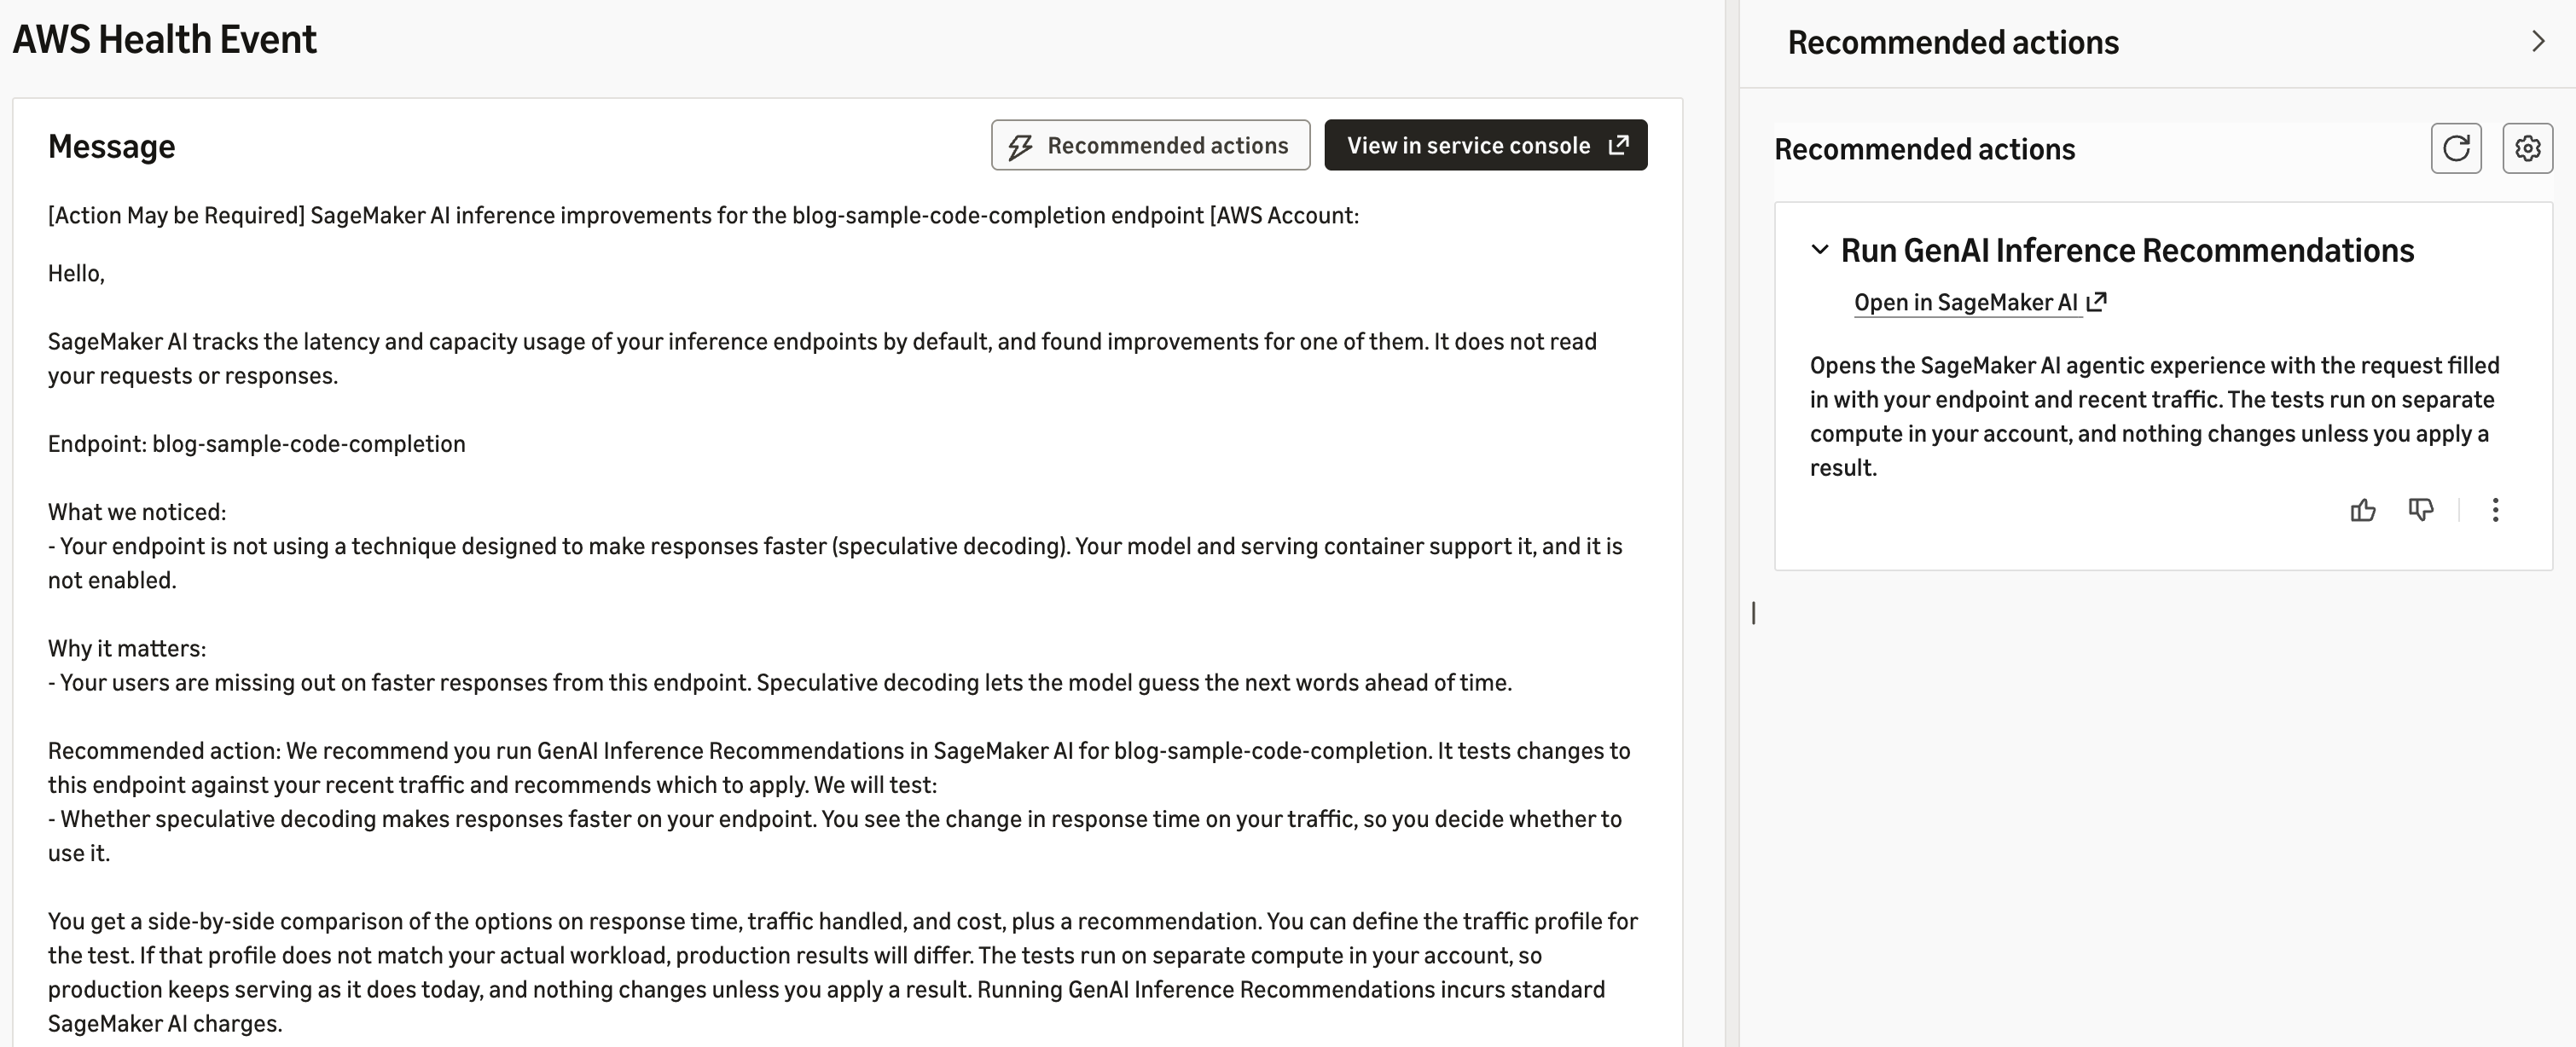
Figure 2: AWS Health event for a speculative decoding finding, with a link to run inference recommendations in SageMaker AI
The notification explains that speculative decoding can make responses faster, and that the benchmark compares response time with and without it on the endpoint’s recent traffic.
Scenario 3: Right-size underutilized GPUs
A summarization endpoint was sized for a launch that drew a fraction of the planned audience, so its GPUs sit mostly idle for a week. This scenario also shows a case where the right decision may be to make no change at all.
- Notification: AWS Health reports that the endpoint paid for GPU capacity that largely went unused.
- Studio session: The agentic experience opens with the endpoint and its observed peak traffic.
- Benchmark: The session tests cheaper instance types and smaller sizes at observed peak traffic.
- Decision: The team weighs the monthly savings against the headroom they want for planned growth and may decide to keep the current size.
The following screenshot shows an AWS Health event for an unused capacity finding. The message reports that for most of the week, even the endpoint’s busiest GPU used 12 percent or less of its capacity. The Recommended actions pane links to SageMaker AI to run inference recommendations.
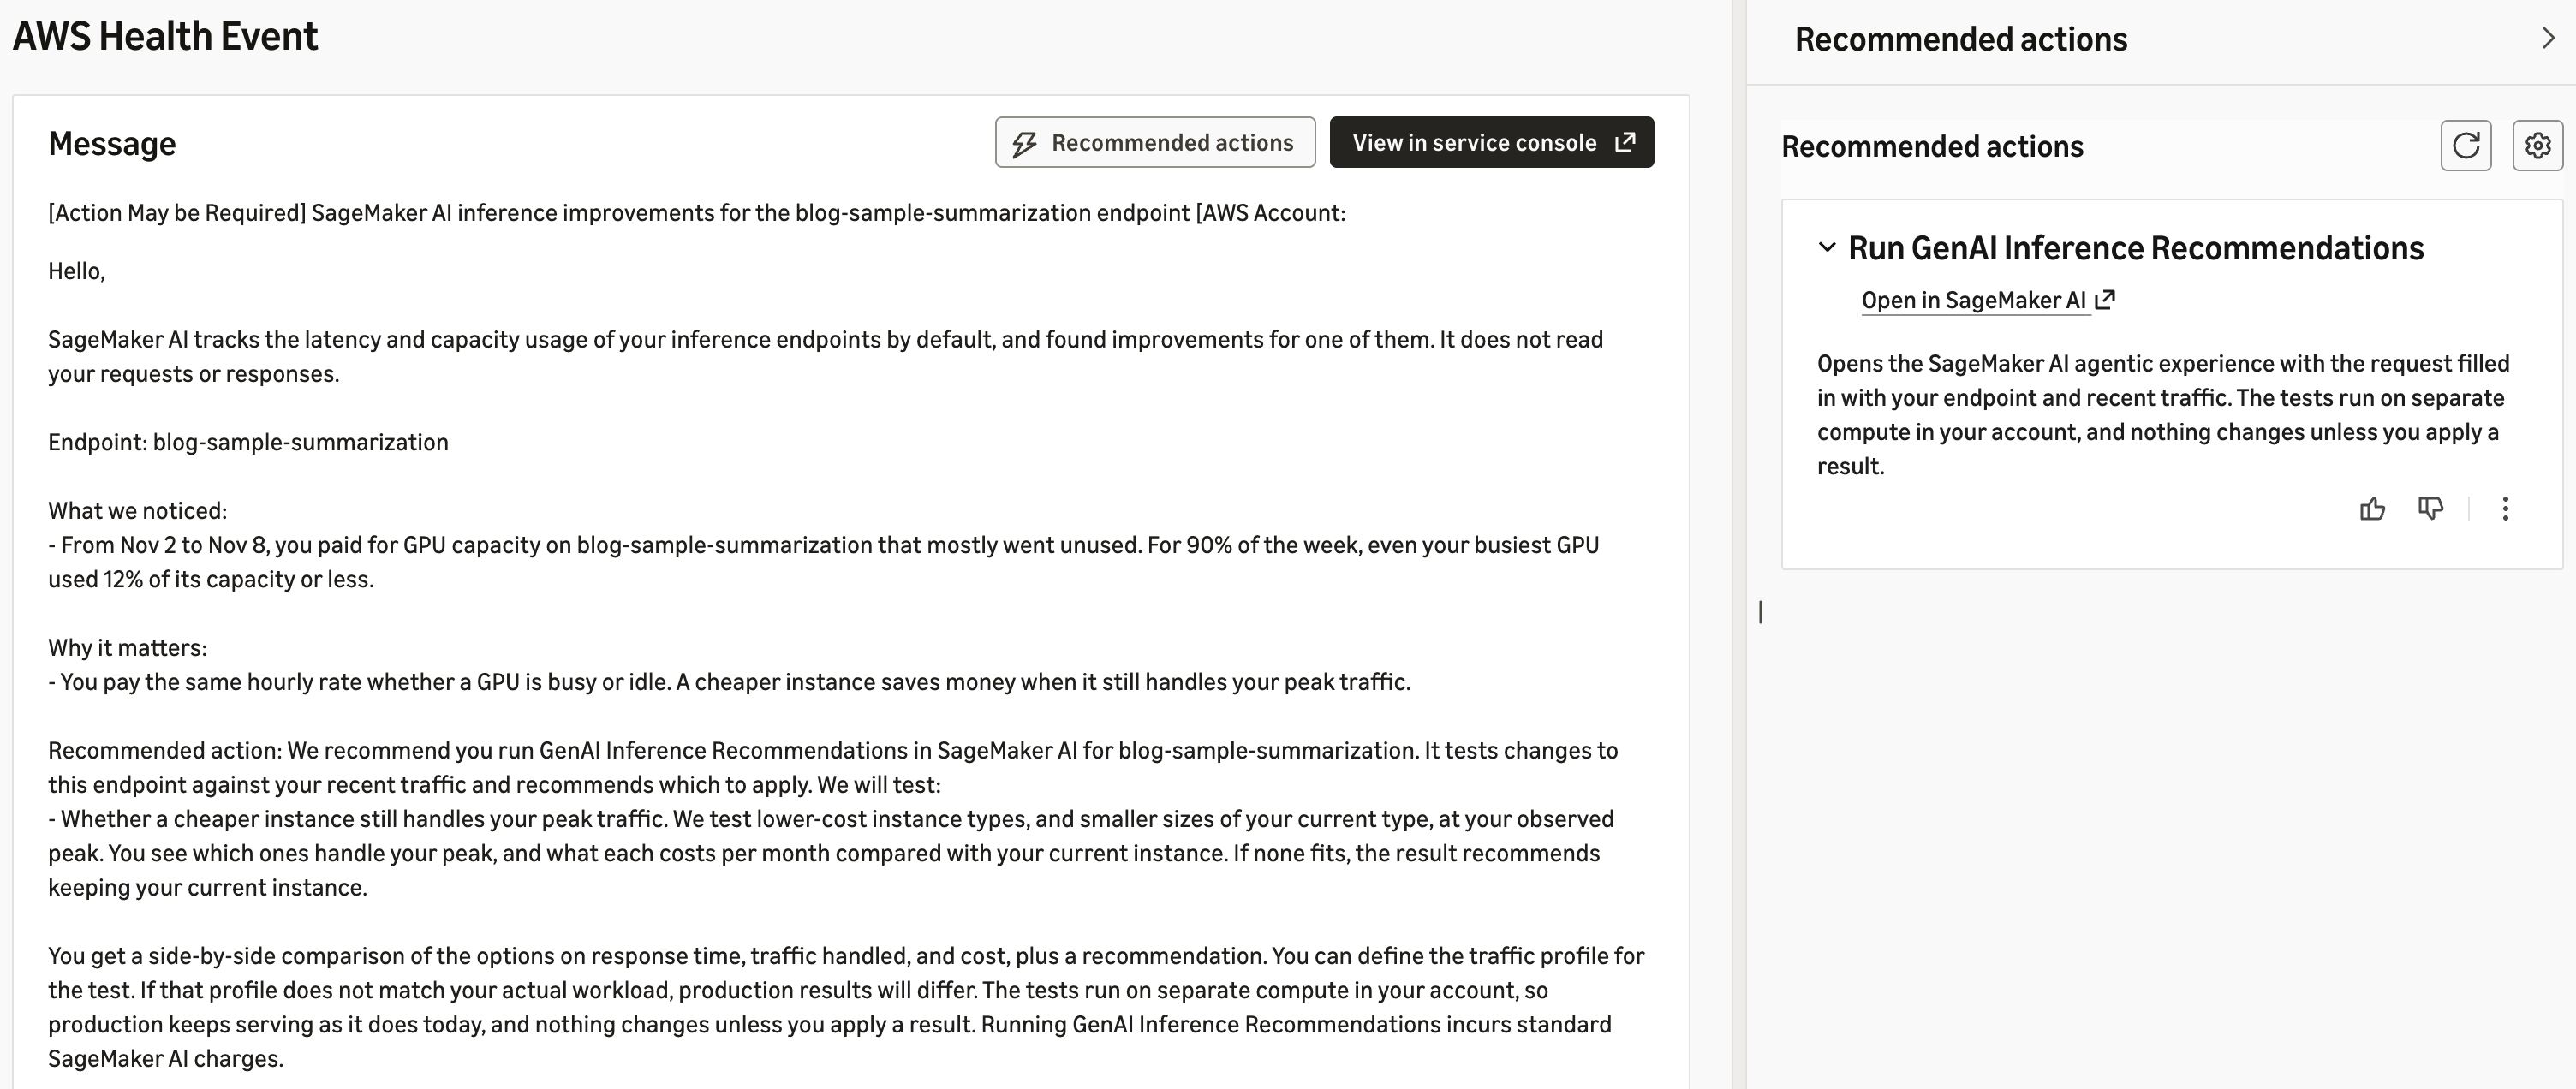
Figure 3: AWS Health event for an unused capacity finding, with a link to run inference recommendations in SageMaker AI
You can choose Open in SageMaker AI from the recommended actions as shown in the screenshot above to apply or dismiss a recommendation. Lets walk through this in next section.
Apply or dismiss a recommendation
You stay in control throughout, and nothing deploys automatically. When you choose Open in SageMaker AI from a notification’s recommended actions, Amazon SageMaker Studio opens a JupyterLab space and shows the prompt that will run in the agentic chat. The following screenshot shows the prompt for a latency drift finding on an endpoint that also runs an older vLLM serving container:
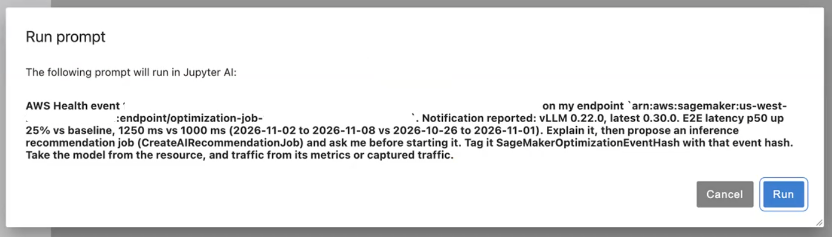
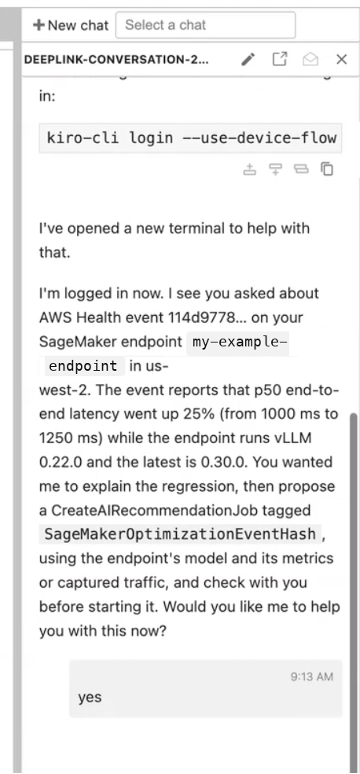
When you choose Run, the agentic experience opens in a chat panel in JupyterLab space in SageMaker Studio. It summarizes the finding in plain language, restates what you asked it to do, and checks with you before it takes any action. The following screenshot shows the agent summarizing the findings and asking to continue:
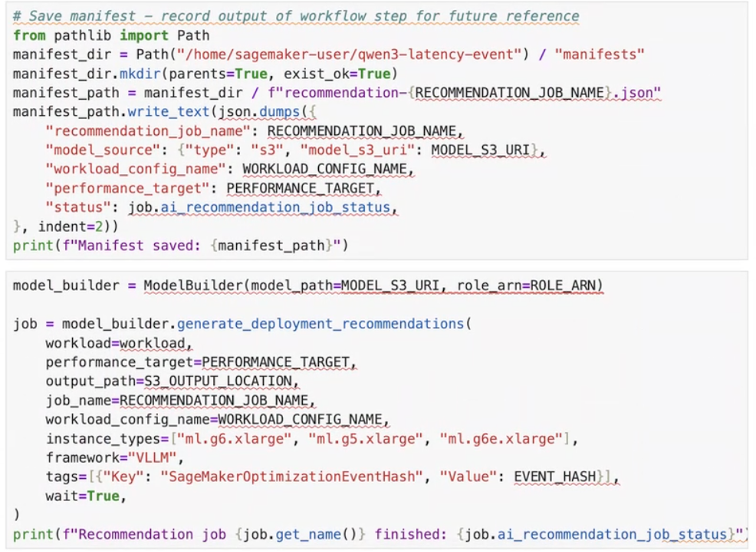
After you confirm, the agent generates a notebook that creates an inference recommendation job for the endpoint. The notebook uses the SageMaker Python SDK, takes the model from the endpoint and the traffic profile from its metrics, and tags the job with the AWS Health event so you can trace the results back to the finding. Each step is a separate notebook cell, so you can review or edit it before you run it.
The following screenshot shows the notebook cells that record the job details and start a recommendation job across three candidate instance types.
When the job completes, you can compare your current configuration with the alternatives on response time, throughput, and cost. When you are ready to act on a benchmarked result, we recommend a safe rollout pattern:
- Review the proposed change before applying it, including the configuration difference and the benchmarked latency, throughput, and cost.
- Apply to one production variant first and keep the current configuration available for rollback.
- Holding or dismissing a finding is a normal outcome. The notification stays in your AWS Health event history.
Manage monitoring and notifications
You can manage monitoring and how you are notified:
- Manage how you receive notifications in the AWS User Notifications console.
- Optionally, schedule recurring recommendations, for example monthly.
What is and is not collected: Monitoring reads aggregated latency and capacity telemetry at the endpoint level. It doesn’t read your request or response content, and it carries no GPU cost.
Opting out of monitoring: If you don’t want SageMaker AI to monitor an endpoint, set the OPT_OUT_TRACKING environment variable, with a value of your choice, on the model’s container. You set it in the Environment map when you call CreateModel, either on PrimaryContainer or on another container in the model.
If a container on the endpoint carries this variable, SageMaker AI collects no monitoring telemetry for that endpoint, including engine metrics, GPU metrics, and startup configuration details. As a result, it sends no notifications for that endpoint.
Clean up
To avoid ongoing charges, clean up the resources you created while following this post:
- Delete any test endpoints or resources you created for the walkthrough.
- Remove benchmark artifacts in Amazon Simple Storage Service (Amazon S3), if applicable.
- Revert any test configuration changes you applied.
Conclusion
With SageMaker AI inference recommendations now monitoring your endpoints automatically, optimization moves from a point-in-time snapshot to an ongoing signal.
Your endpoints keep telling you when they have drifted, when they are missing an improvement, or when they are paying for idle capacity. A single selection takes you to a benchmarked, side-by-side decision that you control.
For more information on how to get started, visit Amazon SageMaker AI and see the Amazon SageMaker AI documentation.