Artificial Intelligence
Introducing enhanced infrastructure observability in Amazon SageMaker HyperPod
Large-scale model training is one of the most expensive workloads you can run on GPUs, and a single unhealthy accelerator can stall an entire distributed job. When training throughput drops, the hard part is rarely noticing that something is wrong. It is figuring out why and where. Teams often spend hours or days sifting through logs and disconnected dashboards to decide whether a slowdown came from a throttled GPU, a saturated network link, or a stalled data pipeline on the host.
Today, we are announcing enhanced observability in Amazon SageMaker HyperPod, a new capability that helps you diagnose GPU training issues faster. It brings together diagnostic and profiling capabilities for training workloads that run on both Amazon Elastic Kubernetes Service (Amazon EKS) and Slurm orchestrators:
Diagnostic summary uses Amazon CloudWatch’s DetectGroupOutliers API to compare each GPU in a training job on utilization, memory, temperature, power, and SM clock, and flags GPUs that deviate from their peers. Static diagnostic rules surface common failure patterns such as GPU hardware faults (XID errors, ECC memory errors), EFA throughput drops, thermal throttling, and overheating, so you catch degradation before it affects training.
Why you need it
Distributed training is expensive, and small inefficiencies compound into significant wasted GPU hours. Until now, getting visibility into HyperPod infrastructure meant stitching together separate tools, and even then, the metrics told you that performance had degraded without telling you why.
Enhanced observability closes three gaps. It isolates a single bad accelerator across hundreds or thousands of GPUs whether through XID errors, ECC memory faults, or thermal throttling, so you spend time on the fix instead of the search.
Together, these capabilities reduce troubleshooting time and help you keep expensive accelerators busy.
How it works
Each capability targets a different layer of a distributed training job.
Default and advanced metrics
Enhanced observability collects telemetry at two levels:
Default metrics (enabled automatically) cover cluster health, CPU/disk/OS-level usage, GPU utilization and temperature, and per-job resource utilization. These metrics are collected every 30 seconds and sent to your chosen metric store with approximately 1–2% CPU overhead and 250–300 MB of memory.
Advanced metrics (opt-in) provide deeper visibility:
- Full node exporter suite: comprehensive host-level metrics.
- All NVIDIA GPU DCGM and AWS Neuron metrics: detailed accelerator telemetry including clock speeds, power, PCIe activity, and error indicators.
- Elastic Fabric Adapter (EFA) metrics: network interface throughput, drops, retransmissions, and errors.
Advanced metrics are optional because they increase the volume of telemetry sent to your metric store, which has a cost implication. Most customers running small jobs on small clusters may not need them, but they are essential for long-running training jobs on large clusters where patterns emerge over time.
Metric stores
You can choose between two metric stores:
- Amazon CloudWatch (new default) provides native monitoring through CloudWatch SageMaker Insights, so you can visualize metrics without leaving the AWS Management Console.
- Amazon Managed Service for Prometheus for teams that standardize on Prometheus and Grafana for observability.
Previously, only Prometheus was supported. CloudWatch is now the default, offering lower pricing compared to Amazon Managed Service Prometheus and tighter integration with the SageMaker console.
Diagnostic summary
The diagnostic summary uses two complementary approaches to surface issues across your HyperPod cluster.
GPU outlier detection uses CloudWatch’s DetectGroupOutliers API to compare GPUs within a training job across utilization, memory usage, temperature, power draw, and SM clock frequency. When a GPU deviates significantly from its peers, it appears as an outlier card in the diagnostic summary. This works for both EKS and Slurm jobs.
Static diagnostic rules evaluate known failure patterns and organize detected issues by type:
- Hardware: GPU ECC memory errors, XID faults, accelerator failures.
- Network: EFA throughput degradation, packet drops, retransmissions.
- Throttling: GPU clock throttling because of heat, board, or reliability limits.
- Overheating: GPU temperatures exceeding configured limits.
Each detected issue identifies the affected job, cluster, node, accelerator, and rank.
How to get started
Enhanced observability is delivered as an add-on for EKS-orchestrated clusters and as an extension for Slurm-orchestrated clusters, which means you control who can install or change it through AWS Identity and Access Management (IAM).
Step 1: Create a SageMaker HyperPod cluster
If you already have a cluster, you can use it. To create a new SageMaker HyperPod cluster, you can follow the step-by-step outline. In general, the steps are as follows:
- On the Amazon SageMaker AI console, choose HyperPod clusters in the navigation pane.
- Choose Create HyperPod cluster and Orchestrated on Amazon EKS or Orchestrated by Slurm.
- For Setup options, select Custom setup.
- For Name, enter a name.
- For Instance recovery, select Automatic.
- Choose Submit.
The following screenshot shows the Create HyperPod cluster page.
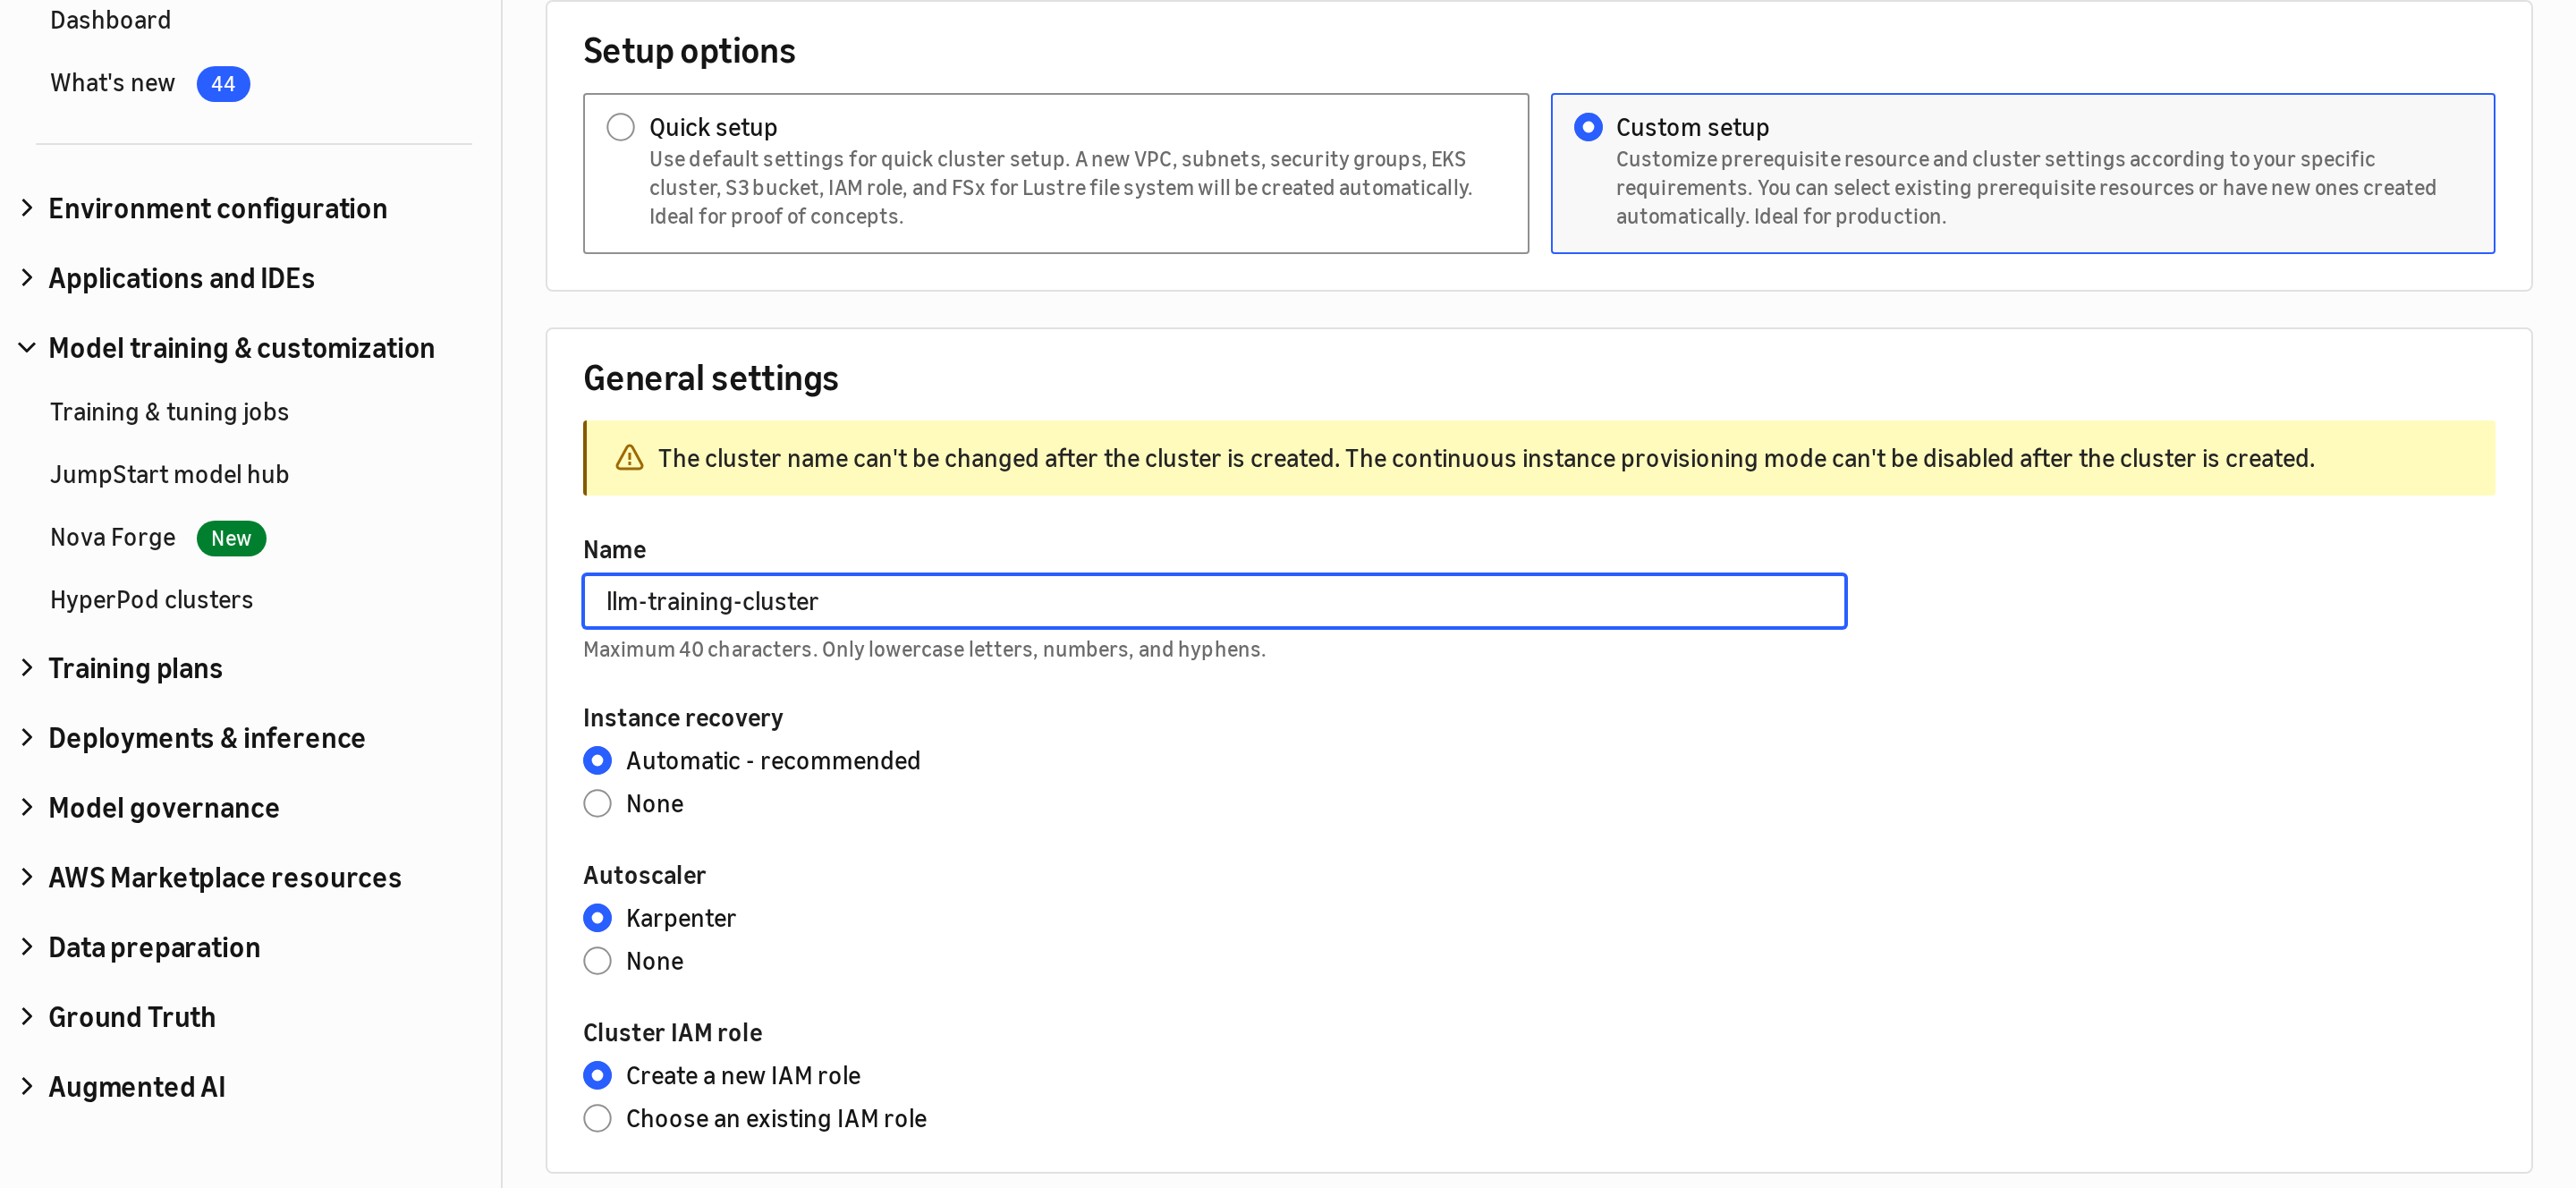
Figure 1: Creating a HyperPod cluster on Amazon EKS with Custom setup
Step 2: Configure HyperPod observability
In the Custom setup workflow, expand the HyperPod observability section:
- Enable HyperPod Observability is checked by default. Uncheck only if you do not want observability.
- Observability metrics show default metrics (cluster health, CPU/disk/OS, GPU utilization/temperature, per-job resources) plus optional advanced metrics.
- Select advanced metrics as needed: Full node exporter suite, All NVIDIA GPU DCGM/Neuron metrics and EFA metrics.
- Enable logging to create CloudWatch log groups for containers and pod logs.
- For Metric store, choose Amazon CloudWatch (default) or Amazon Managed Service for Prometheus.
- For Grafana workspace, choose to create a new workspace, use an existing one, or select None.
- Configure IAM roles or let the console create them automatically.
The following figure shows the configuration options for HyperPod observability in the custom setup path:
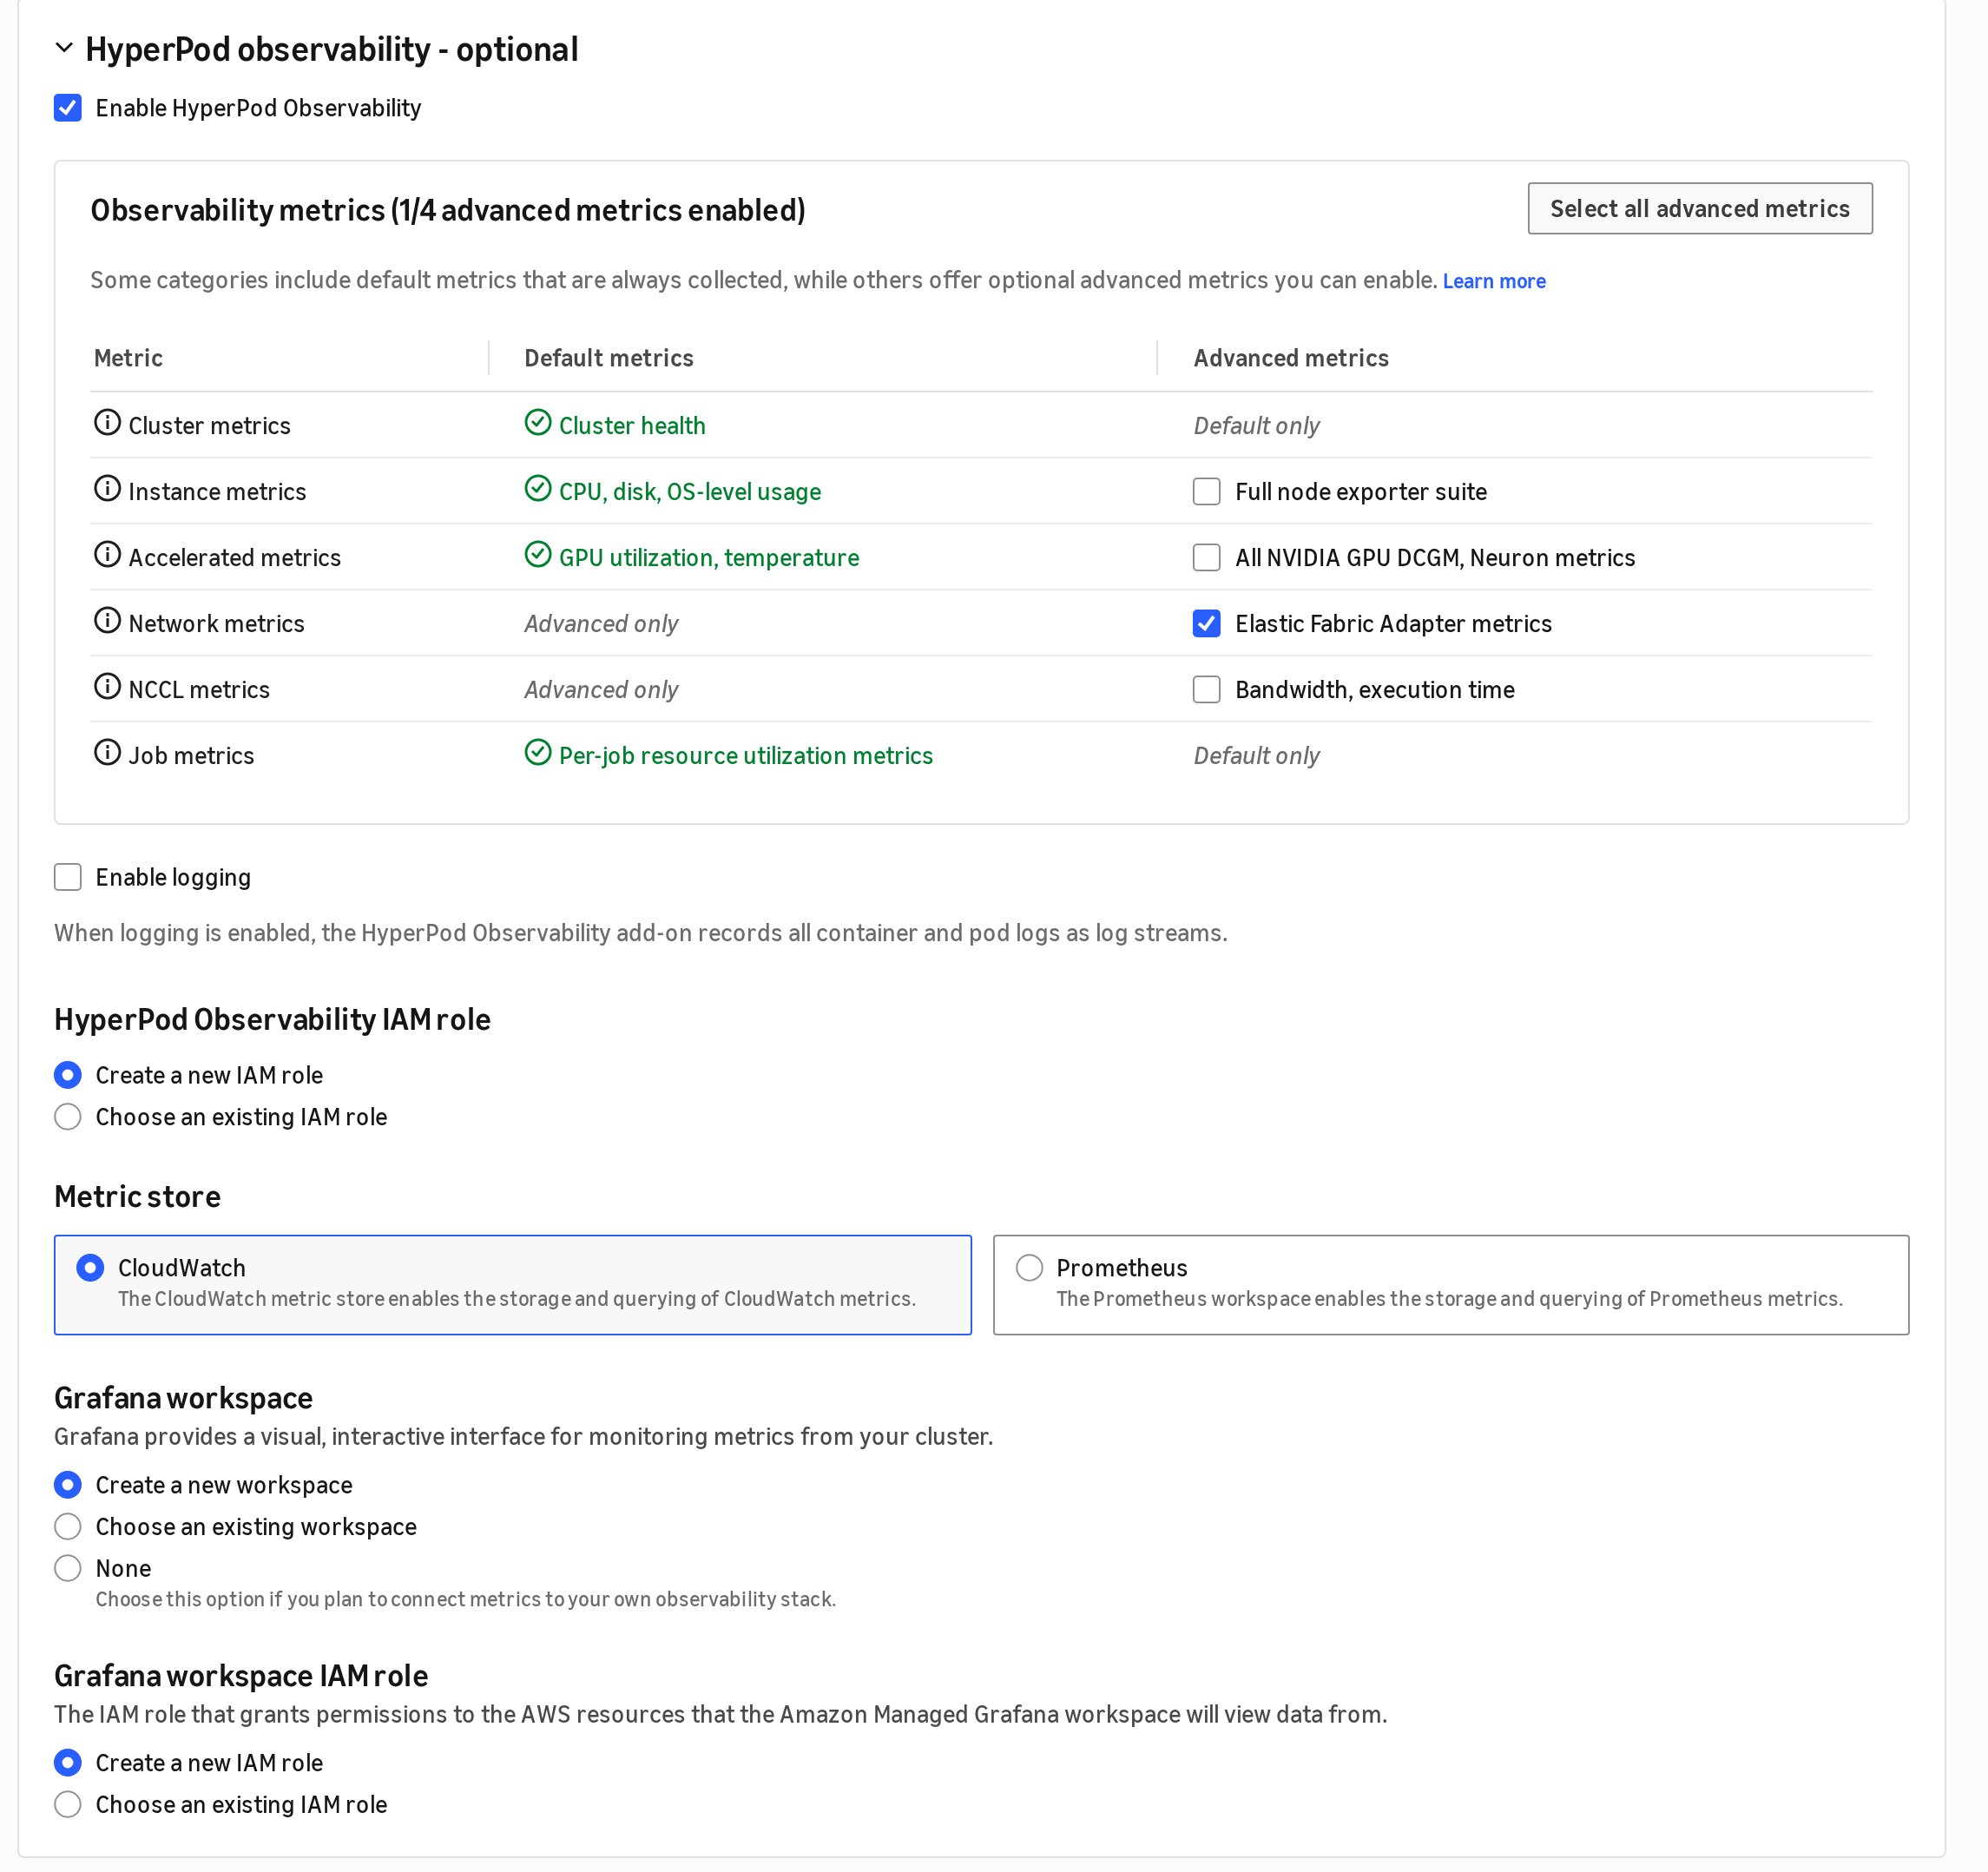
Figure 2: The HyperPod observability section showing default and advanced metrics, metric store (CloudWatch or Prometheus), and Grafana workspace
Note: In Quick setup, HyperPod observability is enabled by default and cannot be unchecked. Custom setup gives you control over which metric categories and advanced metrics to enable.
Step 3: Install the observability add-on using the CLI (alternative, EKS)
You can install the HyperPod observability add-on (EKS) or extension (Slurm) from the AWS Management Console or through the API. Alternatively, you can install the add-on with the AWS Command Line Interface (AWS CLI).
The following command creates the add-on, enables the basic metric categories and leaves the opt-in profiling capabilities off:
Verify the add-on is ACTIVE:
The following figure shows the observability add-on on the cluster’s Add-ons tab.
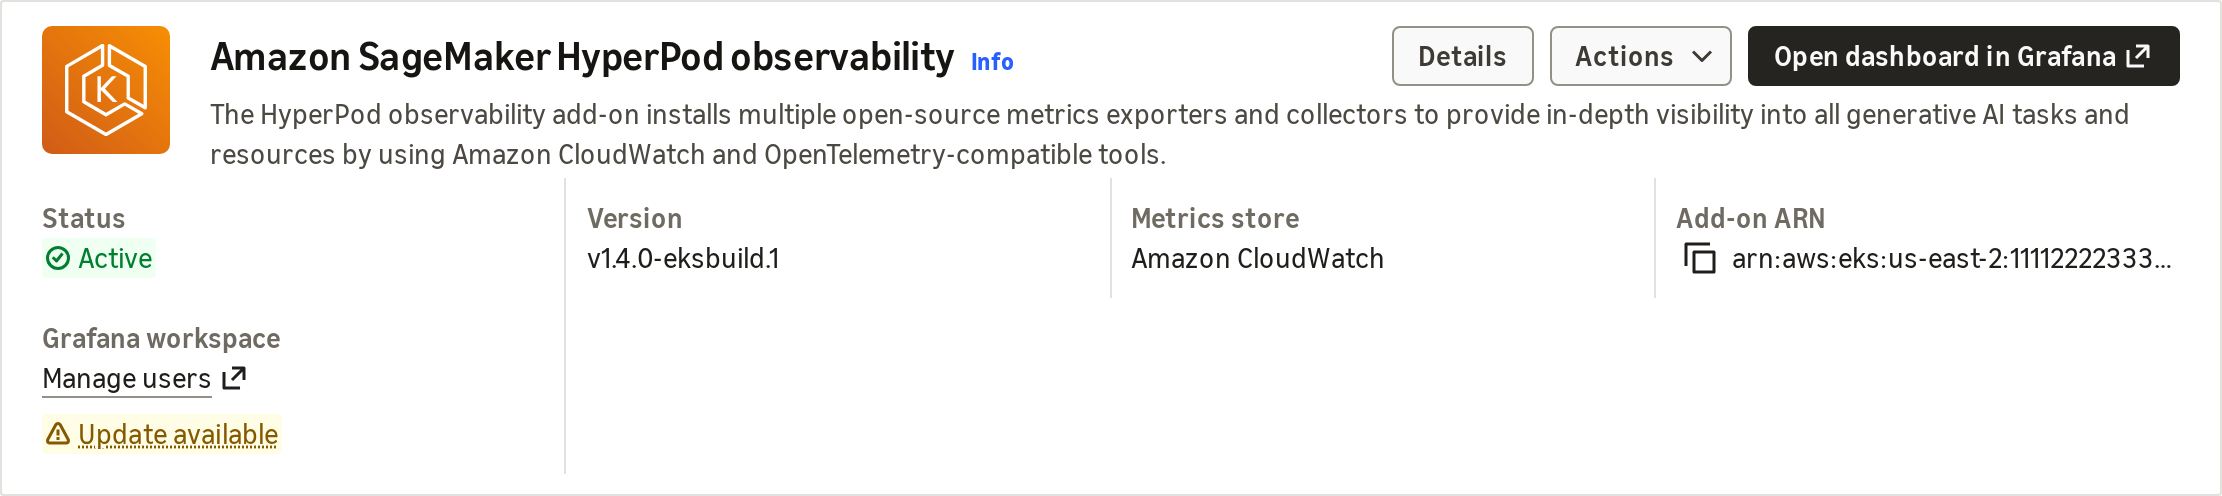
Figure 3: The observability add-on on the cluster’s Add-ons tab, active and sending metrics to Amazon CloudWatch
Step 4: Enable metrics (EKS)
You can enable or disable any metric category or profiling capability at any time. For an EKS cluster, update the add-on configuration with the AWS Command Line Interface (AWS CLI). The following command turns on advanced network (EFA) metrics:
From the console, choose Actions, then Edit on the add-on card to make the same changes. The following figure shows the Actions button.
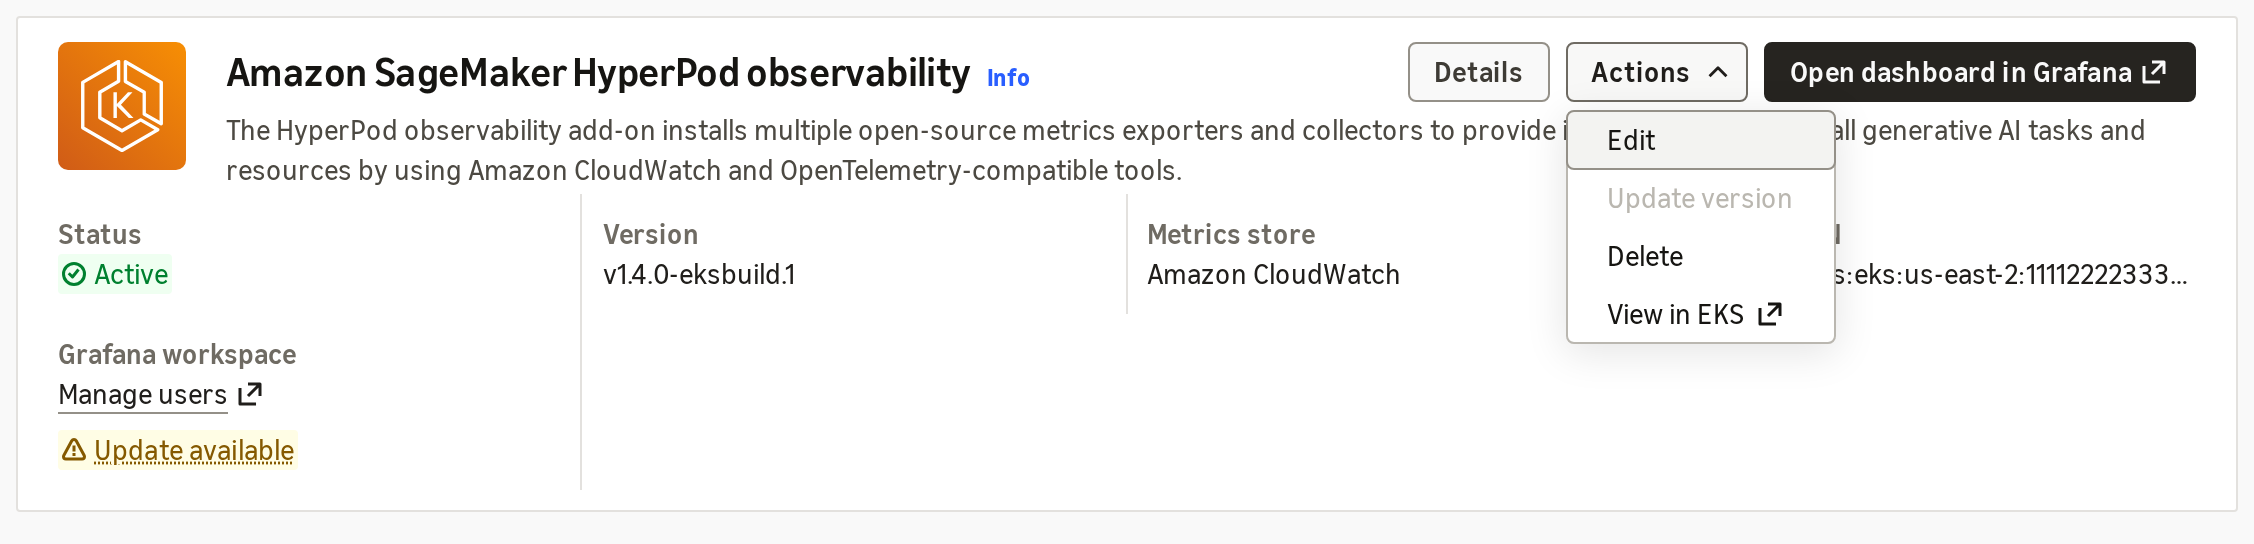
Figure 4: Use Actions → Edit to enable or disable metric categories and profiling
Slurm clusters: install or edit the observability extension
On Slurm-orchestrated clusters, HyperPod observability is a cluster extension. From the cluster detail page, open the Extensions tab. If the extension is installed, choose Actions, then Edit. The following figure shows the observability extension on a Slurm cluster’s Extensions tab.
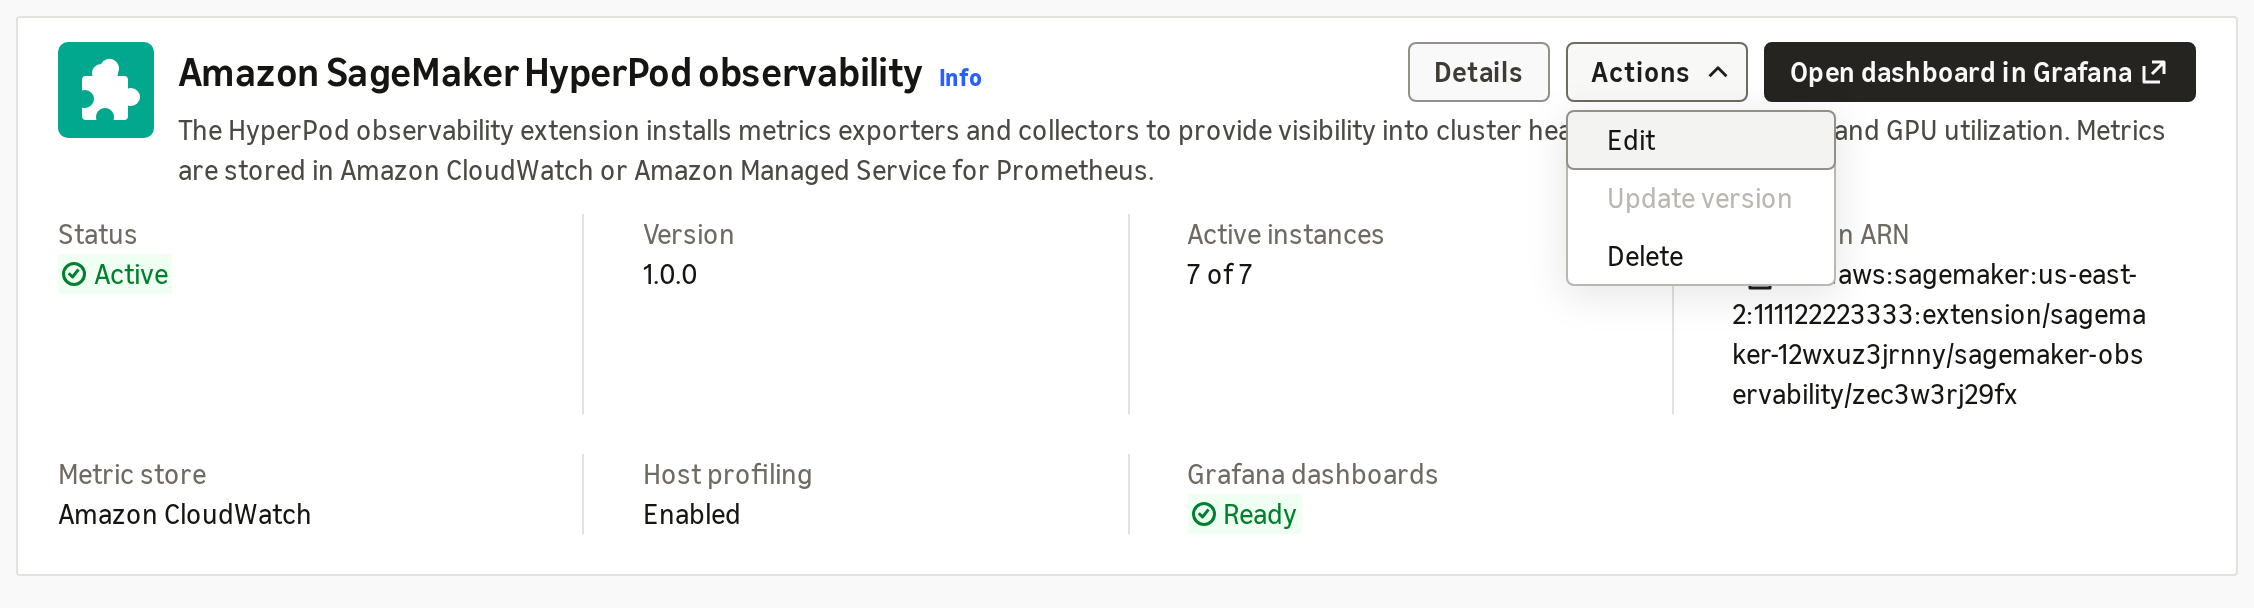
Figure 5: The observability extension on a Slurm cluster’s Extensions tab, with Actions → Edit
The edit page sets a collection level for each metric category.
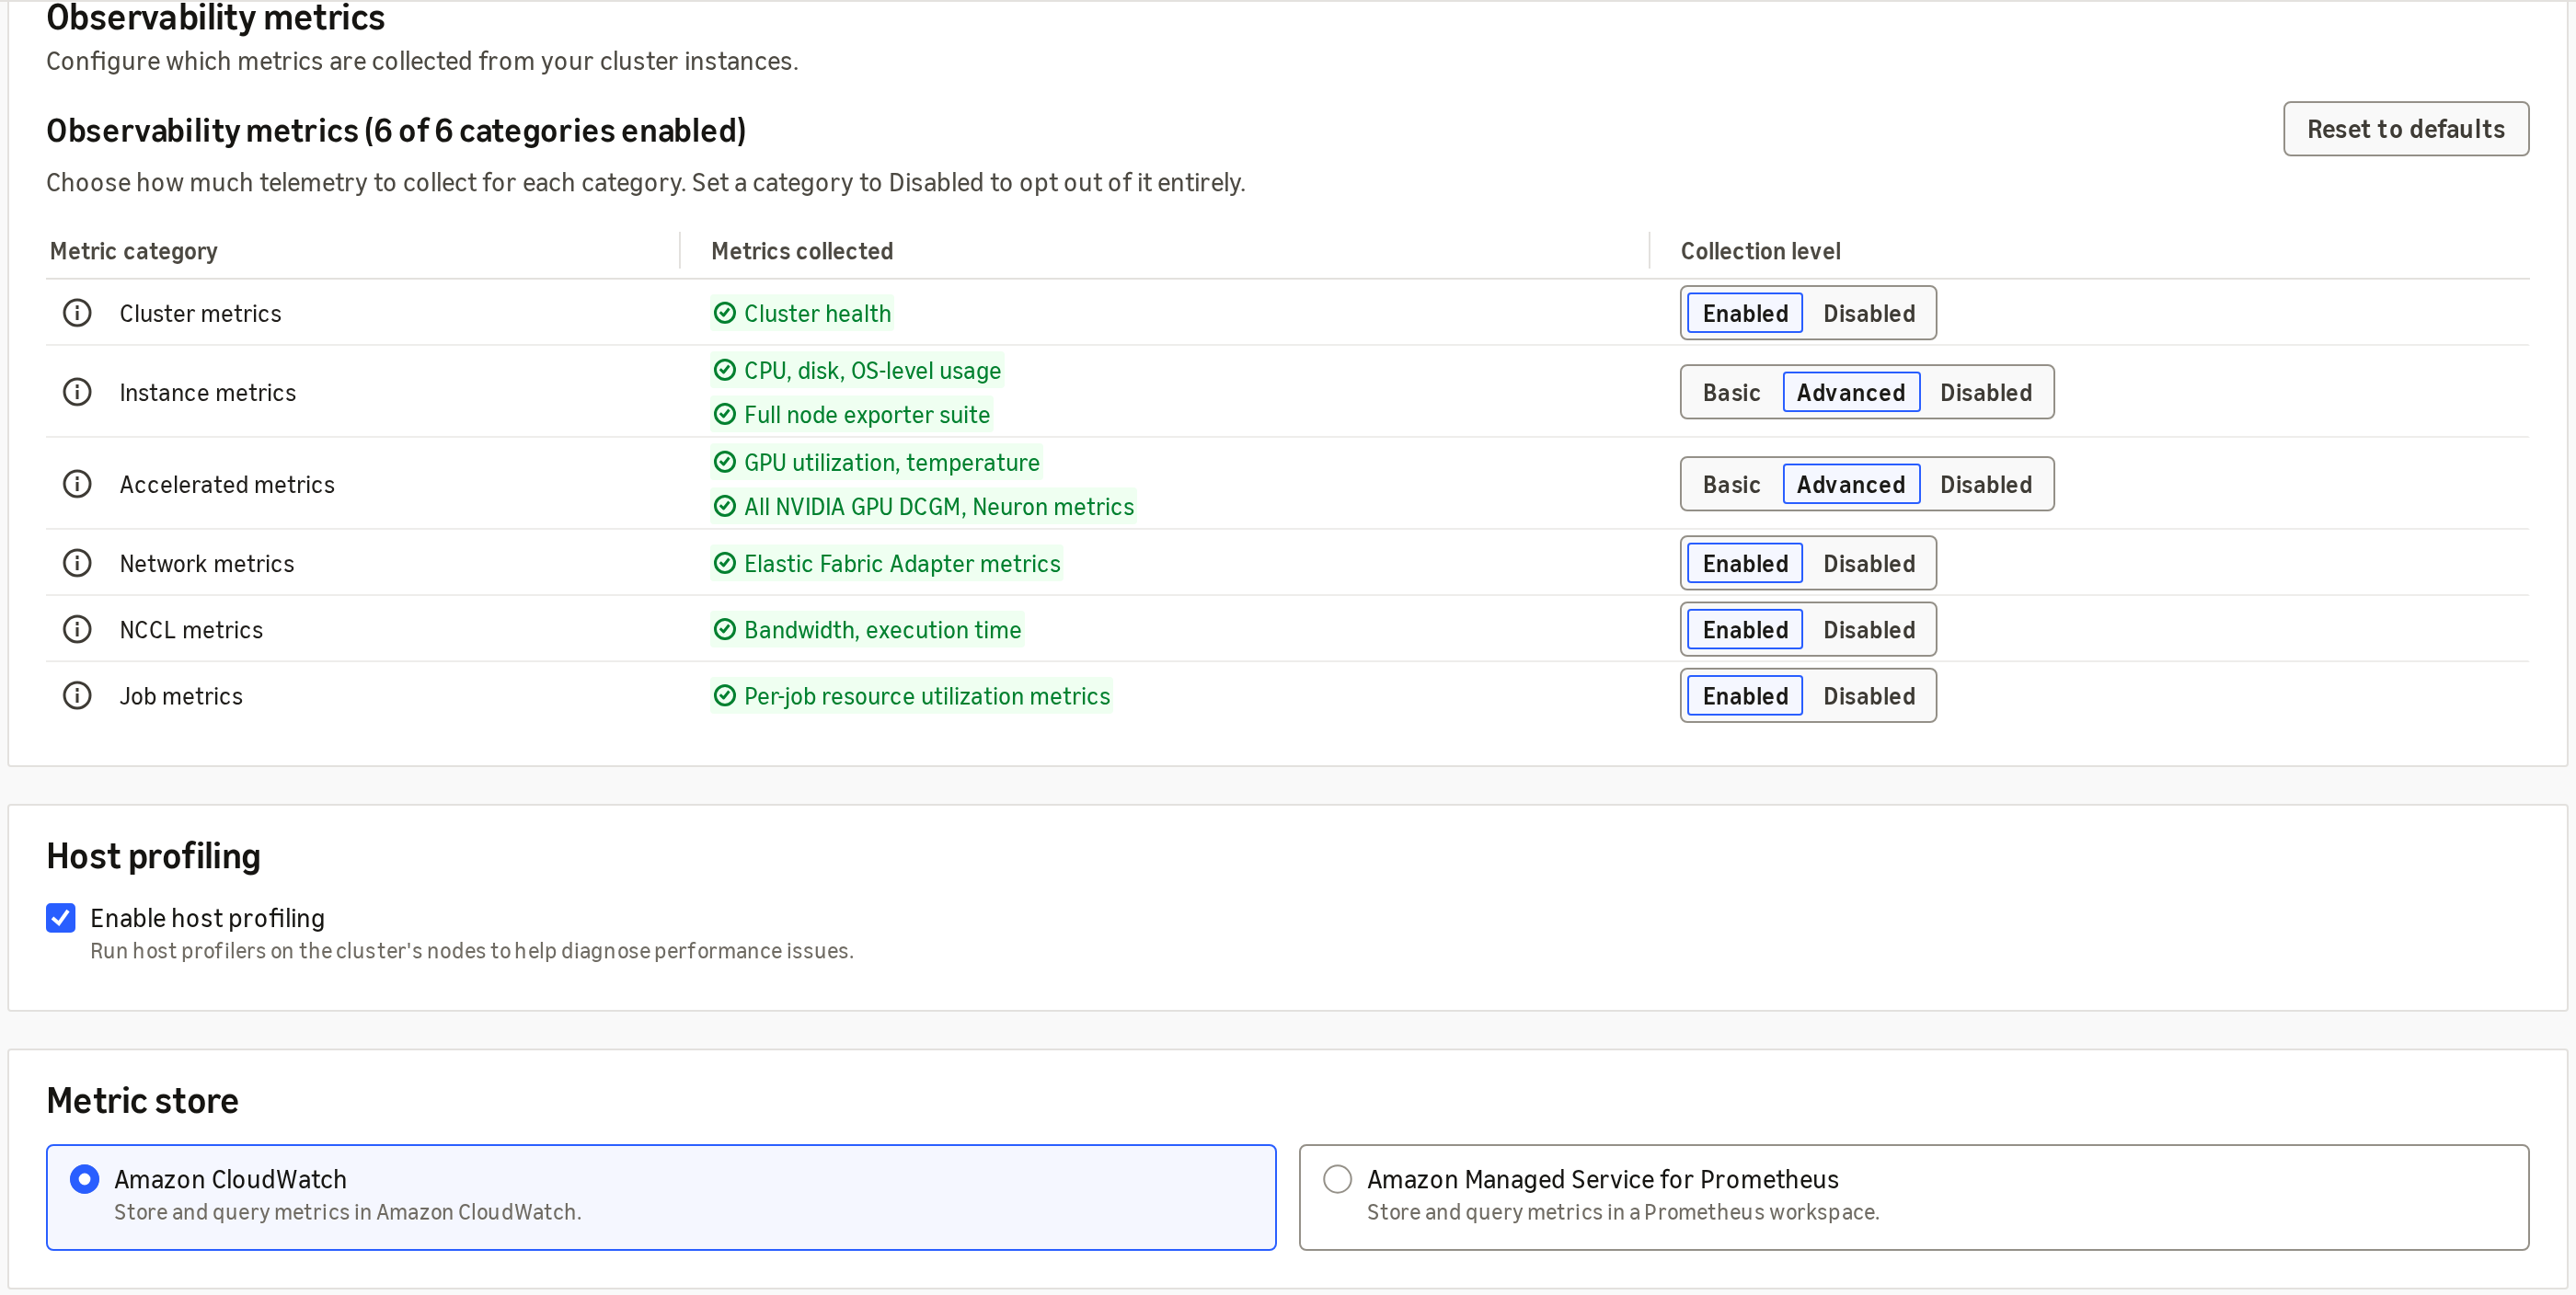
Figure 6: Editing observability on a Slurm cluster: metric categories, host profiling, and the metric store
To install the extension with the AWS CLI instead:
To turn on EFA metrics, update the extension:
Check the status with aws sagemaker describe-cluster-extension --cluster-arn <cluster-arn> --extension-arn <extension-arn>.
Step 5: Confirm metrics are streaming
After the cluster is ready, navigate to the cluster’s detail page. The new Observability tab displays an overview with:
- Nodes: total node count (for example, 128).
- Accelerators: total GPU/accelerator count (for example, 1024).
- Jobs: active and recent training job count.
- Avg. GPU utilization: fleet-wide average (for example, 87.3%).
- Avg. vCPU utilization: fleet-wide average (for example, 76.8%).
- Avg. memory utilization: fleet-wide average (for example, 83.5%).
The following image shows the Cluster Observability tab with overview metrics, active and recent training jobs, and active issues:
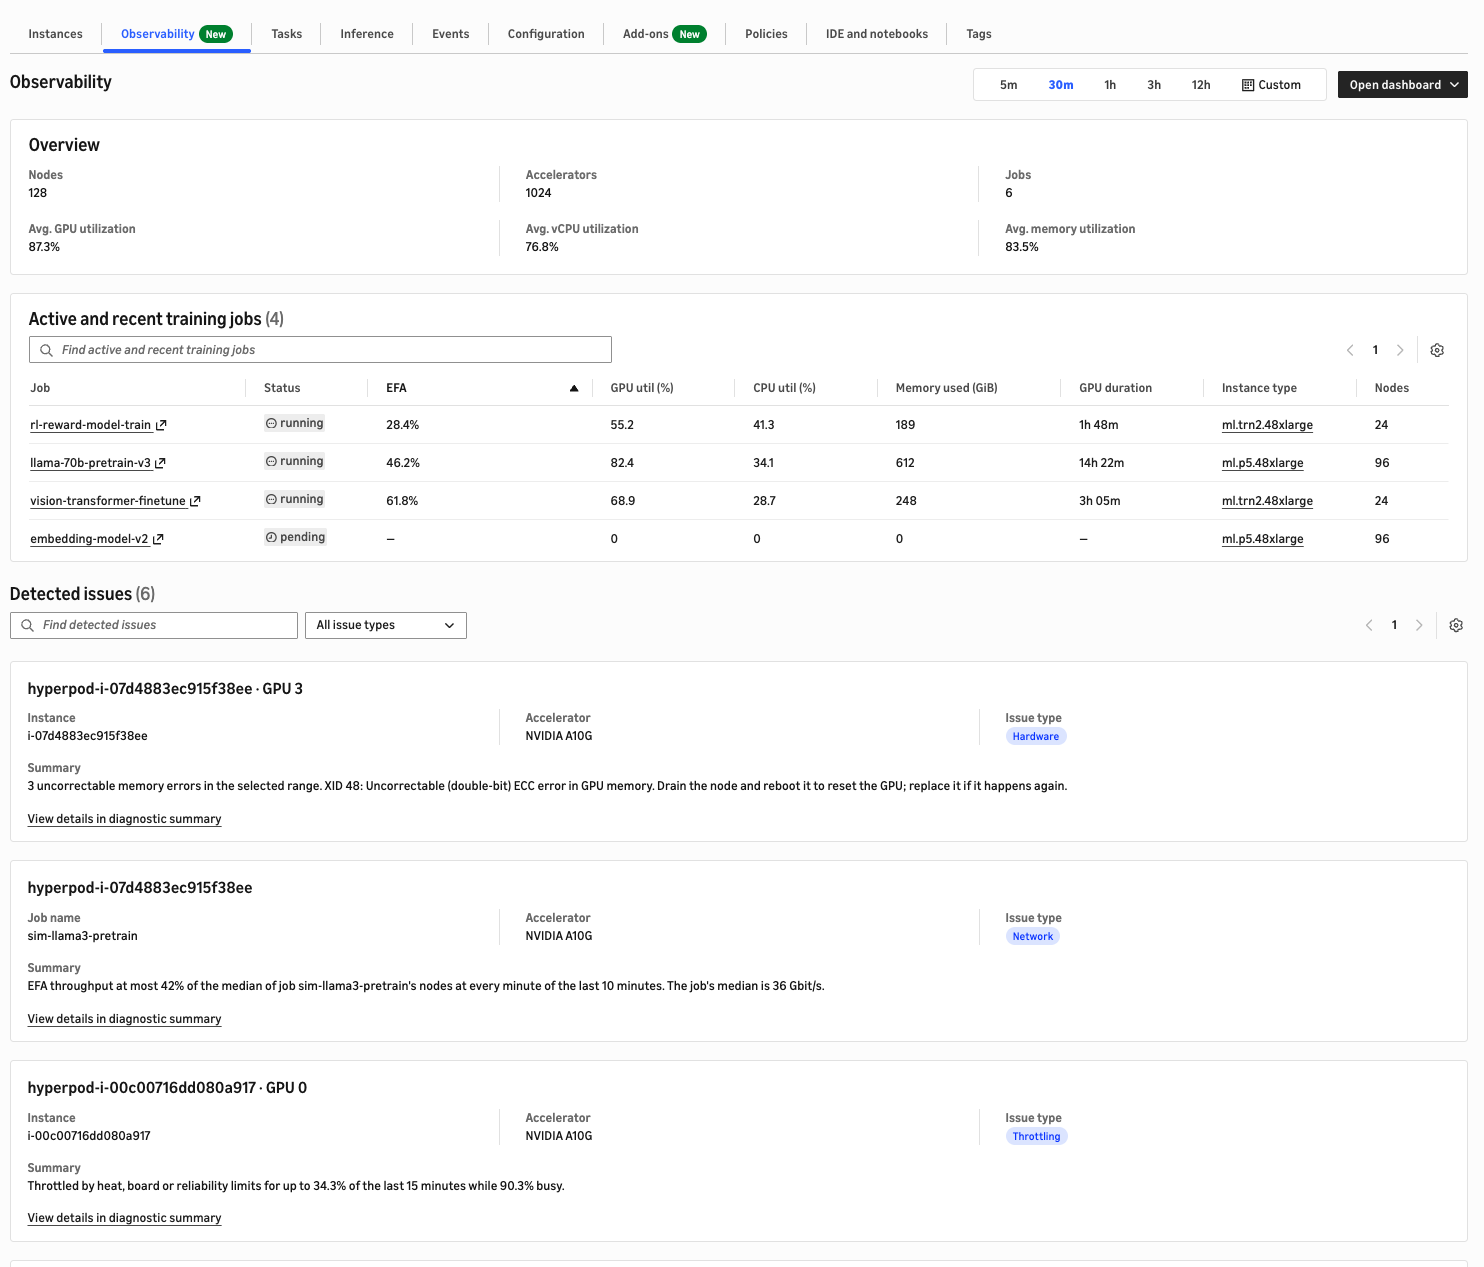
Figure 7: The new Observability tab — fleet overview, active training jobs, and detected issues
CloudWatch dashboard
From the Observability tab, choose Open dashboard to navigate to the CloudWatch SageMaker Insights experience. The dashboard provides several views:
Diagnostic summary
The Diagnostic summary shows incidents detected across your HyperPod clusters. Pinpoint the root cause whether it is a hardware fault, a network issue, throttling, or overheating.
Choose any incident card to see more details. Each card names the affected job, cluster, accelerator, and rank.
The following screenshot shows the Diagnostic summary tab:
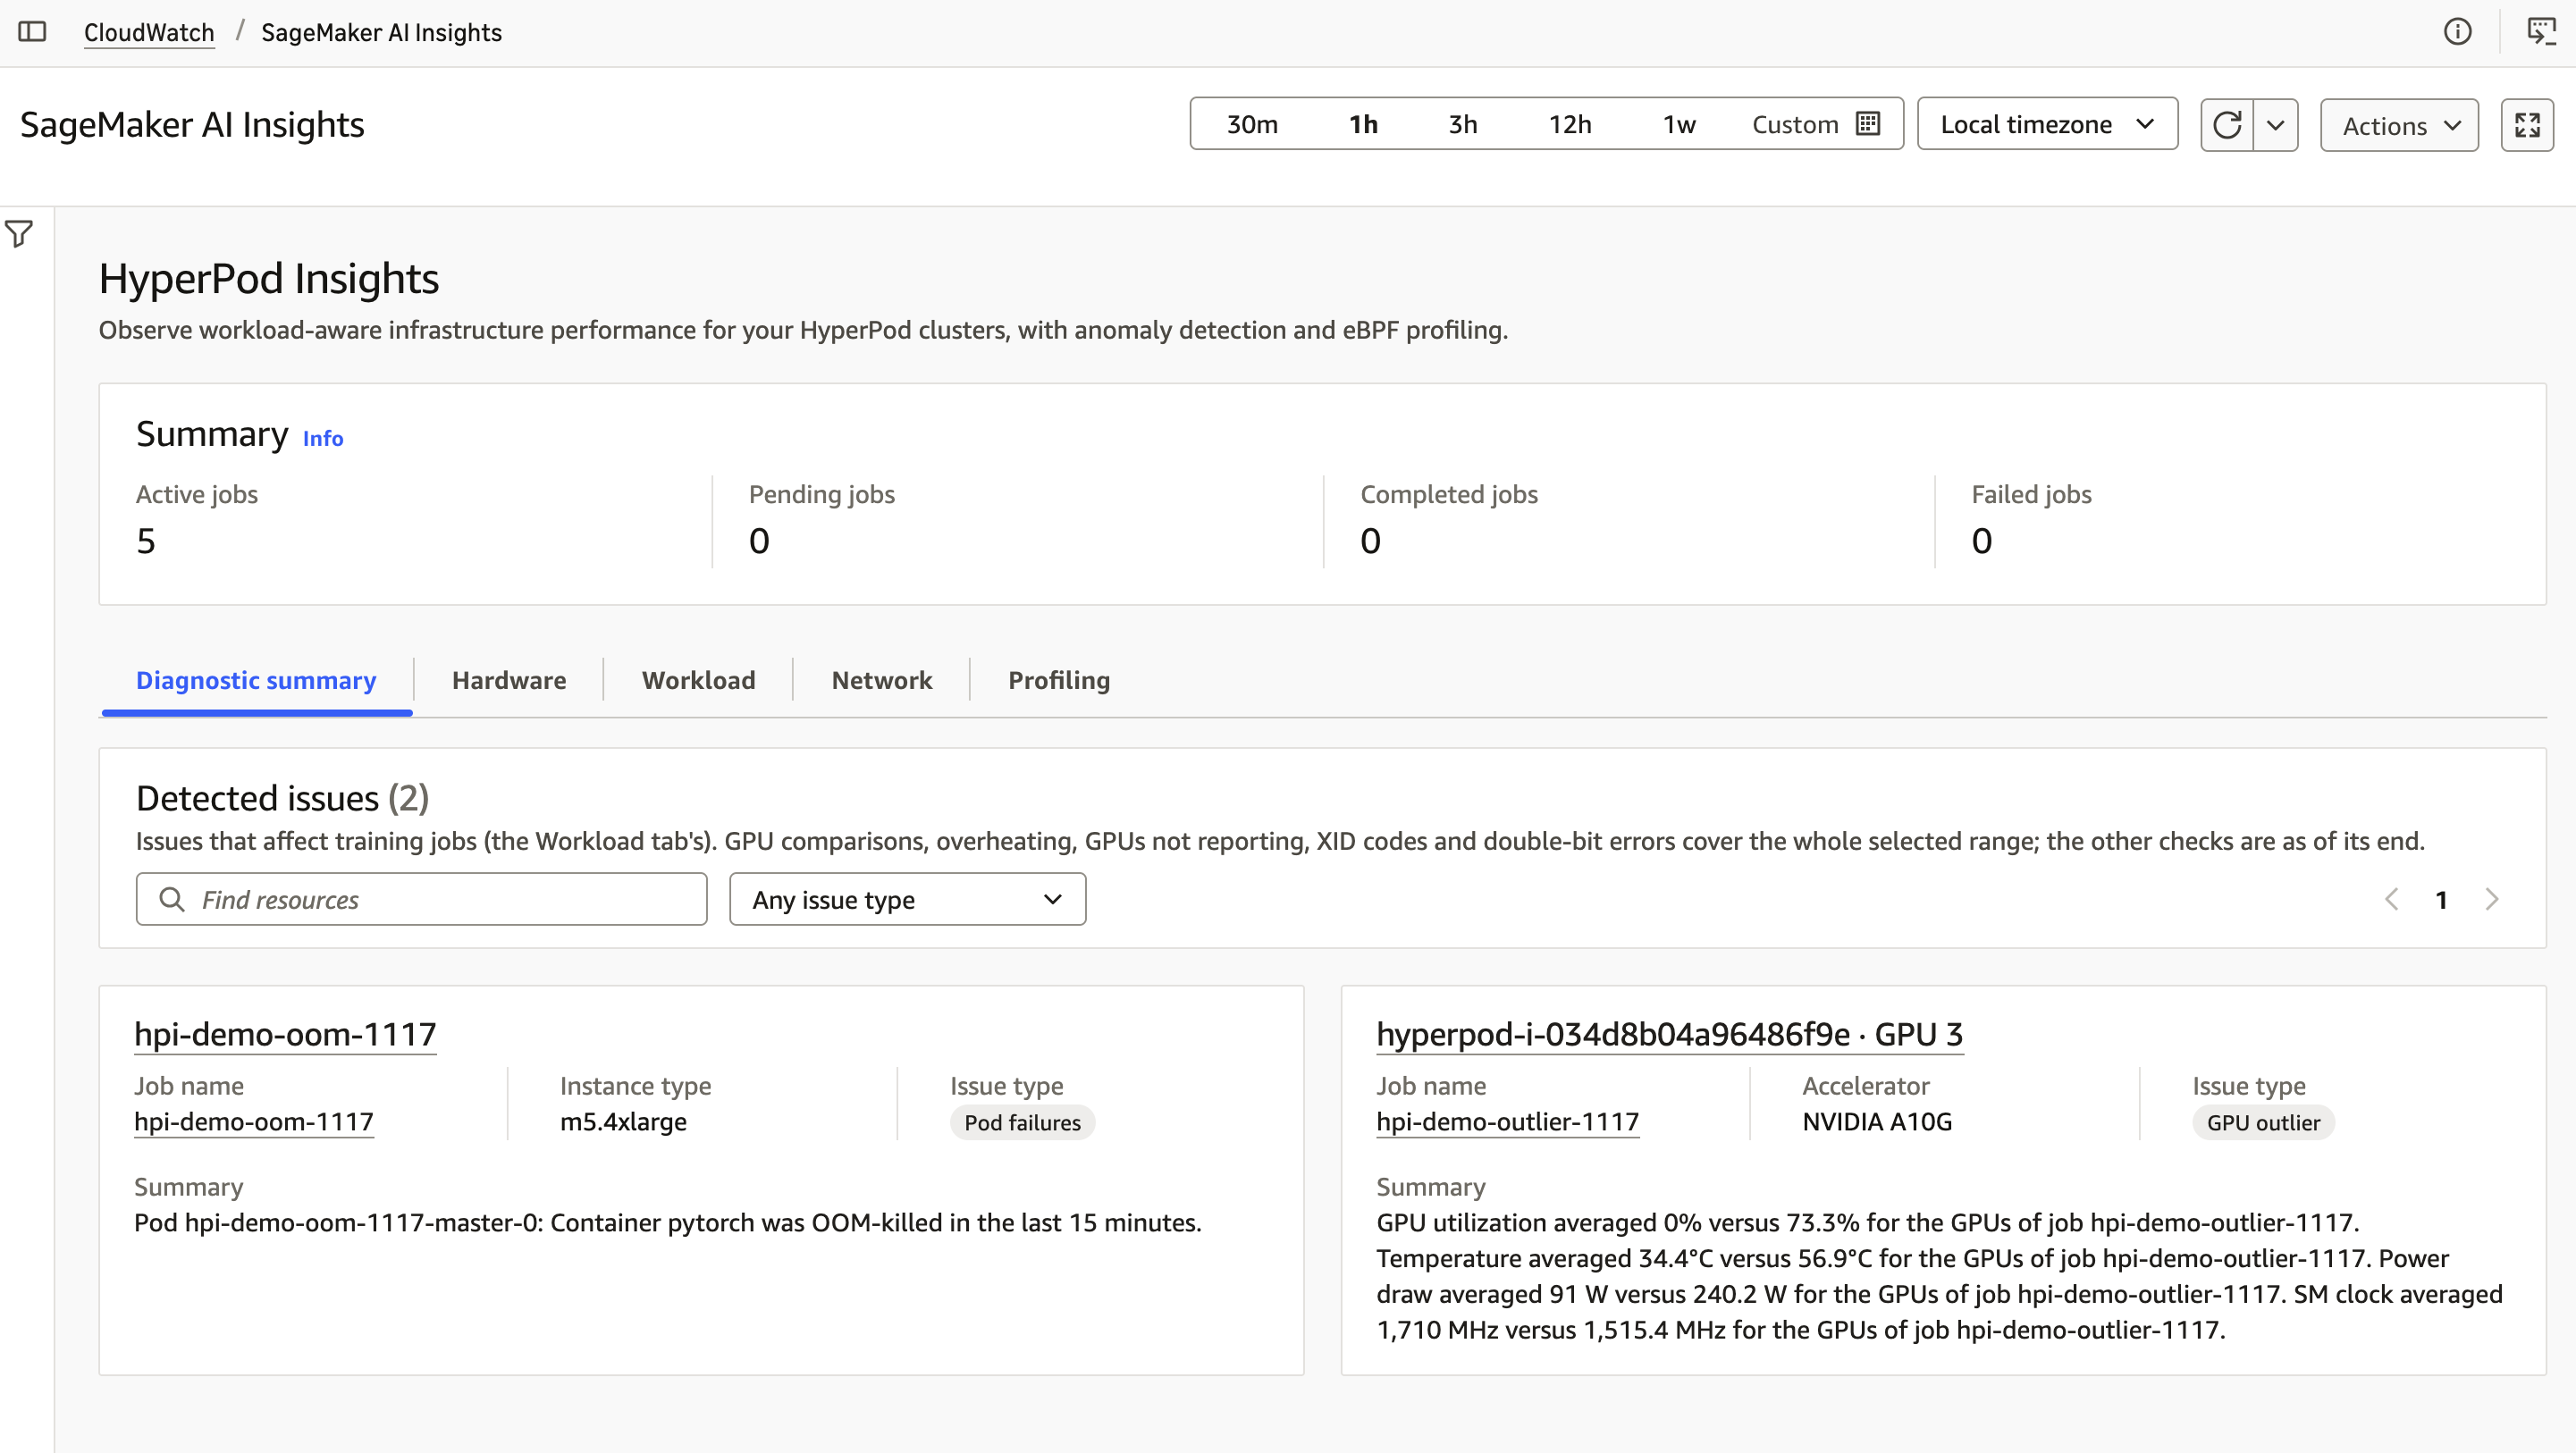
Figure 8: Diagnostic summary where each incident card names the job, cluster, accelerator, and issue type, with a cross-layer explanation
The following figure shows an incident detail:
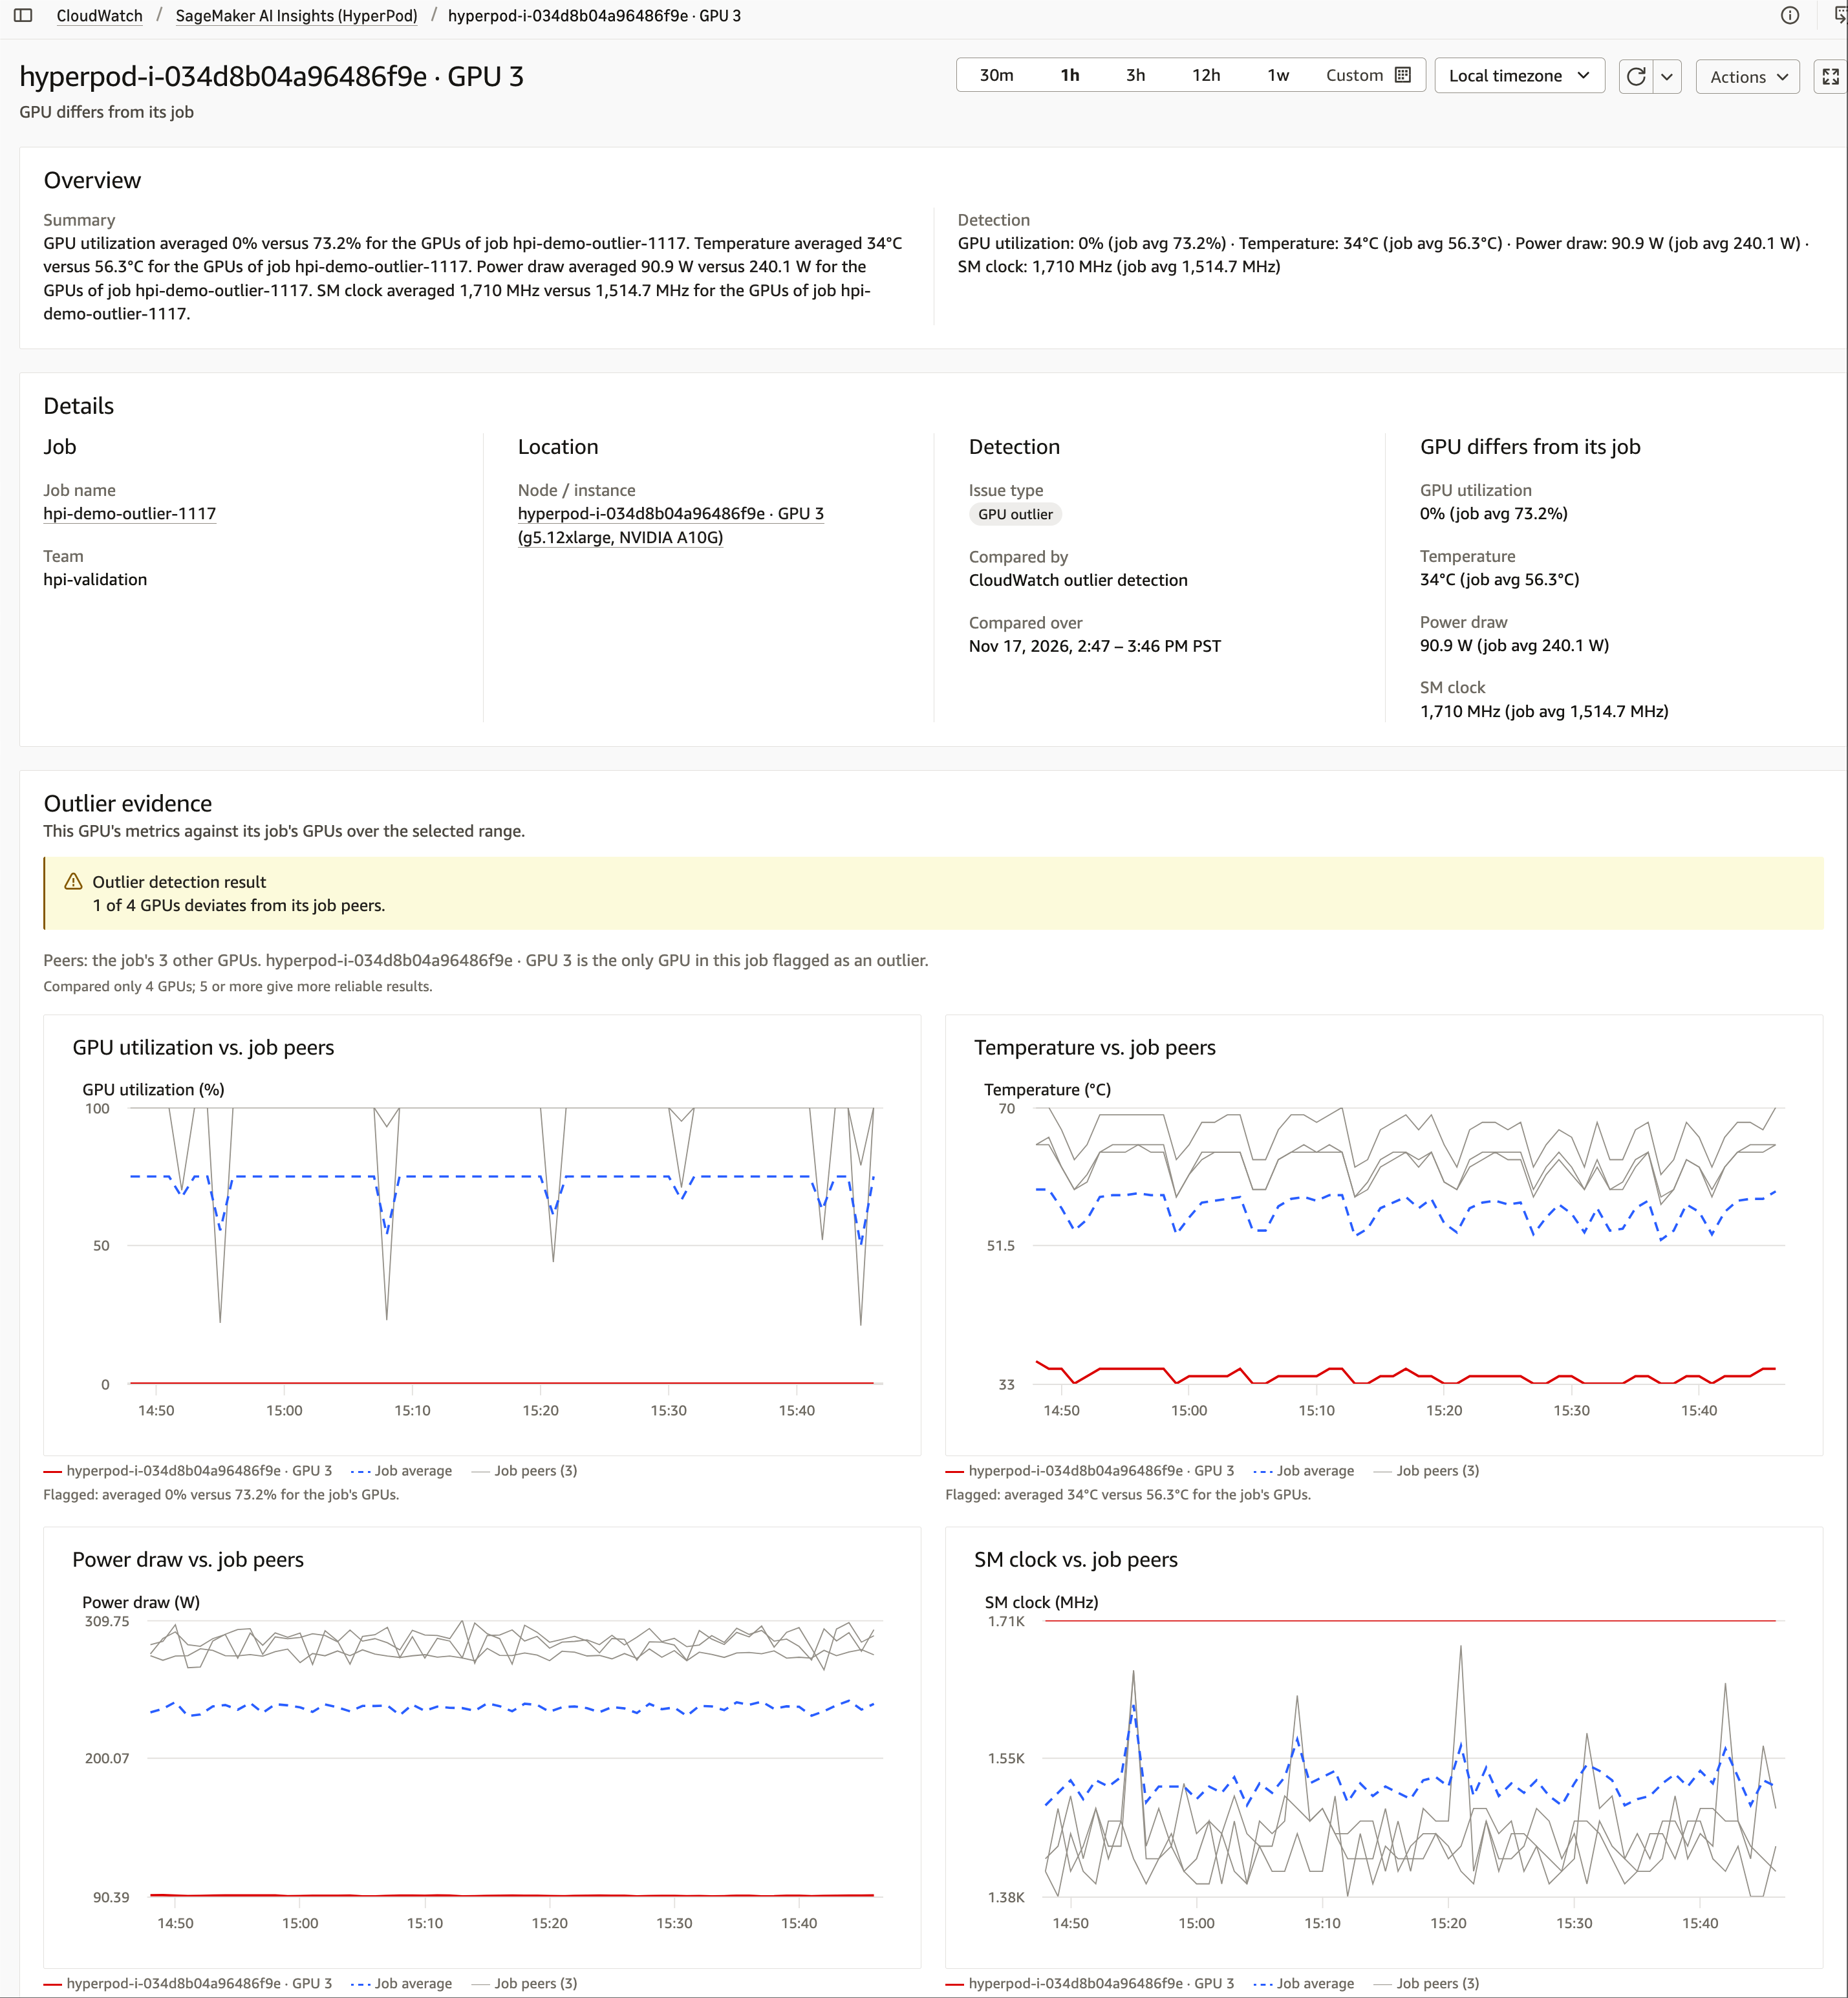
Figure 9: Incident detail showing the affected job, cluster, instance, and accelerator, with evidence charts against the fleet average
Hardware tab
The Hardware tab gives a device-level view of your accelerator fleet. The fleet topology map shows every device’s state (Active, Idle, and Unhealthy). The device table lists the accelerator type, owning team, utilization, temperature, EFA usage, status, and the workload running on each device. You can search and filter by status, accelerator, or team to find an unhealthy device quickly.
The following screenshot shows the Hardware tab:
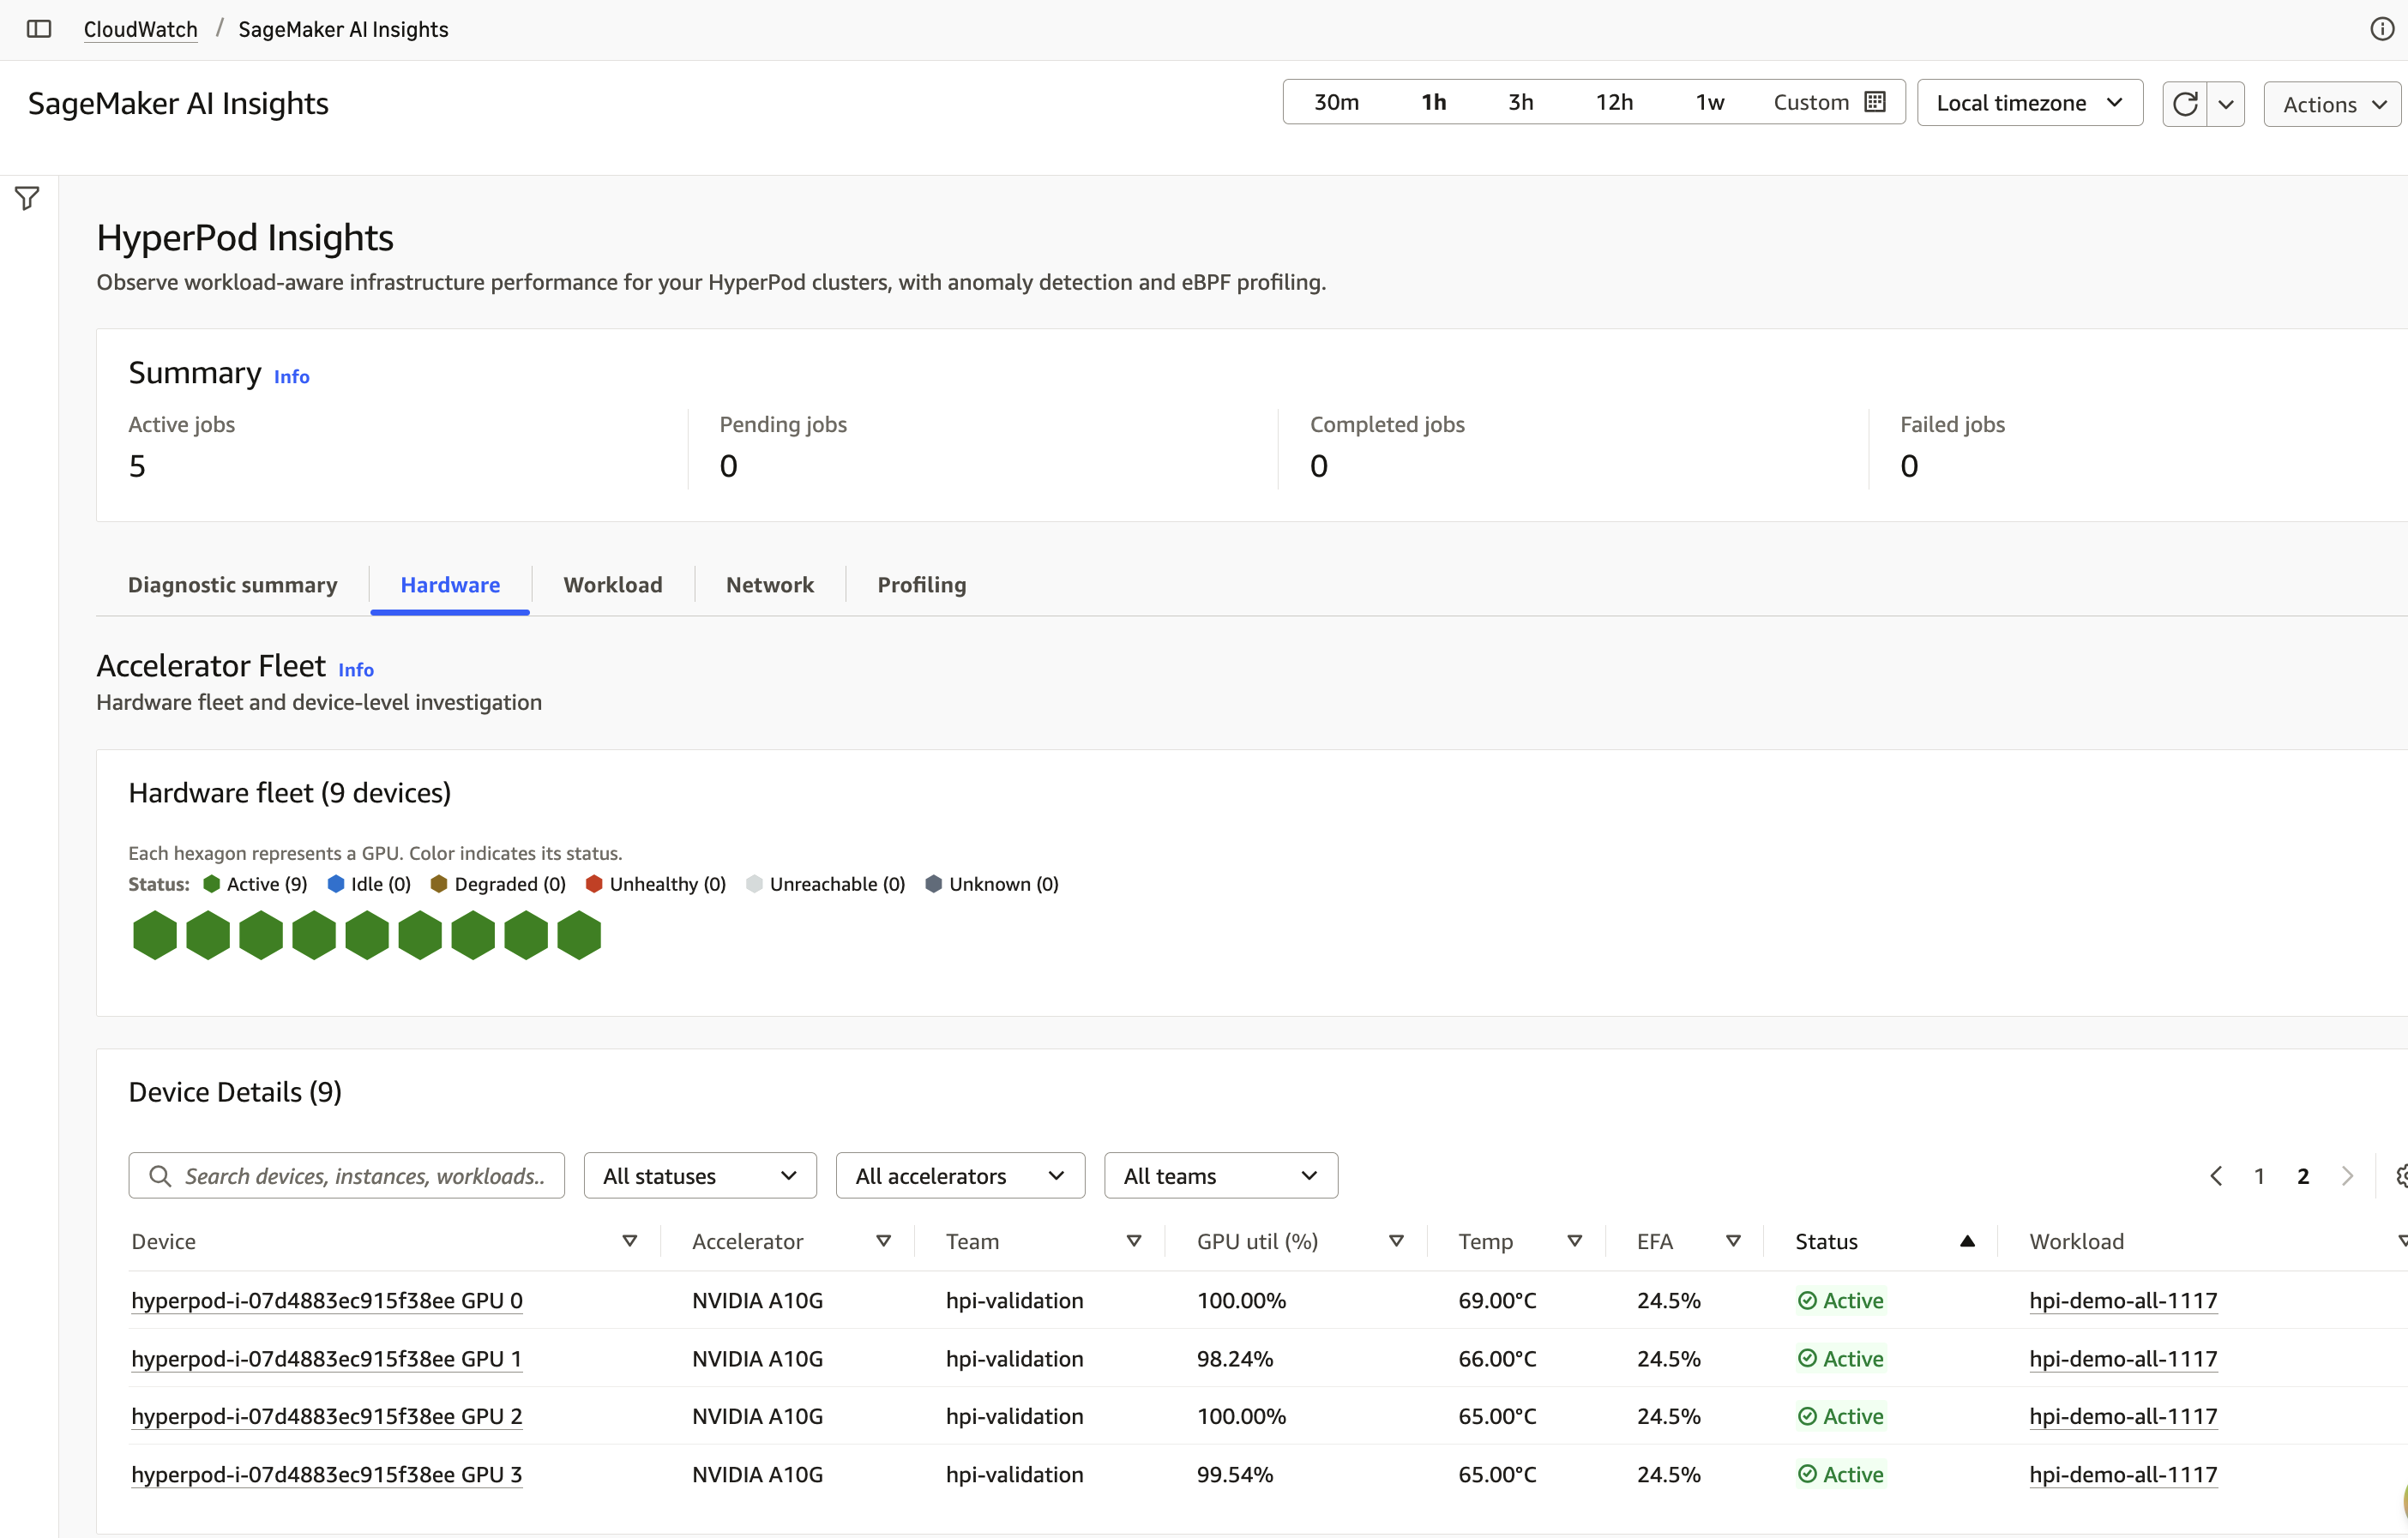
Figure 10: Hardware tab showing fleet topology and per-device accelerator, team, utilization, temperature, EFA, status, and workload
Workload tab
The Workload tab lists active and recent training jobs with their type (for example, distributed training, fine-tuning, or reinforcement learning), status, and duration. It also shows resource usage per job: EFA, GPU and CPU utilization, and memory. The tab flags jobs with abnormal network usage.
The following screenshot shows the Workload tab:
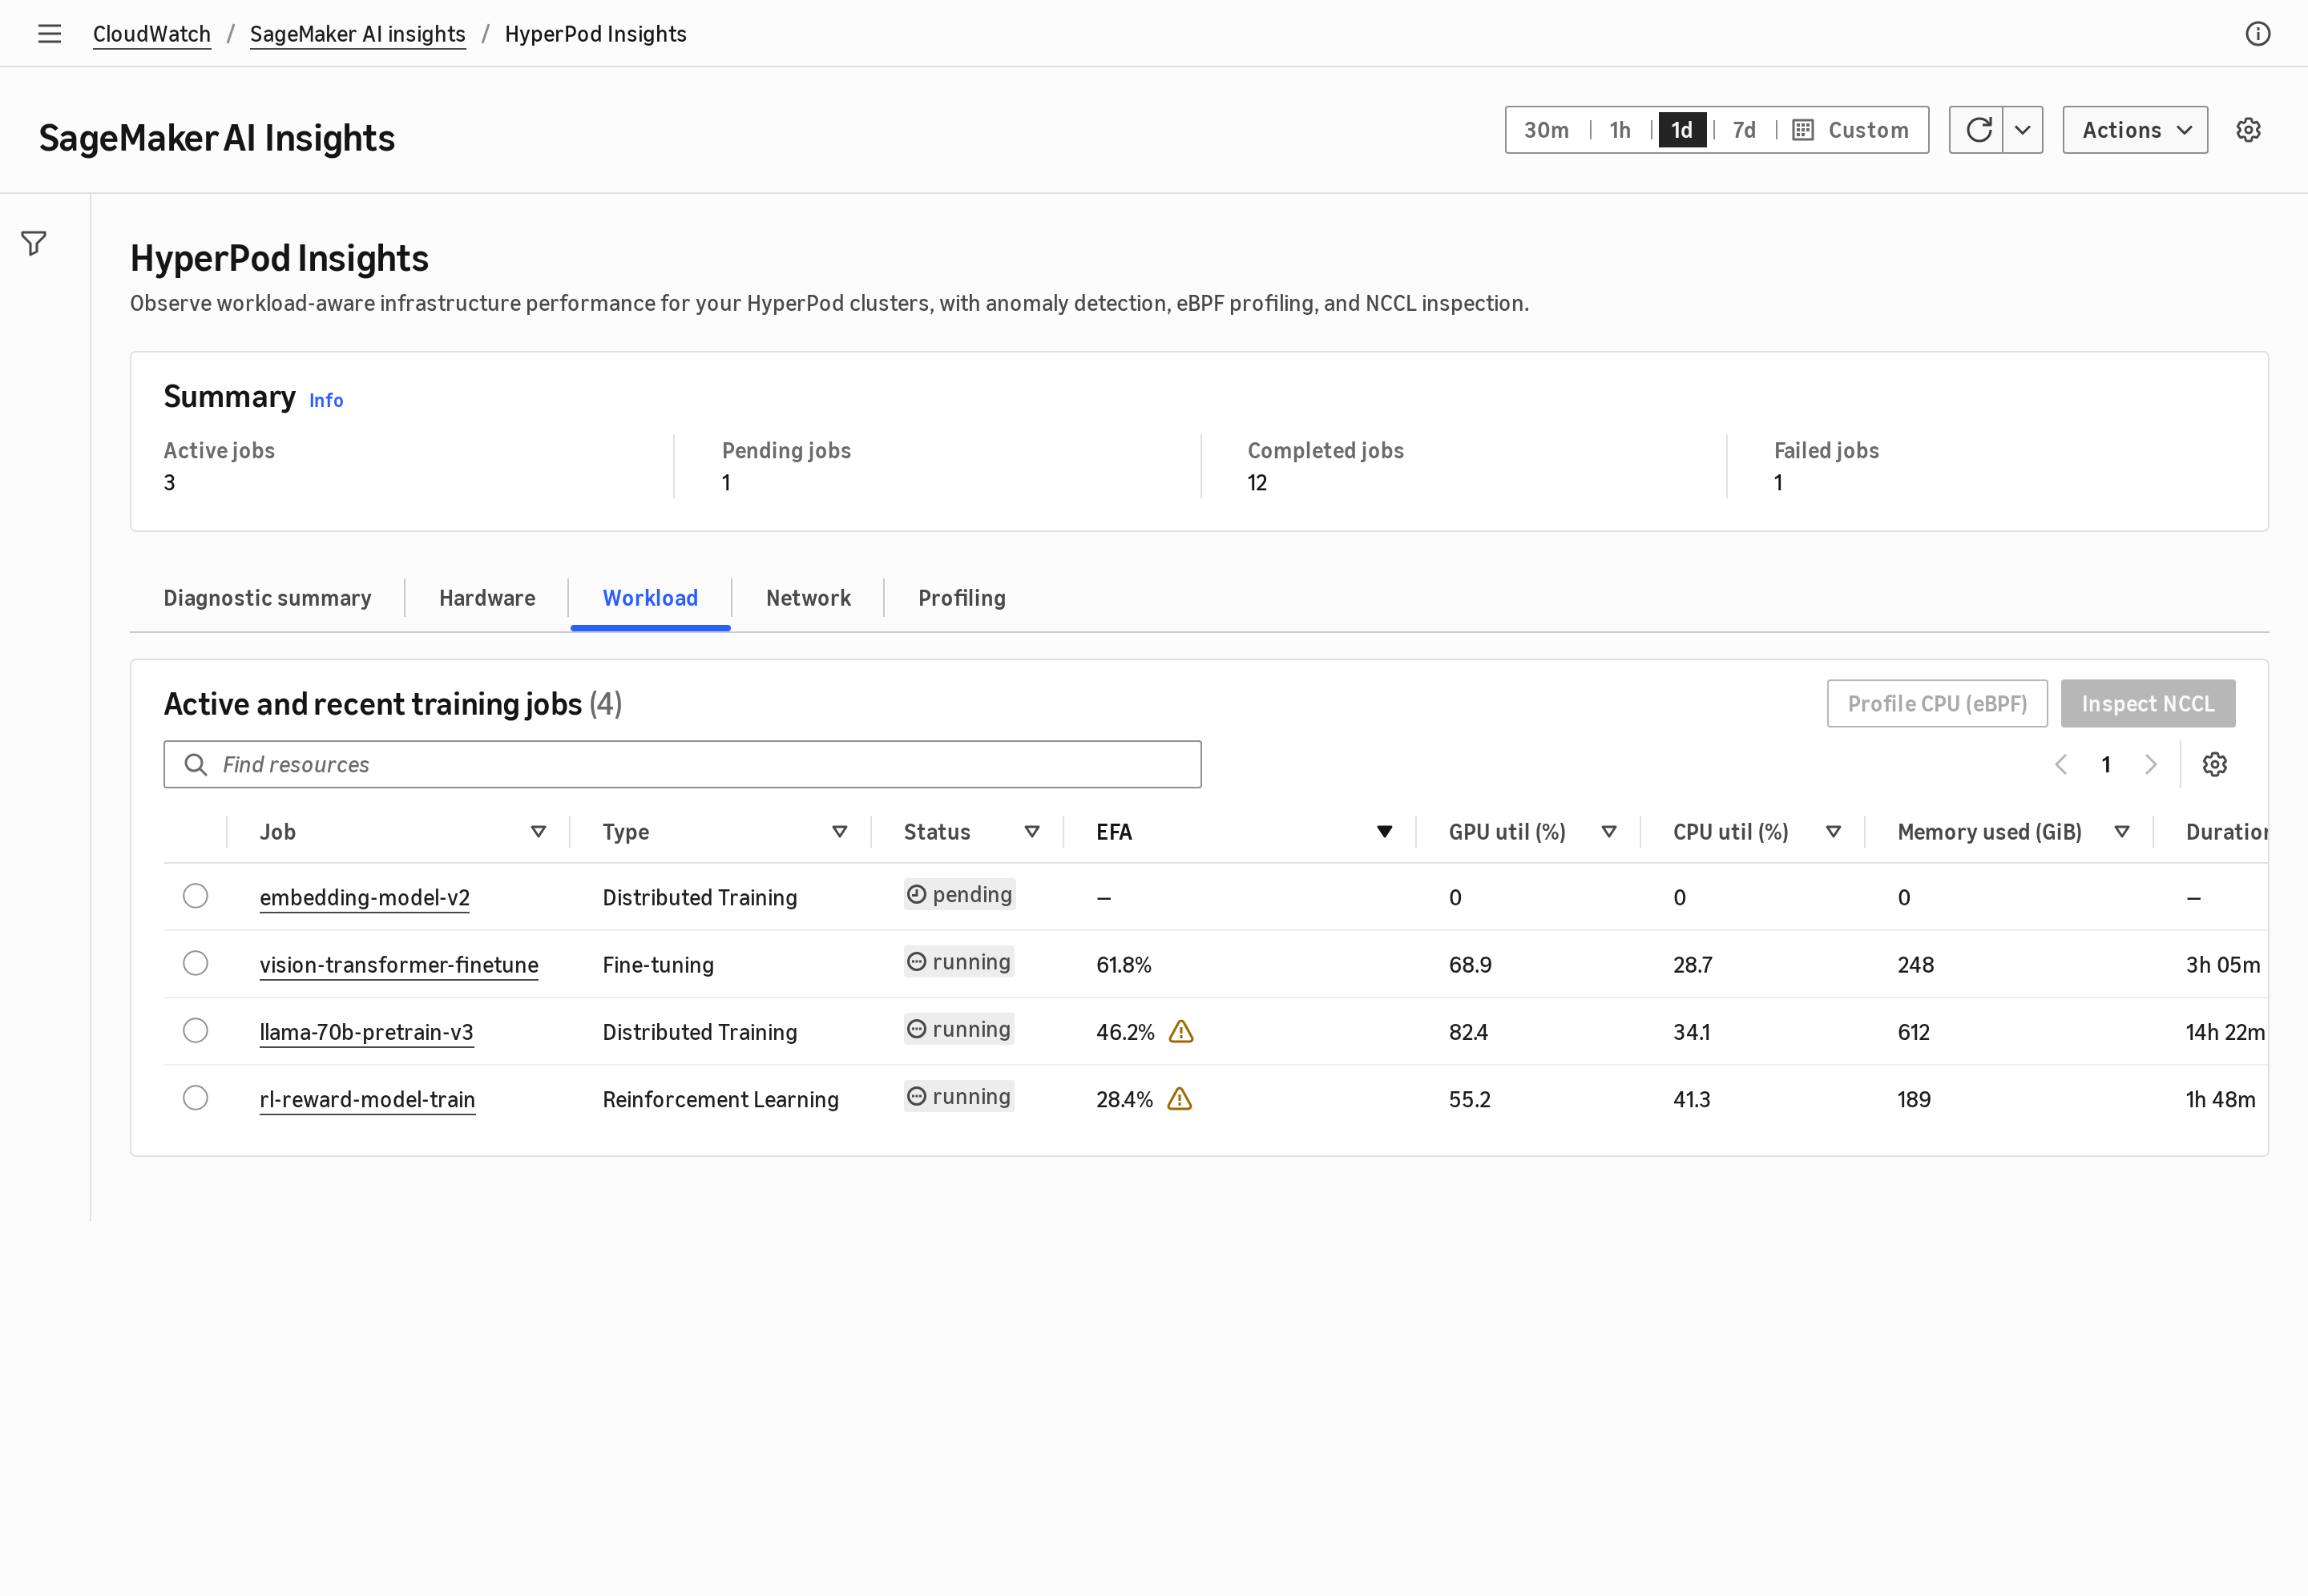
Figure 11: Workload tab showing training jobs with per-job EFA, GPU, CPU, and memory usage
You can select a job to view more details. The following screenshot shows the job detail view:
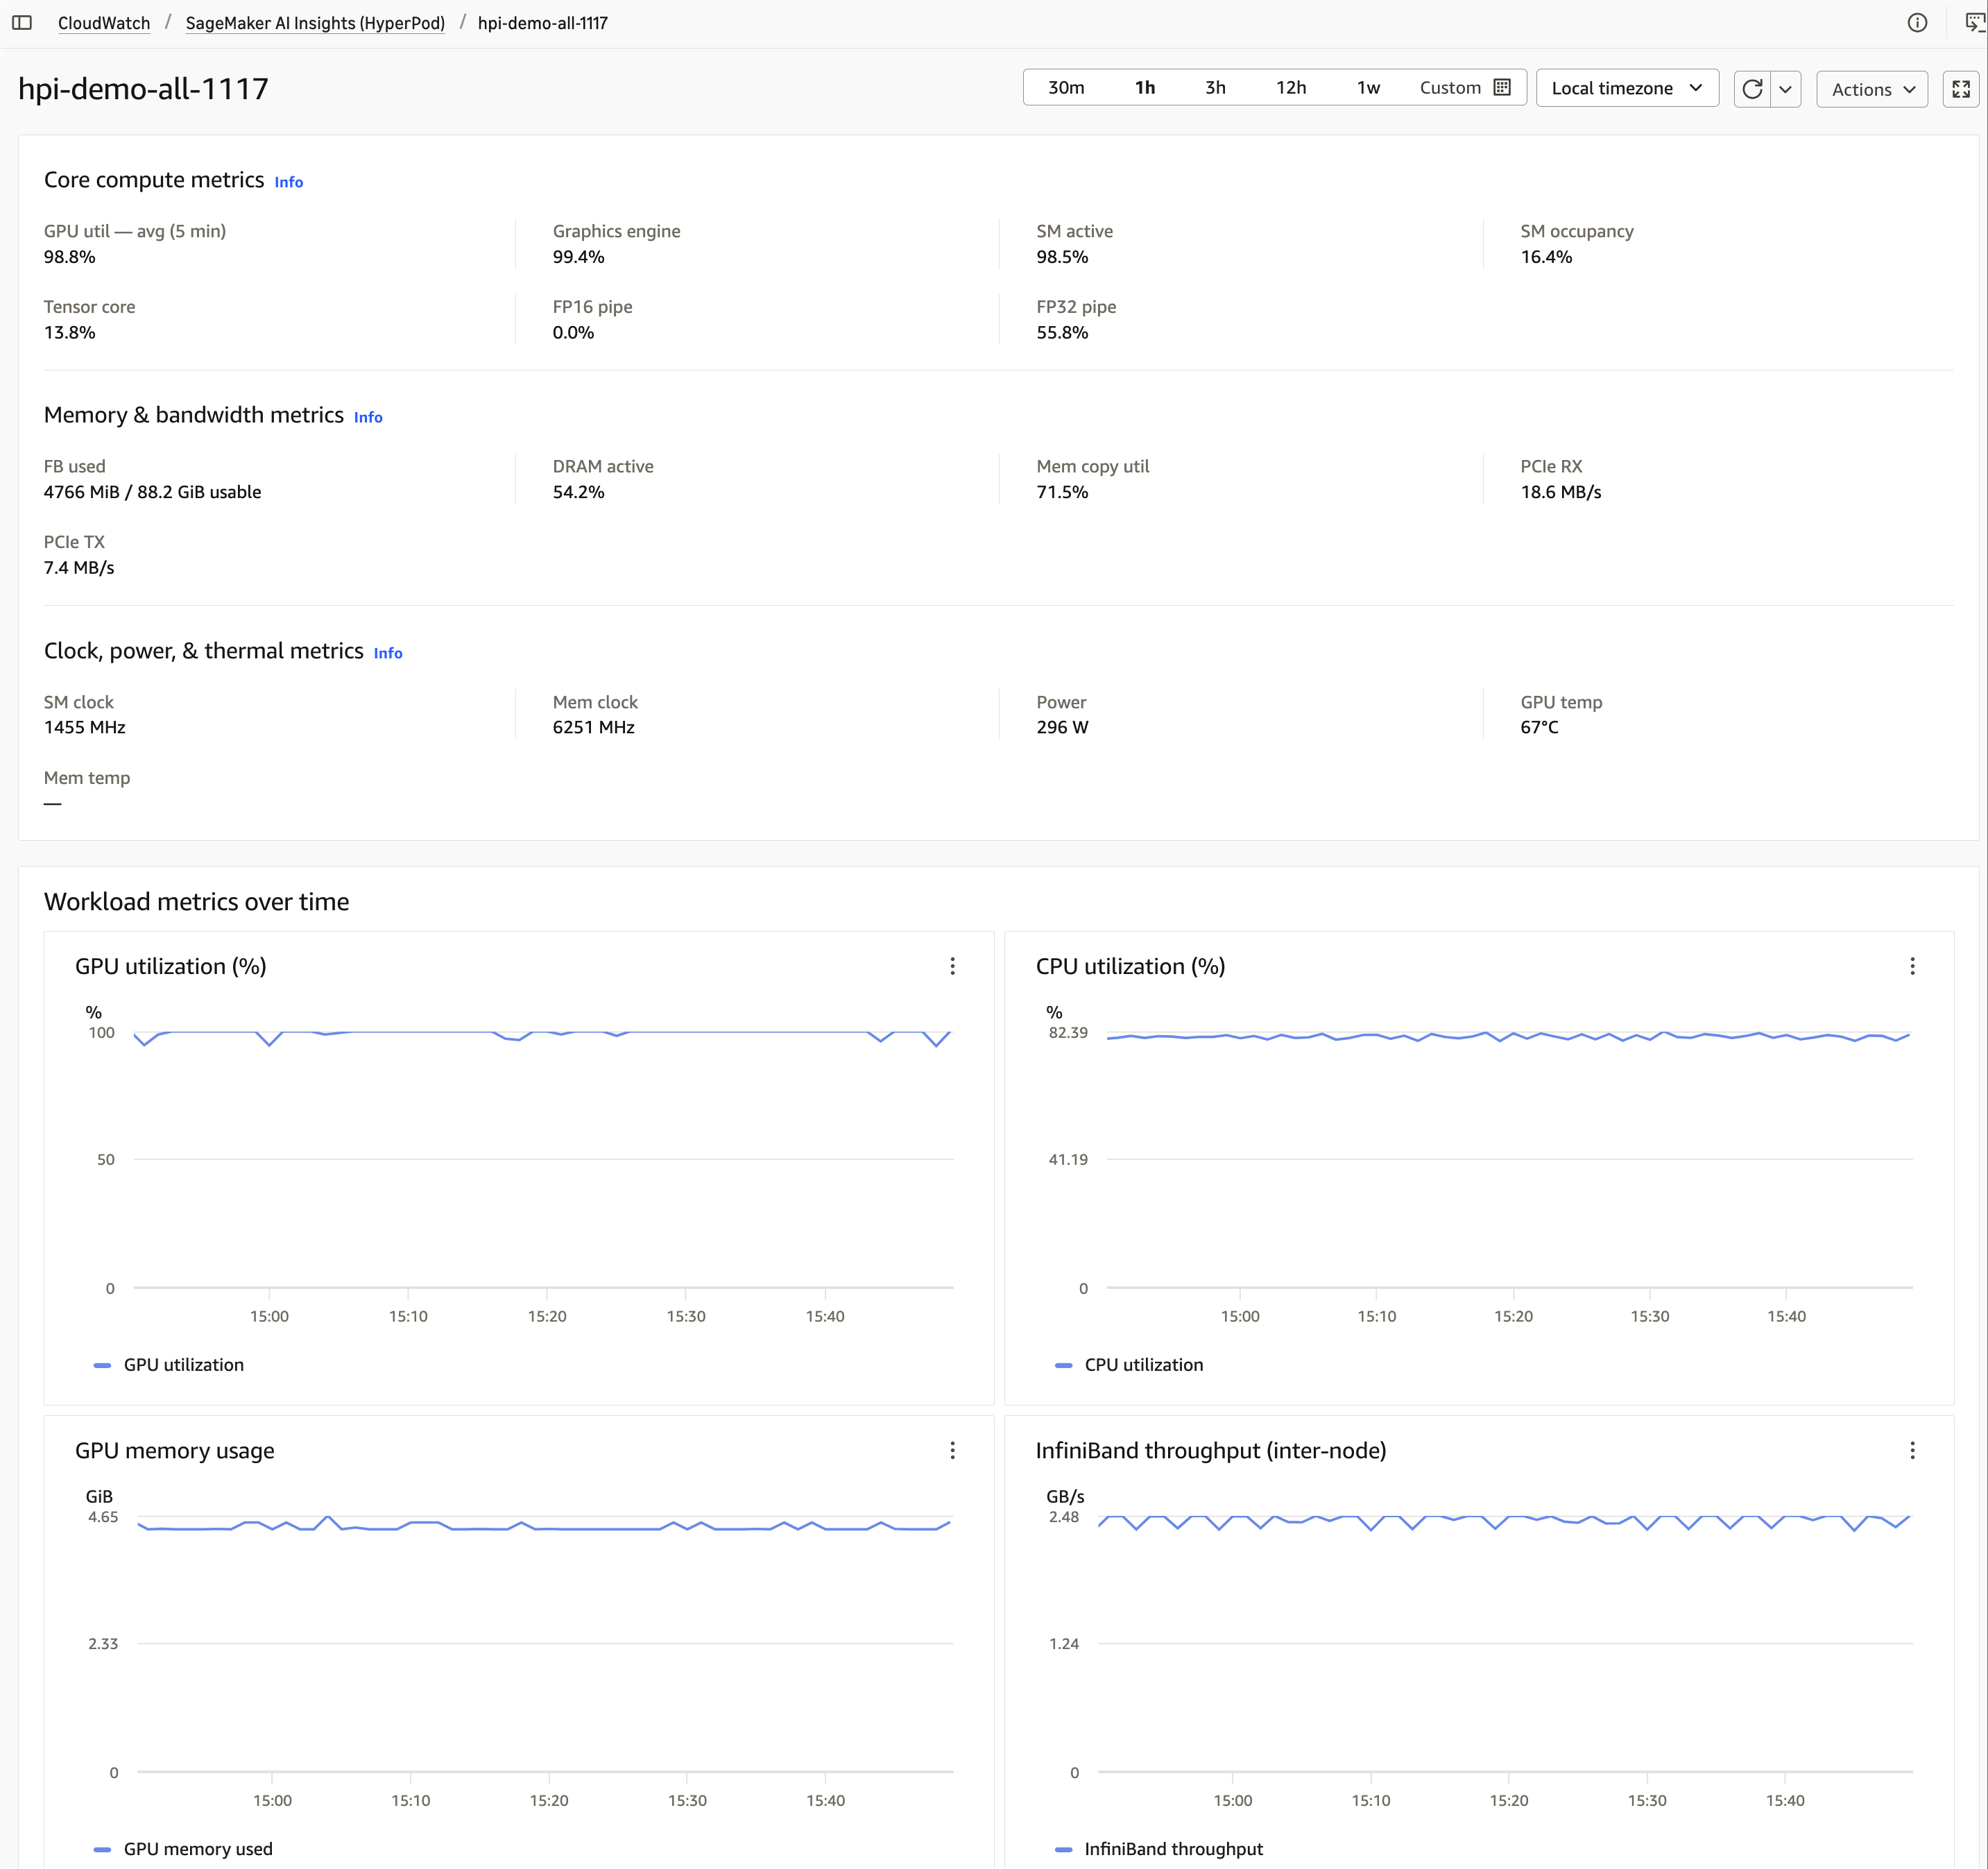
Figure 12: Job detail showing accelerator metrics
The Network tab
The Network tab summarizes the health of the inter-node communication fabric for distributed workloads. Overview metrics include fleet-average EFA utilization, degraded node count, and retransmits. A breakdown by instance type shows the share of healthy and degraded nodes for each.
The following screenshot shows the Network tab:
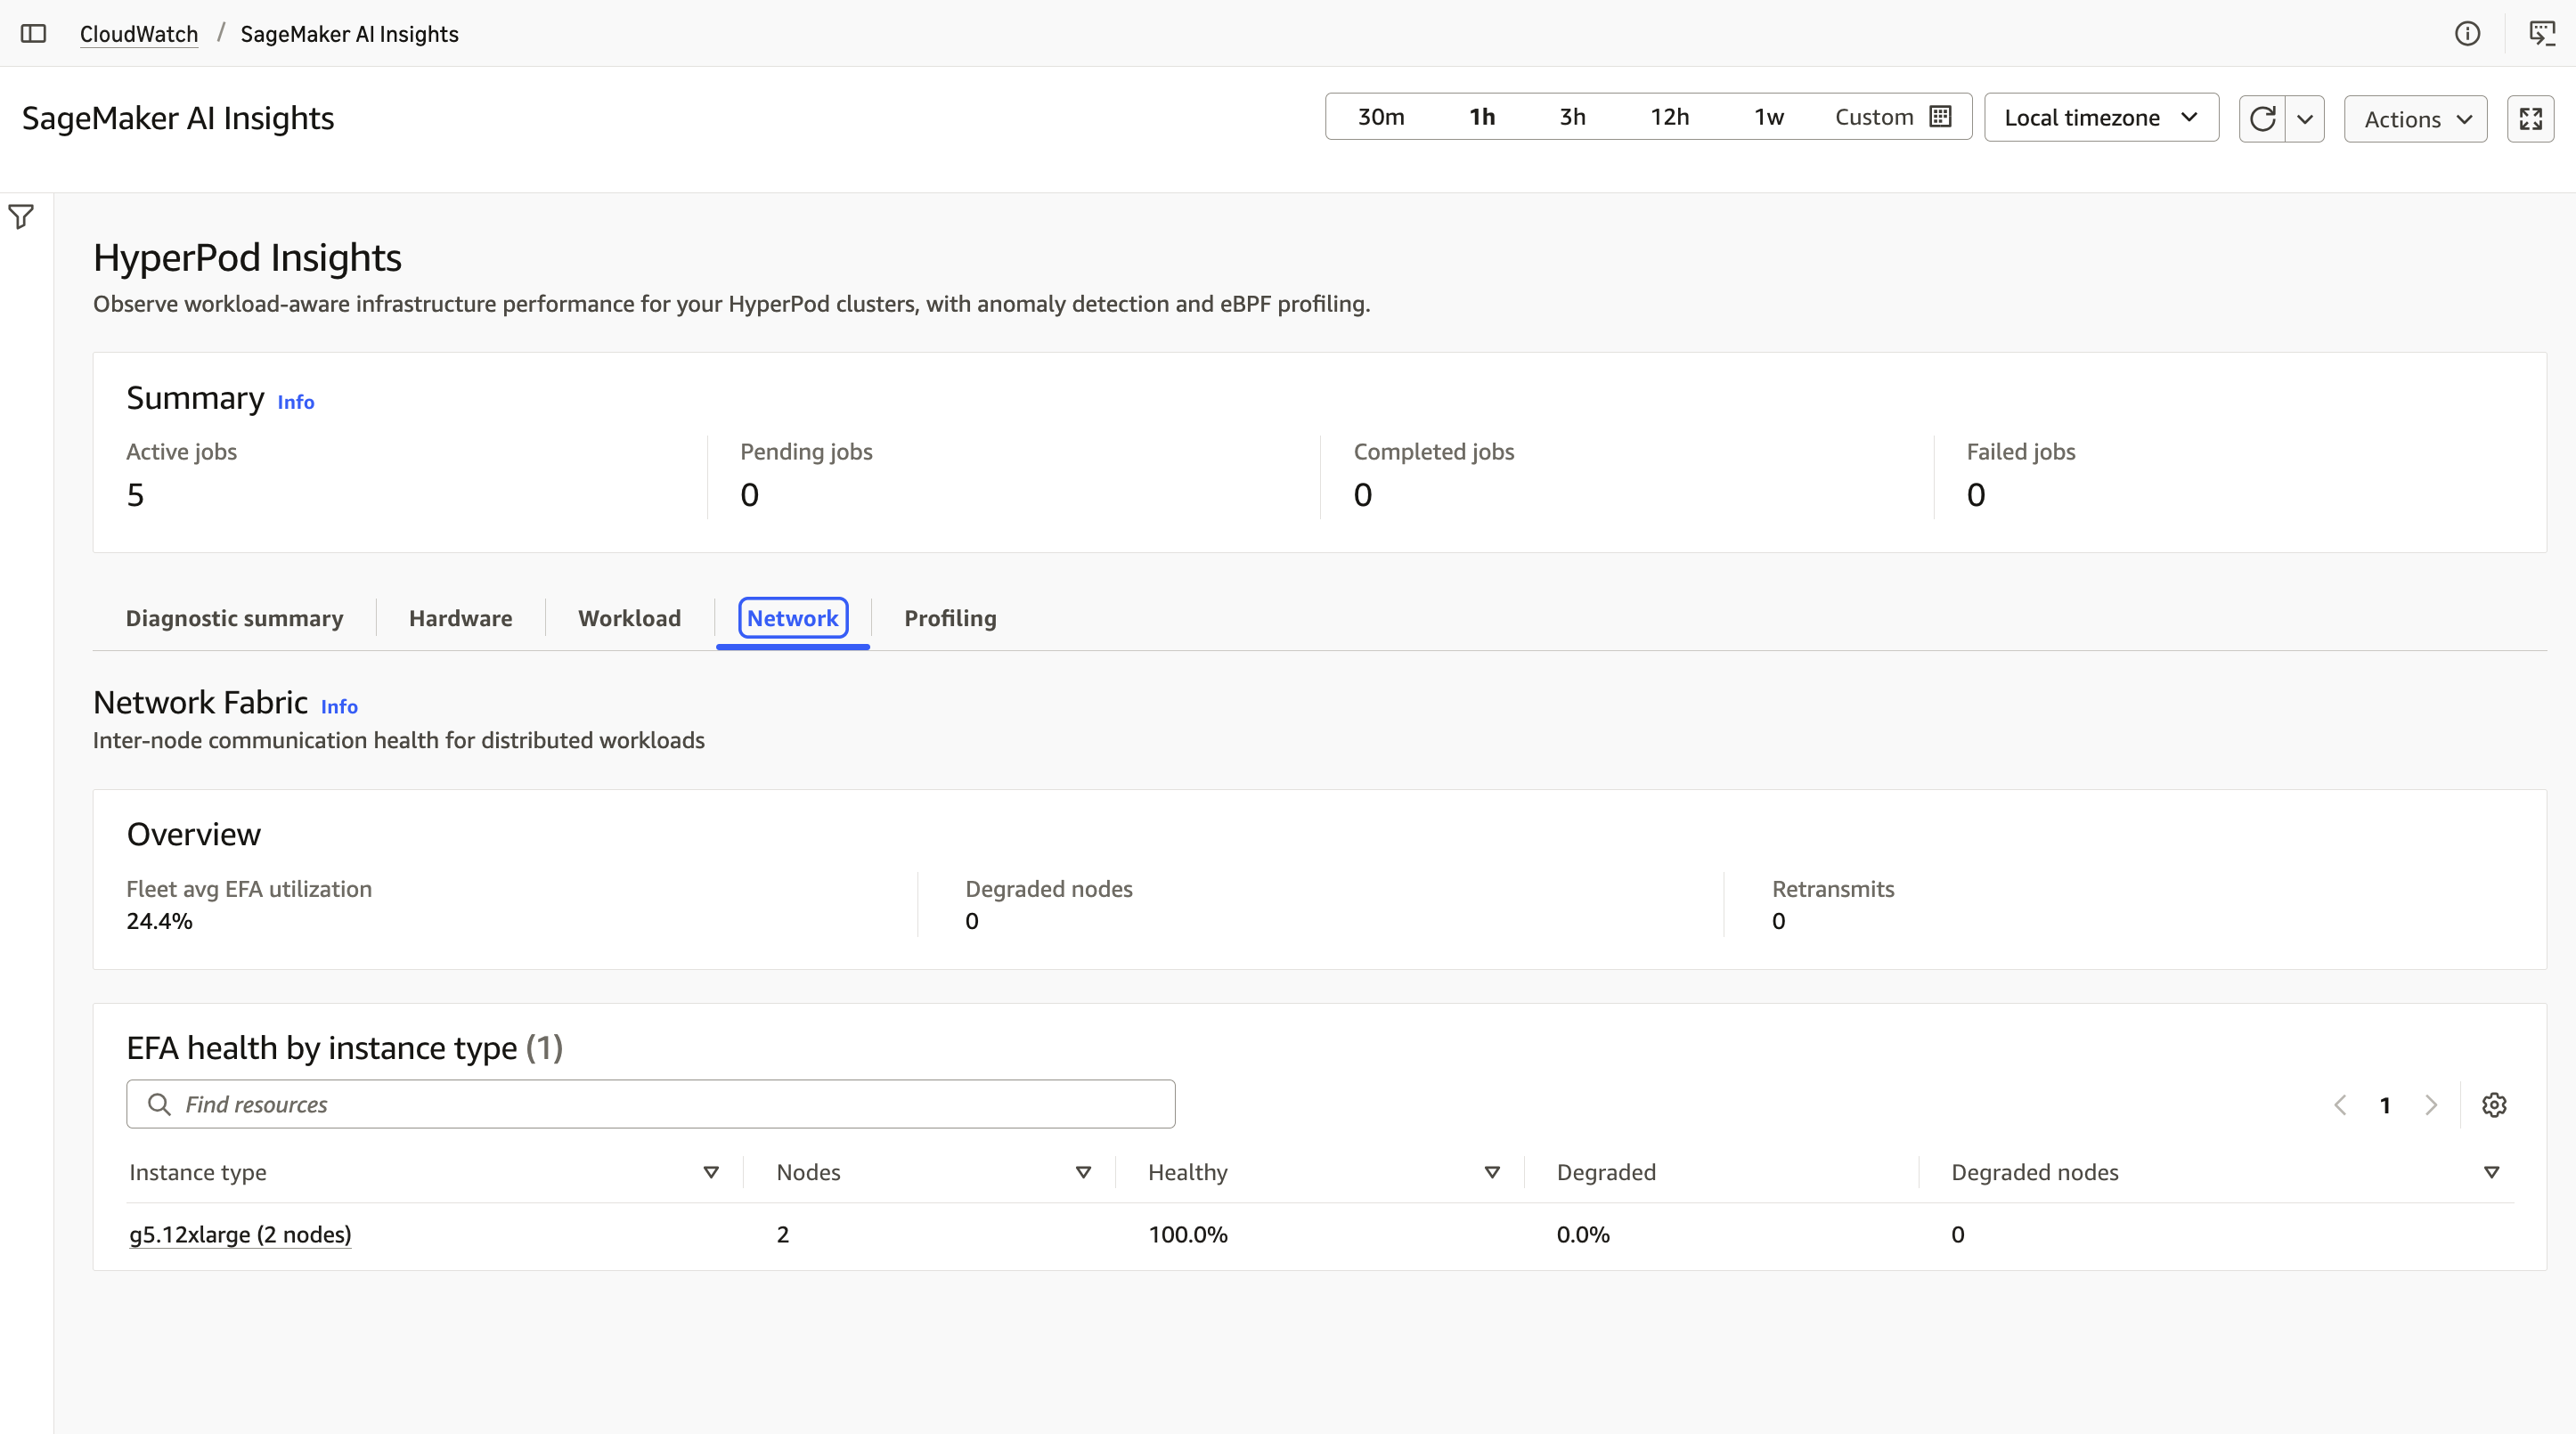
Figure 13: Network tab showing fabric overview and EFA health by instance type
Amazon Managed Grafana dashboard
From the cluster Observability tab or the Add-ons page, choose Open dashboard in Grafana to access prebuilt Amazon Managed Grafana dashboards. These dashboards give you full-stack visibility into HyperPod clusters, with telemetry from CloudWatch or Prometheus visualized across cluster, node, GPU, network, and job dimensions.
Note: If using Grafana for the first time, you must first configure AWS IAM Identity Center and add Grafana users. Documentation links are provided during cluster creation when you select the Grafana metric store option.
The following screenshot shows a prebuilt Grafana dashboard:
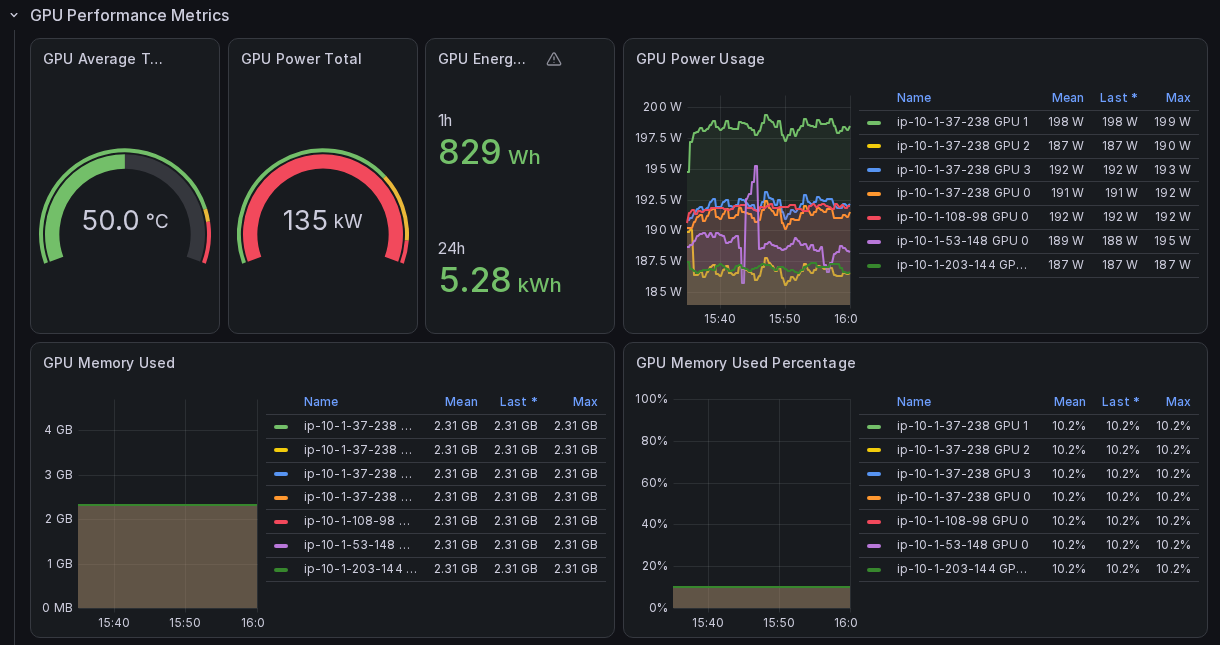
Figure 14: Prebuilt Grafana dashboard showing GPU performance metrics per node and GPU
Now available
Enhanced observability in Amazon SageMaker HyperPod is available today in all AWS Regions where SageMaker HyperPod is available.
Learn more:
- For pricing information and a list of supported cluster instance types, see Amazon SageMaker HyperPod.
- Check out the Developer Guide.
- Visit the AWS Management Console to start training with the enhanced observability add-on.