Artificial Intelligence
Introducing Mobile Layout for Amazon Quick dashboards
Teams that rely on dashboards for daily decisions often must pinch and zoom to interact with controls originally designed for larger displays. Checking revenue during a morning standup, reviewing pipeline metrics between meetings, or monitoring operations while traveling all require extra effort when the dashboard was built for a desktop screen.
Mobile Layout for Amazon Quick Free Form dashboards solves this by automatically rendering dashboards as a single-column, touch-optimized view that fills the device screen. Readers get immediate access to their data without resizing or scrolling horizontally. Mobile Layout for Free Form dashboards is now available in each supported AWS Region. Mobile Layout transforms the desktop canvas into a single-column, continuous scroll experience sized for the device. Visuals fill the screen width, maintain their aspect ratio, and remain interactive.
Authors do not need to make changes for this to take effect. Dashboard readers get immediate, frictionless access to their data on any phone or tablet. In this post, we show you how Mobile Layout works and what you can do to optimize your dashboards.
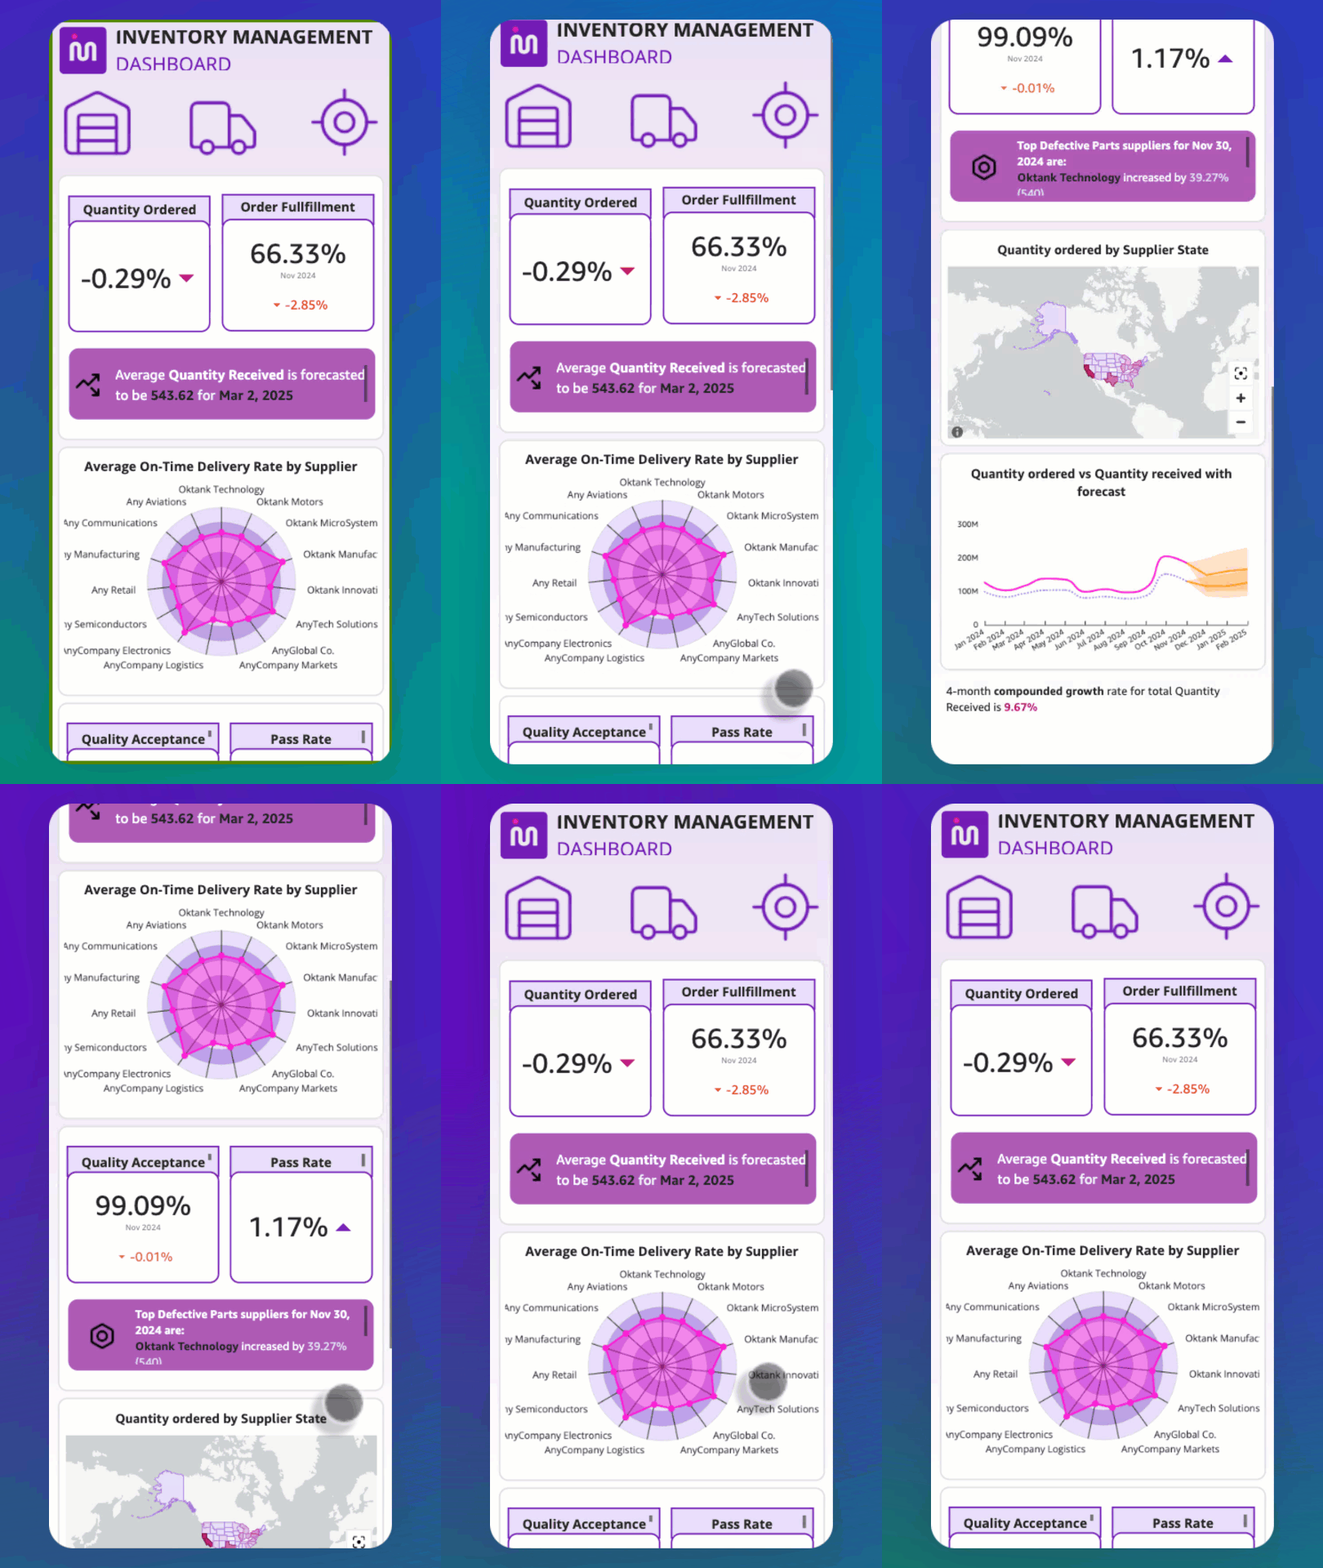
The following animation shows a Free Form dashboard opening on a phone in Mobile Layout, with the reader scrolling through key performance indicators (KPIs) and charts in a continuous vertical feed.
Mobile layout explained
Mobile Layout is a rendering mode for Free Form dashboards. When a reader opens a Free Form dashboard on a device with a small viewport, Amazon Quick detects the screen size and renders the mobile view. The reader gets a single-column, vertically scrollable feed of visuals, each sized to fill the screen width.
Detection is based on the device viewport. When the viewport falls within phone or tablet dimensions, Mobile Layout activates. On larger screens, the standard desktop rendering is used.
Capabilities
Mobile Layout includes the following capabilities for Free Form dashboards.
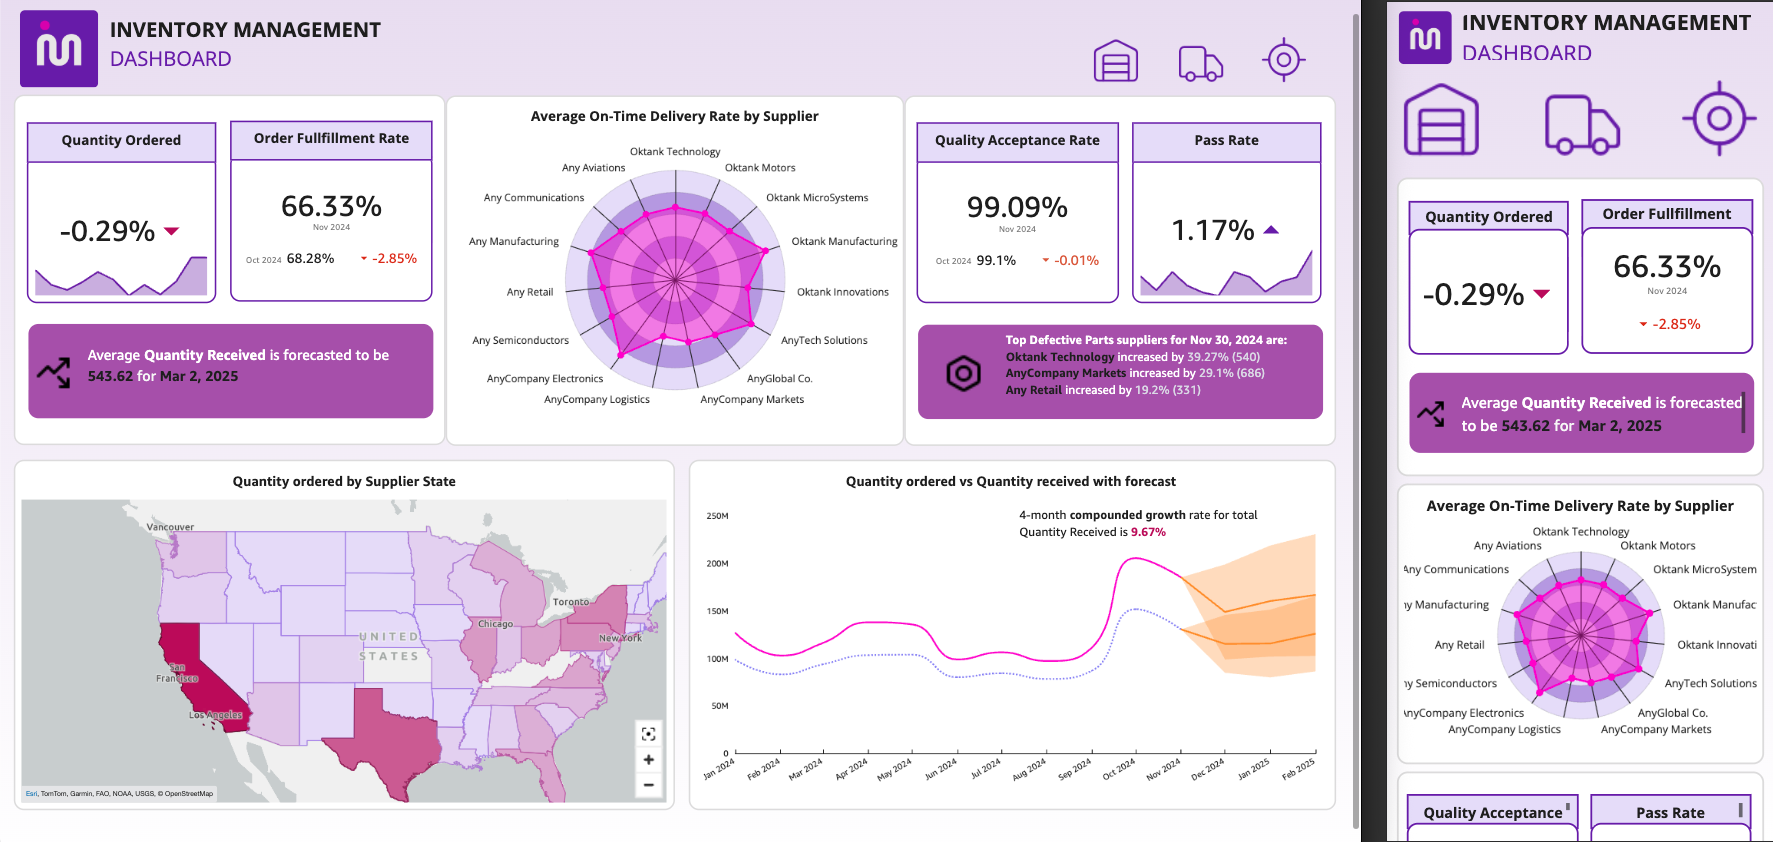
Continuous scroll. Visuals stack in a single column. Each visual fills the full viewport width. Aspect ratios are preserved: portrait-shaped visuals stay tall, landscape-shaped visuals stay wide.
Group-aware rendering. Free Form dashboards often use overlapping visuals (for example, KPI values layered on a colored background). Mobile Layout respects group boundaries. Grouped visuals render together as a single unit, preserving the layered design.
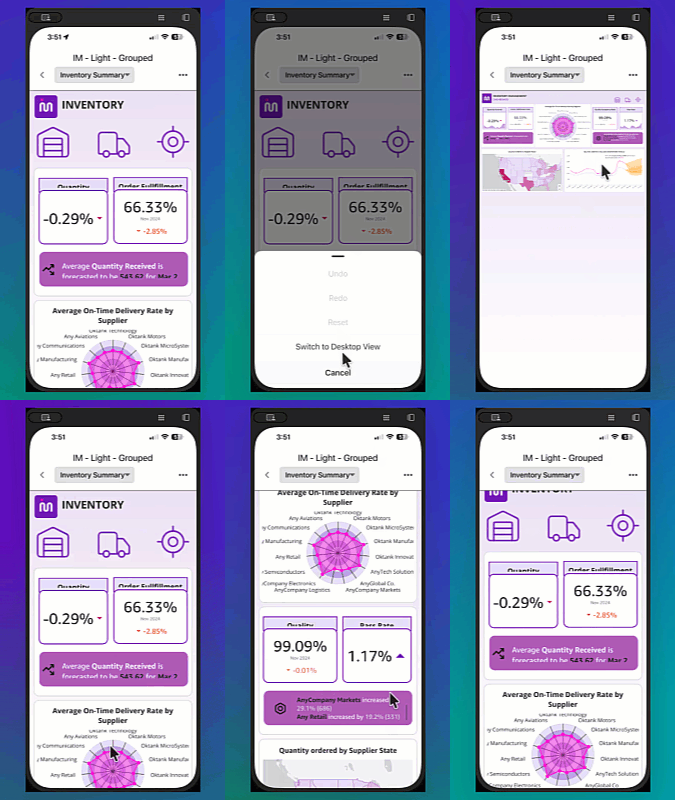
Reader controls. In the Quick mobile app, readers can use a built-in view switcher to toggle between Mobile view (continuous scroll) and Desktop view (the original rendering). On web (mobile browser), portrait orientation renders the mobile experience and landscape orientation renders the desktop experience.
Performance. Mobile Layout uses an optimized rendering path that reduces resource consumption on mobile devices. Dashboards that previously had difficulty rendering on phones now load and scroll smoothly.
The following image shows the same dashboard in Desktop view (left) and Mobile continuous scroll view (right).
Required actions
For dashboard readers: Nothing. Mobile Layout works for existing Free Form dashboards. There is no setting to turn on, no migration to perform, and nothing to update. Open a dashboard on a phone or tablet and access the mobile view immediately.
For authors and administrators: Nothing is required. Authors of Free Form dashboards benefit automatically because their published dashboards already render in Mobile Layout on smaller screens. Authors who use Tiled or Classic layouts are not affected. Those layout types retain their existing responsive behavior. Administrators do not need to configure anything. Mobile Layout is active by default for Free Form dashboards across the account.
Getting the best mobile experience with groups
Authors who use overlapping visuals can take one optional step to verify that their design translates well to mobile: organize those visuals into Groups.
In Free Form layout, authors commonly layer visuals on top of each other. You might place KPI values on top of a colored background, or stack comparison cards over a container.
On desktop, these overlapping elements render as intended. On mobile, the layout engine needs to decide how to handle them.
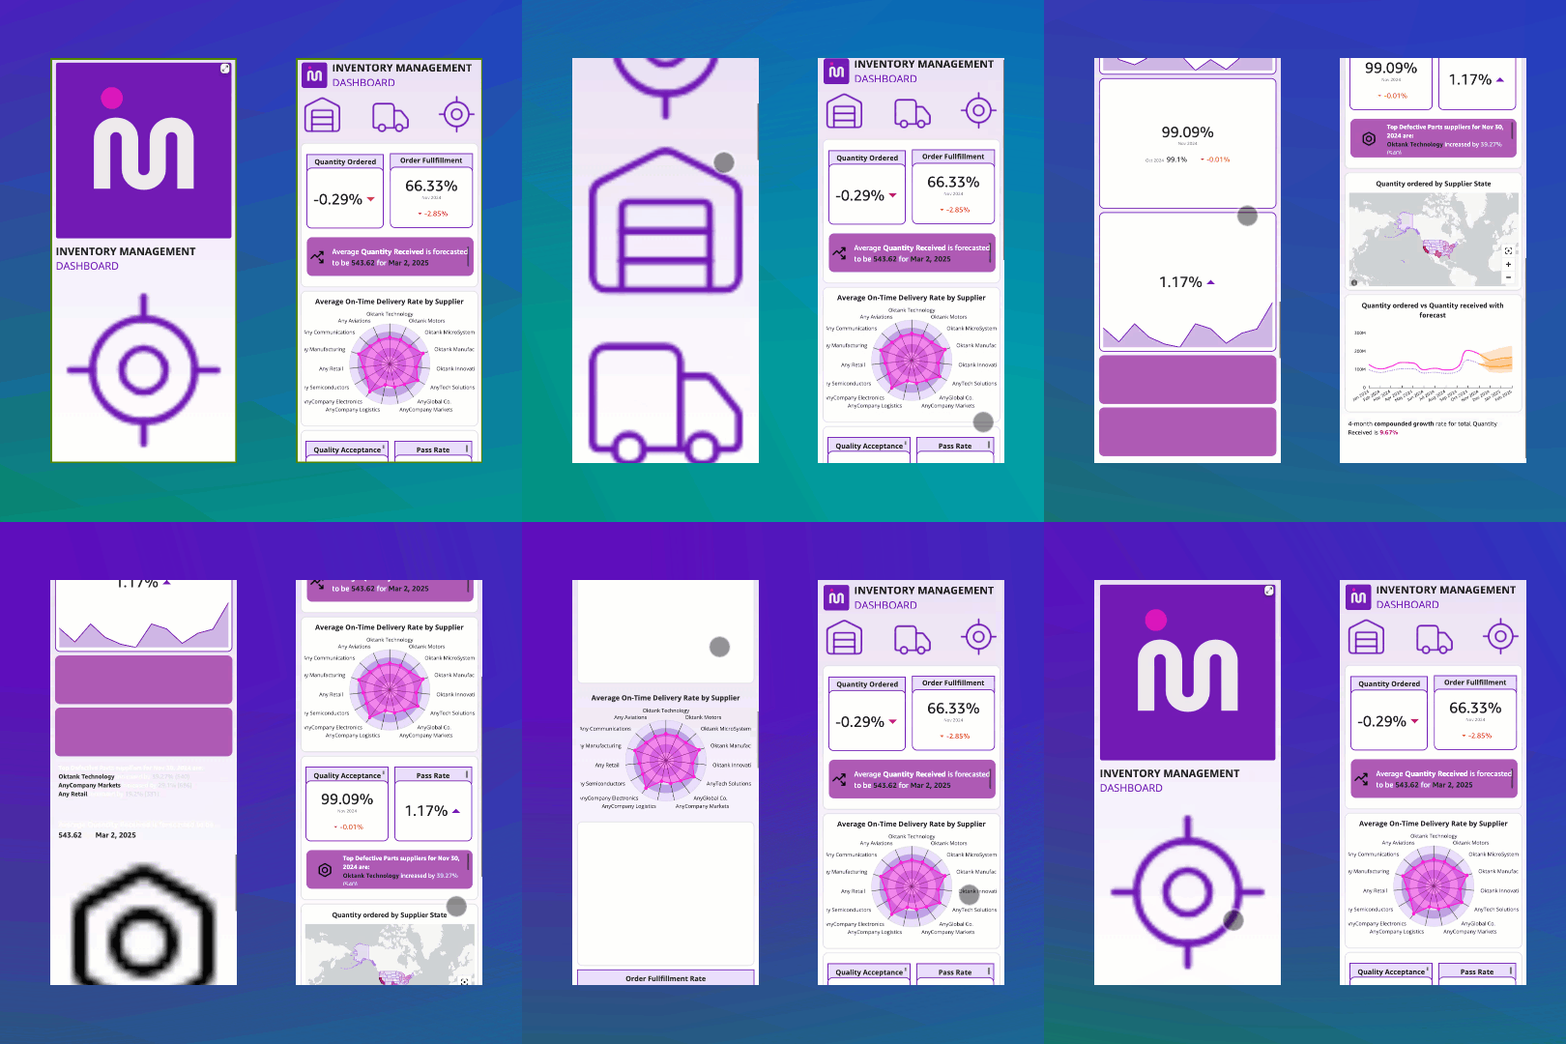
Without grouping, each visual becomes its own card in the mobile scroll. A KPI that sits on a background image appears as separate elements: the background rendered as one card, each KPI rendered as a separate card. The visuals still render correctly, but they lose their layered relationship.
With grouping, all visuals in the group render together as a single unit. The background and KPIs stay together, preserving the banner as the author designed it.
For documentation on working with visual groups in Free Form layout, refer to Customizing visuals in a free-form layout.
The following animation compares grouped visuals (where the KPI banner stays as one unit) with ungrouped visuals (where KPIs appear as separate cards) on mobile.
How to group overlapping visuals
To group visuals, complete the following steps.
- Open your analysis in Amazon Quick authoring mode.
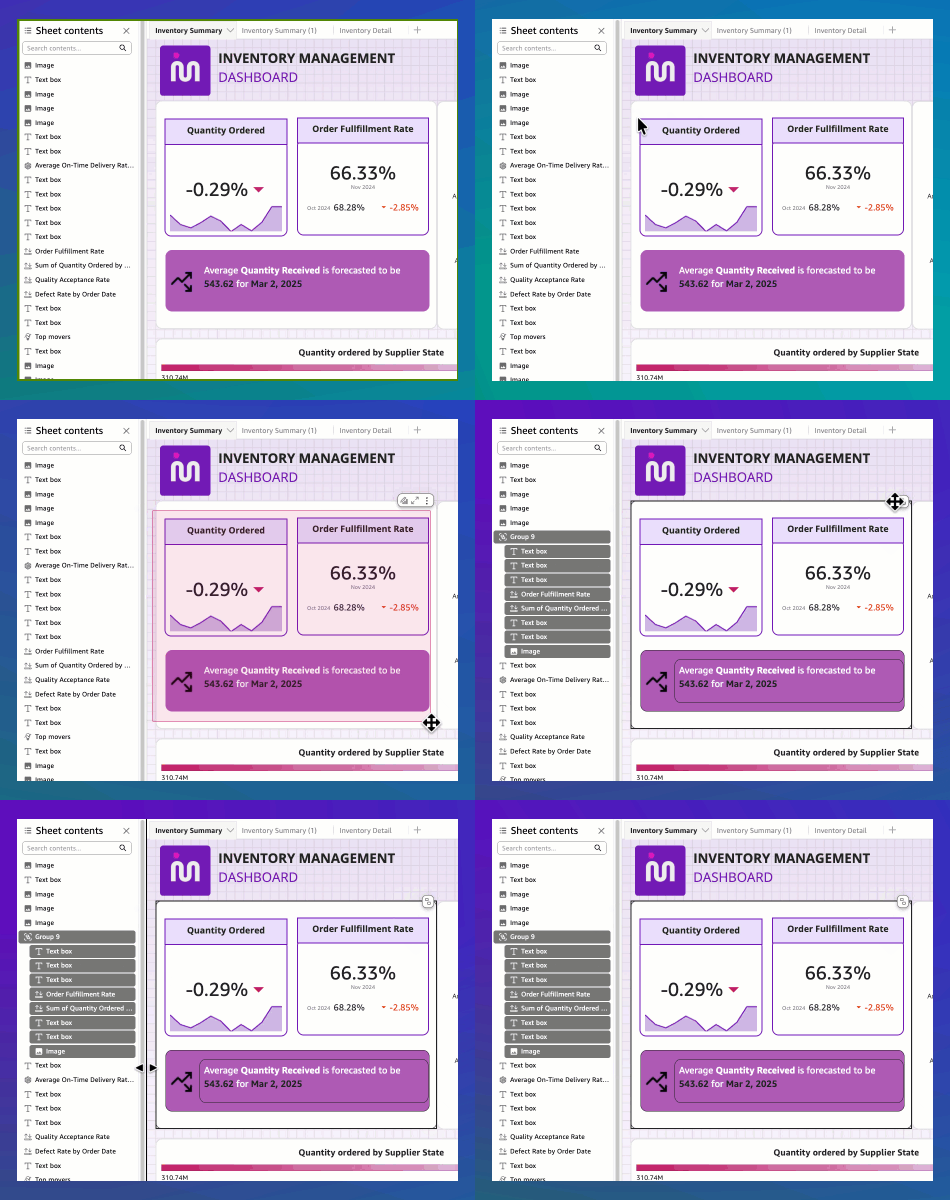
- Hold Shift and select each visual that should stay together (for example, a background rectangle and the KPI visuals on top of it).
- Open the context menu and choose Group.
There is no limit to the number of groups per sheet. Each group is treated as a single visual unit on mobile.
The following animation shows the Amazon Quick authoring view with the right-click context menu and the Group option.
How visuals are sized on mobile
When Mobile Layout renders visuals in the continuous scroll, it applies the following guardrails.
- Each visual fills the full viewport width.
- Aspect ratios are preserved. A tall bar chart stays tall. A wide line chart stays proportionally short.
- A minimum height of 272 pixels means that chart elements (legends, axis labels, sort buttons) remain visible.
- A maximum height cap prevents visuals from exceeding the viewport.
- Tables with many columns render at full width with horizontal scrolling turned on.
If a visual becomes too short to render its internal elements, an informational icon appears. The reader can switch to Desktop mode or rotate to landscape to view the full visual.
Get started
Mobile Layout removes the need to pinch and zoom on dashboards designed for desktop screens. It’s available today in Amazon Quick. To try it out by following these steps.
- Open a Free Form dashboard on your phone or tablet using the Quick mobile app.
- Scroll through your visuals in the continuous scroll view.
- Use the view switcher to toggle between Mobile, Desktop, and Landscape modes.
- If you have overlapping visuals, open your analysis, select them, open the context menu, and choose Group.
The following image shows the view switcher control on the mobile app.
For more information, see the following resources:
We welcome feedback through the Quick console feedback mechanism.