AWS for M&E Blog
How the NBA and AWS built an AI system to measure what actually wins basketball games
Traditional basketball statistics capture what happened—points, rebounds, assists—but miss the context that determines game outcomes. A missed shot that draws three defenders and creates an open corner three-pointer generates zero points for the passer in the box score yet fundamentally shifts win probability. A rebound is a rebound in the box score, whether it’s a routine grab in garbage time or a game-securing defensive board with seconds left.
“Traditional stats capture outcomes,” explains Noah Thro, Software Engineer for NBA Stats Technology. “What makes Leverage Score unique is that it captures why those outcomes happened and who made them possible.”
The NBA and Amazon Web Services (AWS) developed Leverage Score—the newest stat from Inside the Game powered by AWS—to measure which players and possessions drive basketball game outcomes. The AI-powered system uses counterfactual modeling to analyze alternative scenarios for each possession, allocating credit across all ten players on court within seconds of each possession ending.

Figure 1: NBA fans watch clutch shot attempt.
Why Leverage Score matters for fans
The key principle of Leverage Score is that not all plays are created equal. “You can have a player you know is a great rebounder that doesn’t show up in the stat sheet,” Thro notes. “You can sort by rebounding leverage and find the player securing the important rebounds and finishing the game for his team.” The system operates on a −10 to +10 scale, with values accumulating throughout the game to identify which players generated the highest-leverage moments.
“The ability to say at halftime, ‘The Thunder are up by 10, and this player is driving the momentum because he’s made a couple clutch shots’—we’ve never been able to quantify that.” Thro explains. Because every value ties to a specific play-by-play event, the system can surface the highest leverage moments as natural highlights. “We all have seen game winners,” says Ian McKiernan, Senior Lead Product Manager of NBA Stats Platform & Operations. “But securing that defensive rebound when an offensive rebound gives the other team a chance to score—leverage is created in that boxout.”
Architecture overview
Measuring leverage and adding attribution requires more than a single model—it demands an ecosystem of AI systems coordinated in real time. The system runs on Amazon Elastic Kubernetes Service (Amazon EKS) with Amazon Managed Service for Apache Flink processing approximately 2,500 events per second during peak load across more than 10 simultaneous games.
The architecture uses:
- EKS clusters with auto scaling (more than 3–15 replicas based on game load)
- Apache Flink for stream processing with parallelism of 8- and 30-second checkpoint intervals
- Amazon Simple Storage Service (Amazon S3) for model artifacts and historical data storage
- Amazon DocumentDB (with MongoDB compatibility) for possession-level metadata and results
- AWS Direct Connect and AWS Cloud WAN for low-latency connectivity to NBA arenas
- Virtual private cloud (VPC) endpoints for secure service-to-service communication
The system achieves 15 MB per second aggregate data throughput with current latency of 10–12 seconds for Shot Difficulty calculations, with ongoing optimization targeting subsecond response times.
The following diagram illustrates the solution architecture.
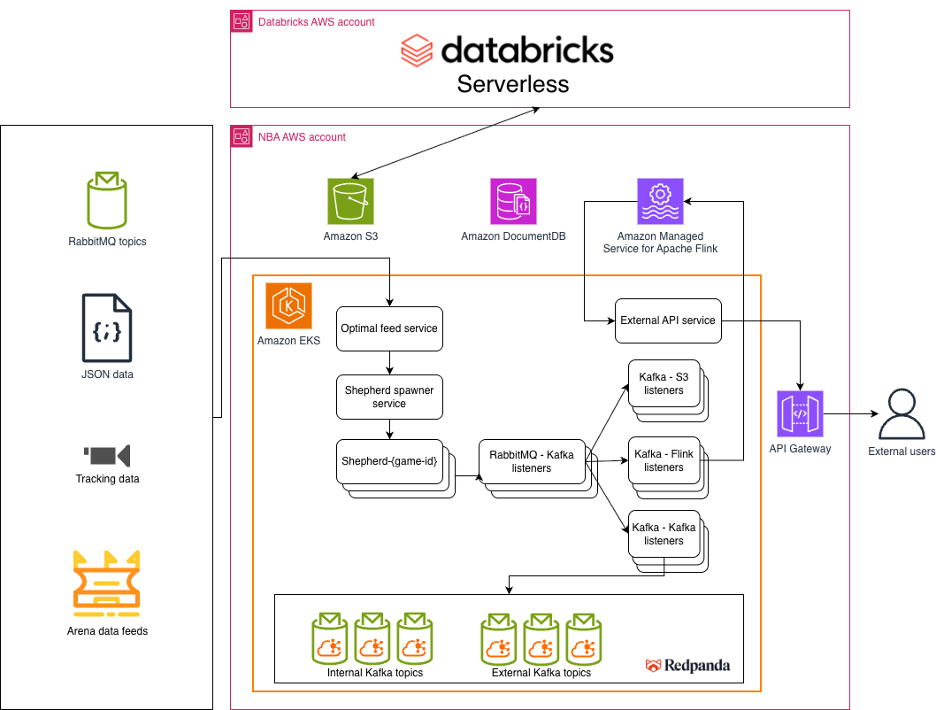
Figure 2: NBA stats architecture diagram.
Real-time processing pipeline
Amazon EKS orchestrates the core processing pipeline, running containerized microservices that ingest, transform, and analyze NBA tracking data in real time. Each possession generates multiple event streams, such as player positions, ball location, shot attempts, and defensive pressure metrics, that must be joined and processed within seconds.
Apache Flink handles event-time stream processing, joining Shot Difficulty calculations with defensive pressure metrics and passing context. The Flink application uses event-time semantics to provide correct ordering even when events arrive out of sequence due to network latency from arena systems.
The pipeline processes three primary data streams:
- Tracking data – Player and ball positions at 25 frames per second
- Event data – Shot attempts, turnovers, rebounds, and other discrete actions
- Contextual metrics – Shot Difficulty (xFG%), defensive pressure, and passing sequences
Flink’s parallel processing capabilities enable the system to run counterfactual inference for 3–5 alternative scenarios per possession while maintaining real-time performance. The application uses Amazon Elastic Compute Cloud (Amazon EC2) instances that scale automatically based on the number of active games.
Win probability model and counterfactual scenarios
Leverage Score diverges from traditional win probability metrics with counterfactual scenarios. When a player makes a shot that increases their team’s win probability from 50% to 60%, most systems would award 10 percentage points of credit. Leverage Score runs a different calculation. “We’re not looking from the start of possession to the end,” McKiernan explains. “We’re looking from the action that occurred to the counterfactual of that action occurring. So, if a shot is made and probability shifts to 60%, but had the shot missed the probability would be 48% because the other team now has the ball—we’re measuring that gap.”
The technical challenge is generating these counterfactuals quickly enough for near real-time use. For each meaningful event, the system must score multiple versions of the game state, evaluate realistic alternatives that respect basketball logic, and compare trajectories—all while play continues. “We have to run inference multiple times for any given play and produce an answer,” Thro notes. “That inference speed, reliability, and networking speed between those systems talking to each other in Amazon EKS is super important.”
At the core of Leverage Score is a Light Gradient Boosting Machine (LightGBM) model trained on three seasons of NBA data—about 3,700 games and 500,000 possessions. The model predicts win probability based on seven primary engineered features including score differential, time remaining, possession count, and timeout availability. For each possession, the system runs parallel batch inference within Flink to generate counterfactual scenarios: What if the shot had missed? What if the offensive rebound hadn’t occurred? What if the turnover had been avoided? Each scenario produces a win probability delta that quantifies the possession’s impact.
The model architecture separates win probability prediction from credit attribution, enabling the system to evaluate alternative outcomes without retraining.
For example, when a player makes a contested three-pointer, the system calculates:
- Actual outcome – Win probability increased by 4.2%
- Counterfactual (miss) – Win probability would have decreased by 1.8%
- Net leverage – More than 6.0 points allocated between all 10 players, with majority to shooter and shot creator
This approach captures impact beyond traditional statistics. A defensive stop that prevents a high probability shot generates positive leverage even though it produces no counting stats. An offensive rebound that extends a possession receives credit proportional to the expected value of the additional possession.
Credit attribution with Shot Difficulty integration
“The thing that unlocked Leverage Score for us was the other Inside the Game metrics,” Thro explains. “Expected field goal percentage sits at the core because it allows us to quantify the value of the shot and distribute that to the creator versus the shooter.” Expected Field Goal Percentage (xFG%), another metric from Inside the Game, measures shot difficulty by analyzing defender proximity, shot location, and shooter skill.
And crucially, all five players on each team receive some portion of the credit. Allocating credit across ten players requires integrating multiple contextual signals. Leverage Score uses xFG% to intelligently distribute credit between shot creators and finishers. When a player makes a difficult shot (low xFG%), the shooter receives higher credit allocation. When a player makes an open shot (high xFG%), the system traces back through passing sequences to credit the player who created the opportunity.
The attribution algorithm accounts for:
- Creation leverage – Generating high-quality shot opportunities through passing, screening, or drawing defensive attention
- On-ball defense leverage – Contesting shots, forcing turnovers, or preventing high-percentage attempts
- Rebounding leverage – Securing offensive rebounds that extend possessions or defensive rebounds that end opponent possessions
- Turnover leverage – Protecting the ball on offense or forcing turnovers on defense
The system processes these calculations within the Flink pipeline, joining Shot Difficulty results with possession outcome data to produce final Leverage Scores. This integration required careful event-time windowing to ensure Shot Difficulty calculations are completed before credit attribution begins. From an engineering perspective, the hardest part isn’t any single model—it’s making multiple complex systems talk to each other under severe latency constraints.
Production deployment and scaling
The production system uses blue-green deployment patterns managed through MLflow experiment tracking on Databricks on AWS. New model versions undergo shadow mode testing, where they run in parallel with production models, generating predictions that are logged but not published. This approach enables validation against live game data before cutover.
Amazon EKS auto scaling responds to game schedules, scaling up clusters 30 minutes before tip-off and scaling down during off-peak hours. The system maintains minimum capacity for development and testing environments while supporting burst capacity for high-volume game nights (more than 10 simultaneous games).
Latency optimization focused on three areas:
- Parallel inference – Running counterfactual scenarios concurrently rather than sequentially
- Model optimization – Reducing LightGBM tree depth while maintaining accuracy
- Stream processing tuning – Adjusting Flink checkpoint intervals and parallelism to balance throughput and latency
Ongoing work includes model quantization, inference optimization on GPU-enabled instances, and architectural changes to enable speculative execution before Shot Difficulty results arrive. To accelerate that work, the team uses Amazon Bedrock for generative AI assistance to suggest code for data pipelines, generate boilerplate for experiments, or draft documentation that humans then review and refine.
Reusable pattern for impact analysis
On the surface, Leverage Score is a number attached to possessions and aggregated for players. In practice, it represents a template for a new generation of sports analytics. The Leverage Score architecture represents a reusable template for real-time impact analysis beyond sports. The core pattern—streaming data ingestion, parallel counterfactual inference, and multi-entity credit attribution—applies to any domain requiring fast scenario analysis to identify which specific actions drive outcomes. For example, manufacturing quality control could use similar architecture to attribute defects across production line stages. Supply chain optimization could allocate credit for on-time delivery across logistics partners. Customer service operations could measure which interventions most effectively resolve issues.
Partnering with AWS, the NBA can focus on basketball expertise—defining what leverage means, determining credit allocation rules, deciding which model outputs matter—while relying on proven cloud infrastructure for scale, reliability, and the split-second coordination that makes real-time counterfactual inference possible. For the NBA, Leverage Score represents the first expression of this approach. It combines years of basketball knowledge with AI systems to deliver a new class of impact metric and a clearer, data-driven answer to a timeless question. As Thro puts it: “Who truly changed the game?”
Contact an AWS Representative to find out how we can help accelerate your business.