Networking & Content Delivery
Gain visibility into client-side network failures with NEL
When your user experiences a connectivity issue visiting your website, it’s unlikely that you’ll see a trace of it in your server logs. DNS resolution failures happen before your user ever connects to your server. TCP timeouts, on shared infrastructure such as Content Delivery Networks (CDNs), are difficult to attribute to a specific origin. Even for errors that do reach your infrastructure, such as TLS handshake failures, managed services don’t always surface that level of visibility.
From the perspective of your infrastructure, nothing happened. However, your user had a broken experience. This is the gap that Network Error Logging (NEL) addresses.
In this post, we walk through what NEL is, how it works, and how to build a fully serverless NEL report collection and analytics pipeline on AWS using Amazon API Gateway, Amazon Data Firehose, AWS Lambda, Amazon Simple Storage Service (S3), and Amazon Athena. We provide you with a production-ready pipeline that you can deploy end-to-end using AWS Cloud Development Kit (AWS CDK), including ingestion, storage, analytics, and observability components.
What Is Network Error Logging?
Network Error Logging is a World Wide Web Consortium (W3C) browser API that instructs supporting browsers to automatically detect, collect, and report network-level errors to a designated HTTPS endpoint. Unlike server-side observability tools, NEL captures network failures that occur before a request reaches your infrastructure. You configure NEL by adding two HTTP response headers from your origin or CDN:
| Report-To | NEL |
|---|---|
| declares the collector endpoint group | defines the reporting policy |
{"group": "nel-endpoint", "max_age": 86400, "endpoints": [{"url": "https://YOUR-API-ENDPOINT/"}]} |
{"report_to": "nel-endpoint", "max_age": 86400, "include_subdomains": true, "success_fraction": 0.0, "failure_fraction": 1.0} |
After a browser receives and caches these headers, it monitors network fetches to your origin. When it detects a failure, or optionally a success, it queues a structured JSON report and delivers it to your collector on the next available opportunity. Through the failure_fraction and success_fraction parameters, you can control the sampling rate of reported failed and successful network requests, allowing you to balance data volume with the cost of your reporting pipeline. While most information from successful requests is already available in server-side logs, sampled success reports can still provide valuable client-side insights, such as elevated latency or network path issues that are not visible from the server.
Each report contains useful information such as Error type (such as dns.name_not_resolved, tcp.timed_out, tcp.refused, http.error), Error phase (such as dns, connection, or application), and Server IP. The following is an example NEL report:
{
  "age": 20,
  "type": "network-error",
  "url": "https://example.com/previous-page",
  "body": {
    "elapsed_time": 18,
    "method": "POST",
    "phase": "dns",
    "protocol": "http/1.1",
    "referrer": "https://example.com/previous-page",
    "sampling_fraction": 1,
    "server_ip": "",
    "status_code": 0,
    "type": "dns.name_not_resolved",
    "url": "https://example-host.com/"
  }
}
Note that NEL is currently an experimental browser API, supported by Chromium-based browsers such as Chrome, Edge, and Opera. If you’d like to have full coverage of browsers, including Firefox and Safari that do not currently support NEL, you can implement a fallback lightweight client-side script on your webpage to report critical failures for subsequent network requests.
NEL reporting pipeline architecture
The following solution uses AWS serverless services to provide a cost-efficient NEL collection pipeline.
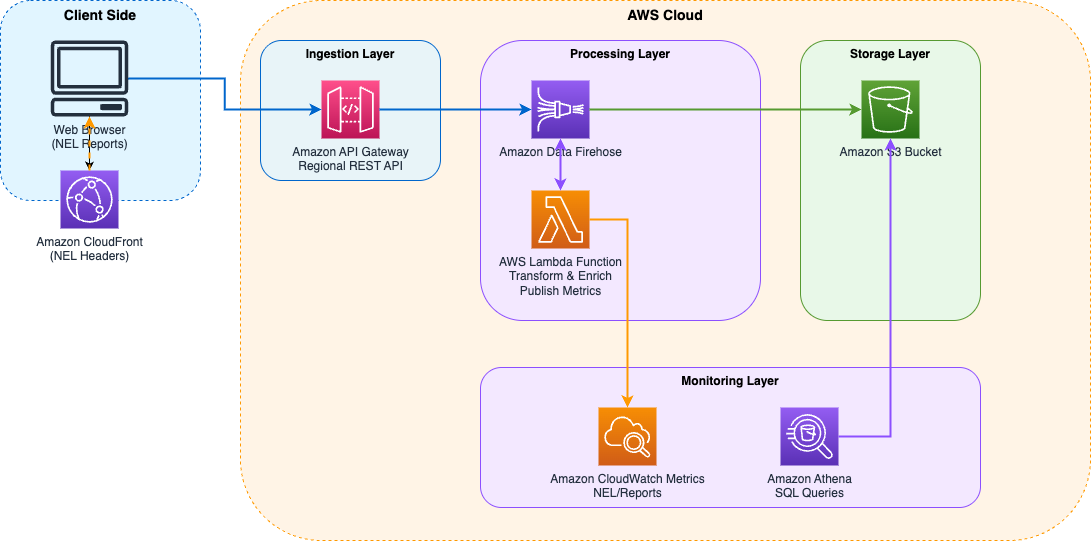
Figure 1 – Architecture of NEL reporting pipeline
NEL reports flow through the components of the solution as follows:
- The browser detects a network error such as DNS failure, TCP timeout, or HTTP error. The browser then generates a NEL report and sends it using HTTP POST method to the report collection endpoint, which it has learned from previously received NEL and Report-To response headers. An Amazon API Gateway REST API serves as the collection endpoint.
- API Gateway applies rules configured in AWS Web Application Firewall (AWS WAF) to help protect the endpoint. The WAF WebACL combines multiple layers of protection: A per IP rate-based rule, IP reputation filtering, filtering harmful inputs (such as Log4j patterns, directory traversal), and request validation based on expected NEL reports format.
- API Gateway forwards incoming reports to Amazon Data Firehose, which validates their schema, and buffers them.
- An AWS Lambda function processes each buffered batch. It adds metadata to records such as timestamp, formats them for storage in Amazon S3, and publishes custom Amazon CloudWatch metrics dimensioned by error type.
- Amazon Data Firehose then delivers processed records to an Amazon S3 bucket. A default lifecycle policy on the S3 bucket deletes objects after 14 days.
- You can configure alarms on the emitted Amazon CloudWatch metric NetworkErrorSubmissions, and when the alarm triggers, you can use Amazon Athena to query NEL reports in S3 using standard SQL. Partitioning reports in Amazon S3 by year, month, and day improves Athena query performance.
Deploy the pipeline
Before you begin, confirm you have the following prerequisites:
- An AWS account with appropriate permissions (create one)
- Node.js 18+ for AWS CDK CLI (download)
- AWS Command Line Interface (AWS CLI) (setup guide)
- AWS CDK (setup guide)
- Git (installation)
Then, follow these steps in your command line to deploy the pipeline with AWS CDK, using the Region and account information configured in your AWS CLI.
git clone https://github.com/aws-samples/sample-nel-solution.git
cd nel-analytics-pipeline
npm install
npm run build
cdk bootstrap
cdk deploy
After a successful deployment, AWS CDK outputs the API endpoint value you’ll need later to set up NEL headers in your web application:
NelAnalyticsPipeline.APIEndpoint = https://abc123xyz.execute-api.us-east-1.amazonaws.com/prod/
Configure NEL headers in your web application
The way you configure NEL headers depends on how you are delivering your web application on the internet. Following AWS best practices, we recommend delivering your web application using Amazon CloudFront.
You can add NEL headers at CloudFront level using a CloudFront Response Headers Policy. This adds the NEL and Report-To headers to responses from your distribution without touching your origin. To add these headers in CloudFront using the AWS Console:
- Navigate to CloudFront → Policies → Response headers
- Choose “Create response headers policy” and name it NEL-Reporting-Policy
- Under “Custom headers”, add the following two headers, after replacing the APIEndpoint with the output value of your AWS CDK deployment, and adjusting the NEL reporting parameters according to your needs:
| Header | Value |
|---|---|
| Report-To | {"group":"nel-endpoint","max_age":86400,"endpoints":[{"url":"https://abc123xyz.execute-api.us-east-1.amazonaws.com/prod/"}]} |
| NEL | {"report_to":"nel-endpoint","max_age":86400,"include_subdomains":true,"success_fraction":0.0,"failure_fraction":1.0} |
- Attach the policy to your distribution: Distributions → [your distribution] → Behaviors → Edit → Response headers policy → NEL-Reporting-Policy.
The above example configuration instructs the browser to use the API Gateway domain name to send NEL reports. Alternatively, you can instruct it to use the main domain name, by creating a dedicated CloudFront cache behavior that points to the API Gateway endpoint.
If you are using AWS Amplify Hosting to serve your web application, you can set NEL headers by following the AWS Amplify documentation. If you are serving your web application directly from Elastic Load Balancing, you need to set NEL headers on your servers, since Elastic Load Balancing does not currently provide this option natively.
Test the solution
Verify that it is working
First, verify that NEL headers are received from your web application using your browser developer tools, or using cURL.
Second, provoke the following errors:
- Navigate to a path in your web application that does not exist, resulting in a 4xx error.
- Change the host file on your local machine to route the domain of your web application to 0.0.0.0, then navigate it to simulate a DNS failure.
Finally, verify that the pipeline is uploading NEL report files to the S3 bucket created during AWS CDK deployment (BucketName), and that you are starting to see data for the NetworkErrorSubmissions metric in Amazon CloudWatch.
Analyze NEL reports with Amazon Athena
Using the AWS Console, navigate to Athena, select the AthenaWorkgroup Workgroup, and run one of the following queries, after changing the date in the WHERE clause:
Error breakdown by type
SELECT
  body.type AS error_type,
  COUNT(*)  AS count
FROM nel_analytics.nel_reports
WHERE year = '2026'
  AND month = '06'
  AND day = '01'
GROUP BY body.type
ORDER BY count DESC;
Most problematic URLs
SELECT
  url,
  COUNT(*) AS error_count,
  ARRAY_AGG(DISTINCT body.type) AS error_types
FROM nel_analytics.nel_reports
WHERE year = '2026'
  AND month = '06'
  AND day = '01'
GROUP BY url
ORDER BY error_count DESC
LIMIT 20;
List errors
SELECT
  url,
  body.type AS error_type,
  body.status_code,
  metadata.received_at
FROM nel_analytics.nel_reports
WHERE year = '2026'
  AND month = '06'
  AND day = '01'
ORDER BY metadata.received_at DESC;
Recent DNS resolution failures
SELECT
  url,
  body.type AS error_type,
  body.elapsed_time,
  metadata.received_at
FROM nel_analytics.nel_reports
WHERE body.type = 'dns.name_not_resolved'
  AND year = '2026'
  AND month = '06'
  AND day = '01'
ORDER BY metadata.received_at DESC
LIMIT 100;
Be aware that you can use Amazon Quick to ask questions in natural language. Quick automatically translates those requests into Athena SQL queries to analyze data.
Cost considerations
The solution cost breaks down into multiple components. The dominant component is the ingestion cost, around $4.5 per million requests:
- $0.6 for AWS WAF request fee
- $3.5 for Amazon API Gateway REST API (first tier), assuming it’s deployed in us-east-1 Region.
- 5 KB × 1M × $0.075/GB = $0.375 per million ingested requests by Amazon Data Firehose in us-east-1. We assumed that the size of ingested reports on each request is below 5 KB.
You can reduce this cost by tuning the sampling fractions. For example, reduce failure_fraction to 0.5 (50%).
There are other minor costs such as:
- A fixed monthly cost of $14 to cover the costs of AWS WAF WebACL and rules.
- A cost for processing batched reports that Amazon Data Firehose ingests. You can update the buffering size/time in Amazon Data Firehose to strike the convenient balance between speed of report delivery and pipeline costs.
- The cost of storing compressed reports in Amazon S3, which you can reduce by tuning the S3 object retention lifecycle in AWS CDK parameters.
- The cost of querying reports in S3 using Amazon Athena depends on the number of queries, and how much data the query scans.
Clean up
If you do not plan to use the deployed solution, make sure you delete the deployed resources by following the steps:
- Empty the created S3 bucket for storing NEL reports
- Delete the created AthenaWorkgroup
- Run the following AWS CDK command:
cdk destroy
Conclusion
Network Error Logging provides observability around client-side network failures that are invisible to your servers. We provide you with a production-grade NEL collection pipeline that you can deploy in minutes using AWS CDK. It’s a serverless solution based on Amazon API Gateway, Amazon Data Firehose, AWS Lambda, and Amazon S3 and Amazon Athena for SQL-based analysis, with no infrastructure to manage.
Next steps:
- Subscribe to Amazon Simple Notification Service (Amazon SNS) topic: to get notified about failures in the pipeline itself, such as high API error rate.
- Set up alerting on network failures: Collecting NEL reports is only useful if you act on them. Since the pipeline publishes Amazon CloudWatch metrics, you can define alarms to detect anomalies. For example, you can create an alarm on a spike in DNS resolution failures (Metric:
NetworkErrorSubmissions, Dimension:error_type = dns.name_not_resolved, Threshold: >100 events in 5 minutes), helping you quickly identify issues such as DNS misconfigurations, outages, or propagation delays.
The full source code is available on GitHub.
About the authors

Achraf Souk
Achraf is a Principal Solutions Architect at AWS with more than 15 years of experience in cloud, security, and networking. He works closely with customers across industries to design resilient, fast, and secure web applications. A frequent writer and speaker, he enjoys simplifying deeply technical topics for a wider audience. Achraf has a track record in building and scaling technical organizations.

Etienne Münnich
Etienne works as a Snr Edge Specialist Solutions Architect, working across organisations across Asia Pacific to improve their web application performance and security. Based in Sydney, Australia, he has fulfilled many roles in tech, which range from systems integrator to cloud engineer, project manager and now a solutions architect. Follow him on X at @etiennemunnich