AWS Public Sector Blog
How to travel safely based on crime patterns using AWS services
Walking in urban areas, especially at night, can be intimidating. Surveys show that 40% of Americans, the highest in three decades, say they are afraid to walk alone at night, and two-thirds avoid certain activities due to fear of crime. Vulnerable groups, including women and children, are affected even more. Similar studies across European countries show a significant share of residents, especially women, report feeling unsafe in their own cities. In Germany, 37.9% of women and 13.1% of men report feeling unsafe walking alone after dark, highlighting a clear gender gap in perceived safety.
Traditional navigation apps prioritize speed and distance, leaving users to navigate through potentially risky neighborhoods without awareness of crime patterns or alternative safer routes.
SafeRoute is a reference application that aims to fill this gap with a crime-aware navigation system that suggests safer routes by analyzing crime data, providing users with a way to report new incidents, and delivering real-time safety features such as SMS alerts and emergency calls, all while maintaining reasonable travel times.
SafeRoute provides municipalities and public sector organizations with a customizable, crime-aware navigation system that can be deployed to serve their communities. This solution enables local governments to leverage their crime data and Amazon Web Services (AWS) services to offer residents safer route alternatives tailored to their specific urban environment.
Solution overview
AWS provides a broad set of managed services that make it easier to build scalable and secure applications without managing infrastructure. SafeRoute demonstrates how these services can be combined to build a crime-aware routing workflow, process geospatial data, analyze crime patterns, generate routes, and deliver notifications.
SafeRoute helps travelers make informed decisions by showing the safety levels of different areas and offering alternative routes based on crime patterns. The system combines historical crime records, recent incident reports, and user preferences to create a safety score and compute the optimal route.
How risk is calculated
When a user requests a route, SafeRoute builds a bounding-box around the route area (from the start to the endpoint as corners). The bounding box is then divided into fixed 500-meter grid cells. Then each cell is assigned a risk score based on two factors, a severity factor and a frequency factor. The severity factor measures the seriousness of the crimes, and the frequency factor measures the number of crimes in that area. The weights are heuristic design choices intended to balance crime severity and frequency, with greater emphasis on severity. For instance, violent crimes are weighted more heavily than property crimes.
The factors are then used in the following equation:
Risk score = 0.7 X severity factor + 0.3 X frequency factor
Using this score, SafeRoute groups areas into four arbitrary levels of risk:
- High Risk (0.75–1.00)
- Medium Risk (0.50–0.74)
- Low Risk (0.35–0.49)
- Safe Area (< 0.35)
Once all cells have an associated score, the system looks at the risk score distribution across the entire city and define a threshold using percentiles. For example, cells within the 95th percentile fall into the high-risk category, while progressively lower percentiles are labeled as medium, low, or safe. These levels help users understand which zones have a higher probability and might require extra caution, by increasing the signal to noise ratio.
Architecture overview
The risk zone algorithm is at the heart of SafeRoute, powered by PostGIS, a geospatial extension of PostgreSQL that supports location-based queries. PostGIS identifies crime clusters, assesses them by severity and frequency, and categorizes them into levels: high-, medium-, or low-risk zones. These zones are displayed as color-coded heatmaps, and Amazon Location Service generates alternative routes that minimize exposure while keeping travel times reasonable.
SafeRoute employs predominantly serverless architecture services that scales automatically with demand. Routing, crime analysis, and reporting are handled by stateless, event-driven services that adjust capacity based on usage. The system processes crime records (e.g. NYPD Shooting Incident Data), computes safe routes, and provides real-time notification features such as in-app risk alerts, optional SMS sending, and emergency contact calling.
The following architecture diagram shows how users interact with the web app.
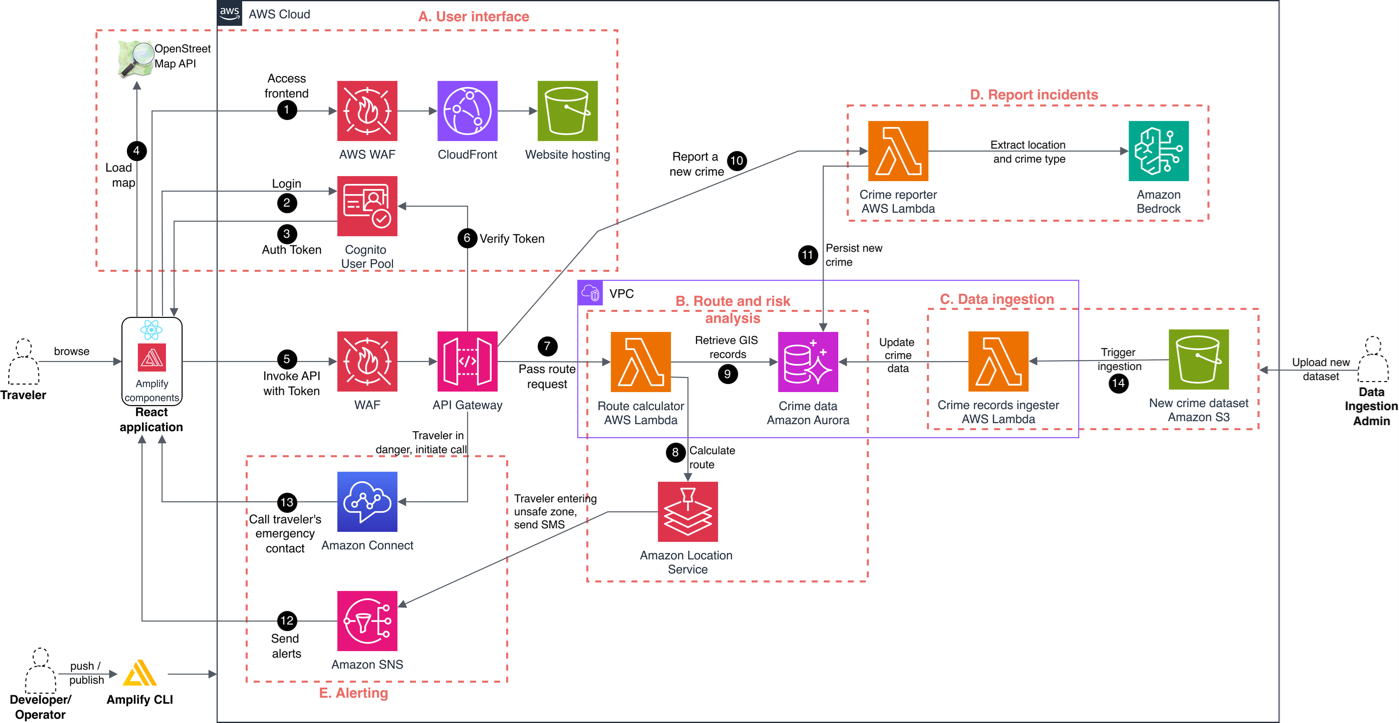
Figure 1: The solution architecture
Sub-systems
The solution contains the following sub-systems, indicated by red letters in the architecture diagram:
A. User interface and authentication
B. Route and risk analysis
C. Data ingestion
D. Report incidents
E. Alerting
Numbers in black circles show flow steps described in the following sections.
User interface and authentication
Users access SafeRoute through a web application (1), fronted by Amazon CloudFront for global distribution. AWS WAF adds an extra layer of protection by blocking unwanted or malicious traffic.
When users sign in (2) to Amazon Cognito User Pool (e.g., via username / password), Cognito issues JSON Web Tokens (JWTs) (3) up successful authentication. After logging in, the React-based frontend loads the OpenStreetMap (4) and allows users to interact with the application’s backend (5).
Secure API access
All backend communication flows through Amazon API Gateway, which serves as the single-entry point for the application’s APIs. API Gateway uses a Cognito User Pool authorizer to validates Cognito tokens (ID tokens or access tokens) (6) and enables authenticated traffic to reach the backend services. API Gateway integrates with AWS WAF to protect the API from common web exploits and bot attacks. Only requests with valid Cognito tokens are authorized and forwarded to the backend services, ensuring that all access is authenticated and follows least-privilege principle. Authorized requests are then forwarded to the backend services. This centralizes access control, simplifies governance, and ensures that all data exchanged between the client and backend services is encrypted in transit.
Core routing and risk analysis
When a user requests directions in the application, the frontend sends the request to Amazon API Gateway, which triggers the route calculator function (7), an AWS Lambda function that performs three key tasks:
- Original route – The Lambda function calls Amazon Location (8) to return the standard route between the origin and destination.
- Safe alternative routes – It queries Amazon Aurora PostgreSQL (9) to retrieve crime data and classify nearby areas into high-, medium-, low-, and no-risk. This classification is computed dynamically by the Lambda function on each request using PostGIS spatial queries, so percentiles and risk levels reflect the latest crime data. To keep request latency low, these queries use PostGIS spatial indexes for efficient lookup. Using this risk information, the Lambda function can generate safer alternative routes that avoid these risk zones. Based on the resulting risk zones, the Lambda function constructs a set of geographic avoidance areas and passes them to Amazon Location Service, which returns alternative routes that avoid these areas.
- Personalized safety routing – If users care more about certain crime types (e.g., prioritizing avoidance of sexual offenses over theft). In that case, the Lambda function adjusts risk scoring and Amazon Location Service produces personalized safe routes based on these preferences.
Crime reporting enhanced by generative AI
After reporting to the law enforcement, users can report new incidents in the app. When a report is submitted, API Gateway triggers the crime reporter Lambda function (10), which uses Amazon Bedrock to parse the natural-language description and extract key details such as crime type and location. The incident is then stored in Aurora PostgreSQL (11). After it’s added, the new crime instantly becomes part of the system’s real-time safety layer:
- Recent crime visibility – The incident appears on the map for 12 hours, keeping safety information fresh and relevant.
- Configurable avoidance – Users can choose to avoid recent crimes by applying a 100–500-meter buffer, which the system incorporates into routing decisions.
- Continuous safety updates – Each new report helps maintain an up-to-date view of local conditions by combining recent incidents with historical crime data.
Real-time safety alerting and emergency support
SafeRoute provides real-time safety awareness through optional notification features that users can enable based on their preferences:
- In-app safety notifications – As users navigate, the app checks their current location against known high-risk zones and displays alerts such as “You are entering a high-risk area,” helping them stay aware as they move.
- SMS alerts through Amazon SNS – If users enable SMS alerts, Amazon Simple Notification Service (Amazon SNS) sends text messages (12) to the user’s mobile phone when entering high-risk areas, which is functional when users can’t actively monitor the app screen.
- Emergency calling using Amazon Connect – For added protection, users can enable emergency contact calls. When activated, Amazon Connect automatically calls (13) the user’s emergency contact, informing them of the user’s current location and that the user might need assistance.
Data ingestion and synchronization
SafeRoute can be used for any city, municipality or state. By importing historical crime dataset, the system calculates risk-zones for the specific geography. When a new dataset is uploaded to Amazon Simple Storage Service (Amazon S3), an ingestion Lambda function is automatically invoked (14). This function validates input files, loads them into Aurora PostgreSQL, and uses PostGIS geospatial indexing to enhance query performance by organizing crime data into an efficient searchable structure. This automated pipeline seamlessly integrates newly uploaded datasets with routing and analysis workflows.
How to use the app
Travelers and residents who want to safely navigate an area in your jurisdiction can complete the steps in this section to use the SafeRoute app. When users first open SafeRoute, they see an interactive map interface, with the route planner on the left of the screen and the map on the right, as shown in the following screenshot.
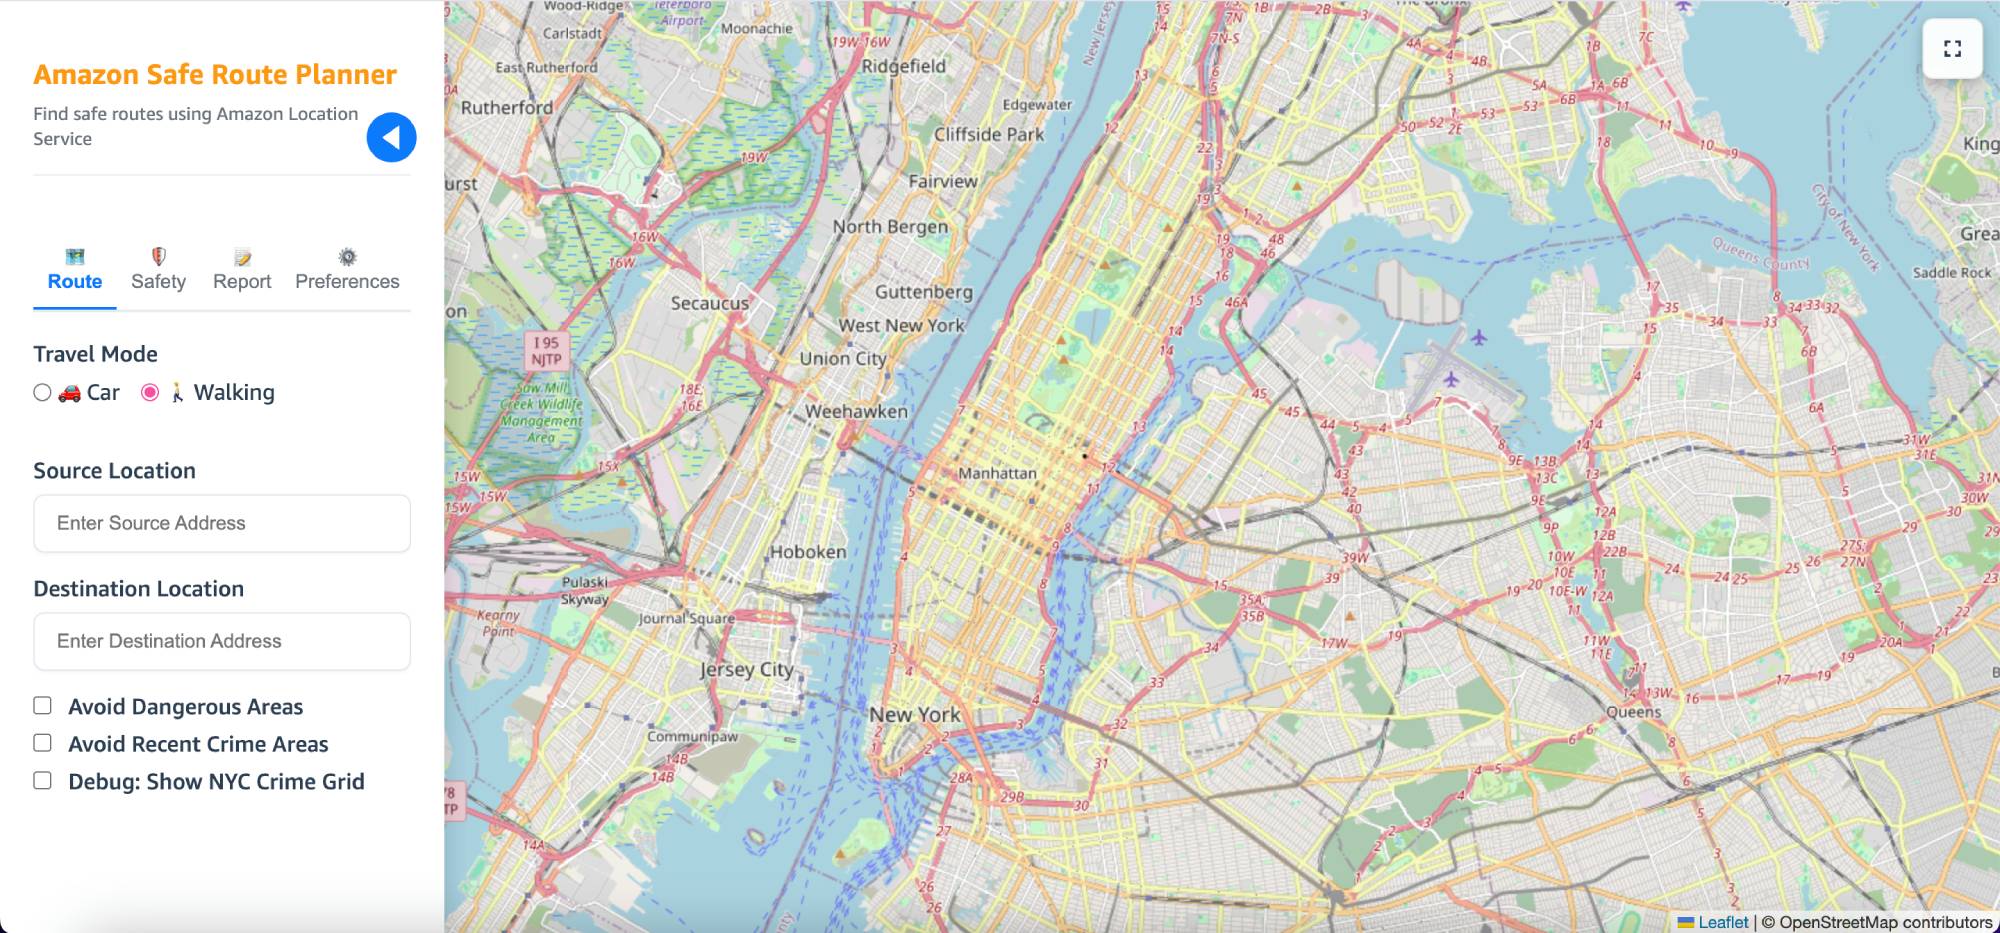
Figure 2: SafeRoute route planner interface
To use the app, residents and visitors to your area can follow these steps:
1. To request a route, under Travel Mode, select Car or Walking.
2. In the Source Location field, enter the coordinate starting point or select on the map. In the Destination Location field, enter the destination or select on the map, as shown in the following screenshot. The app first shows the regular route without any safety modifications. If there are any recent crimes along the route, those incidents will be displayed on the map to help users understand current conditions.
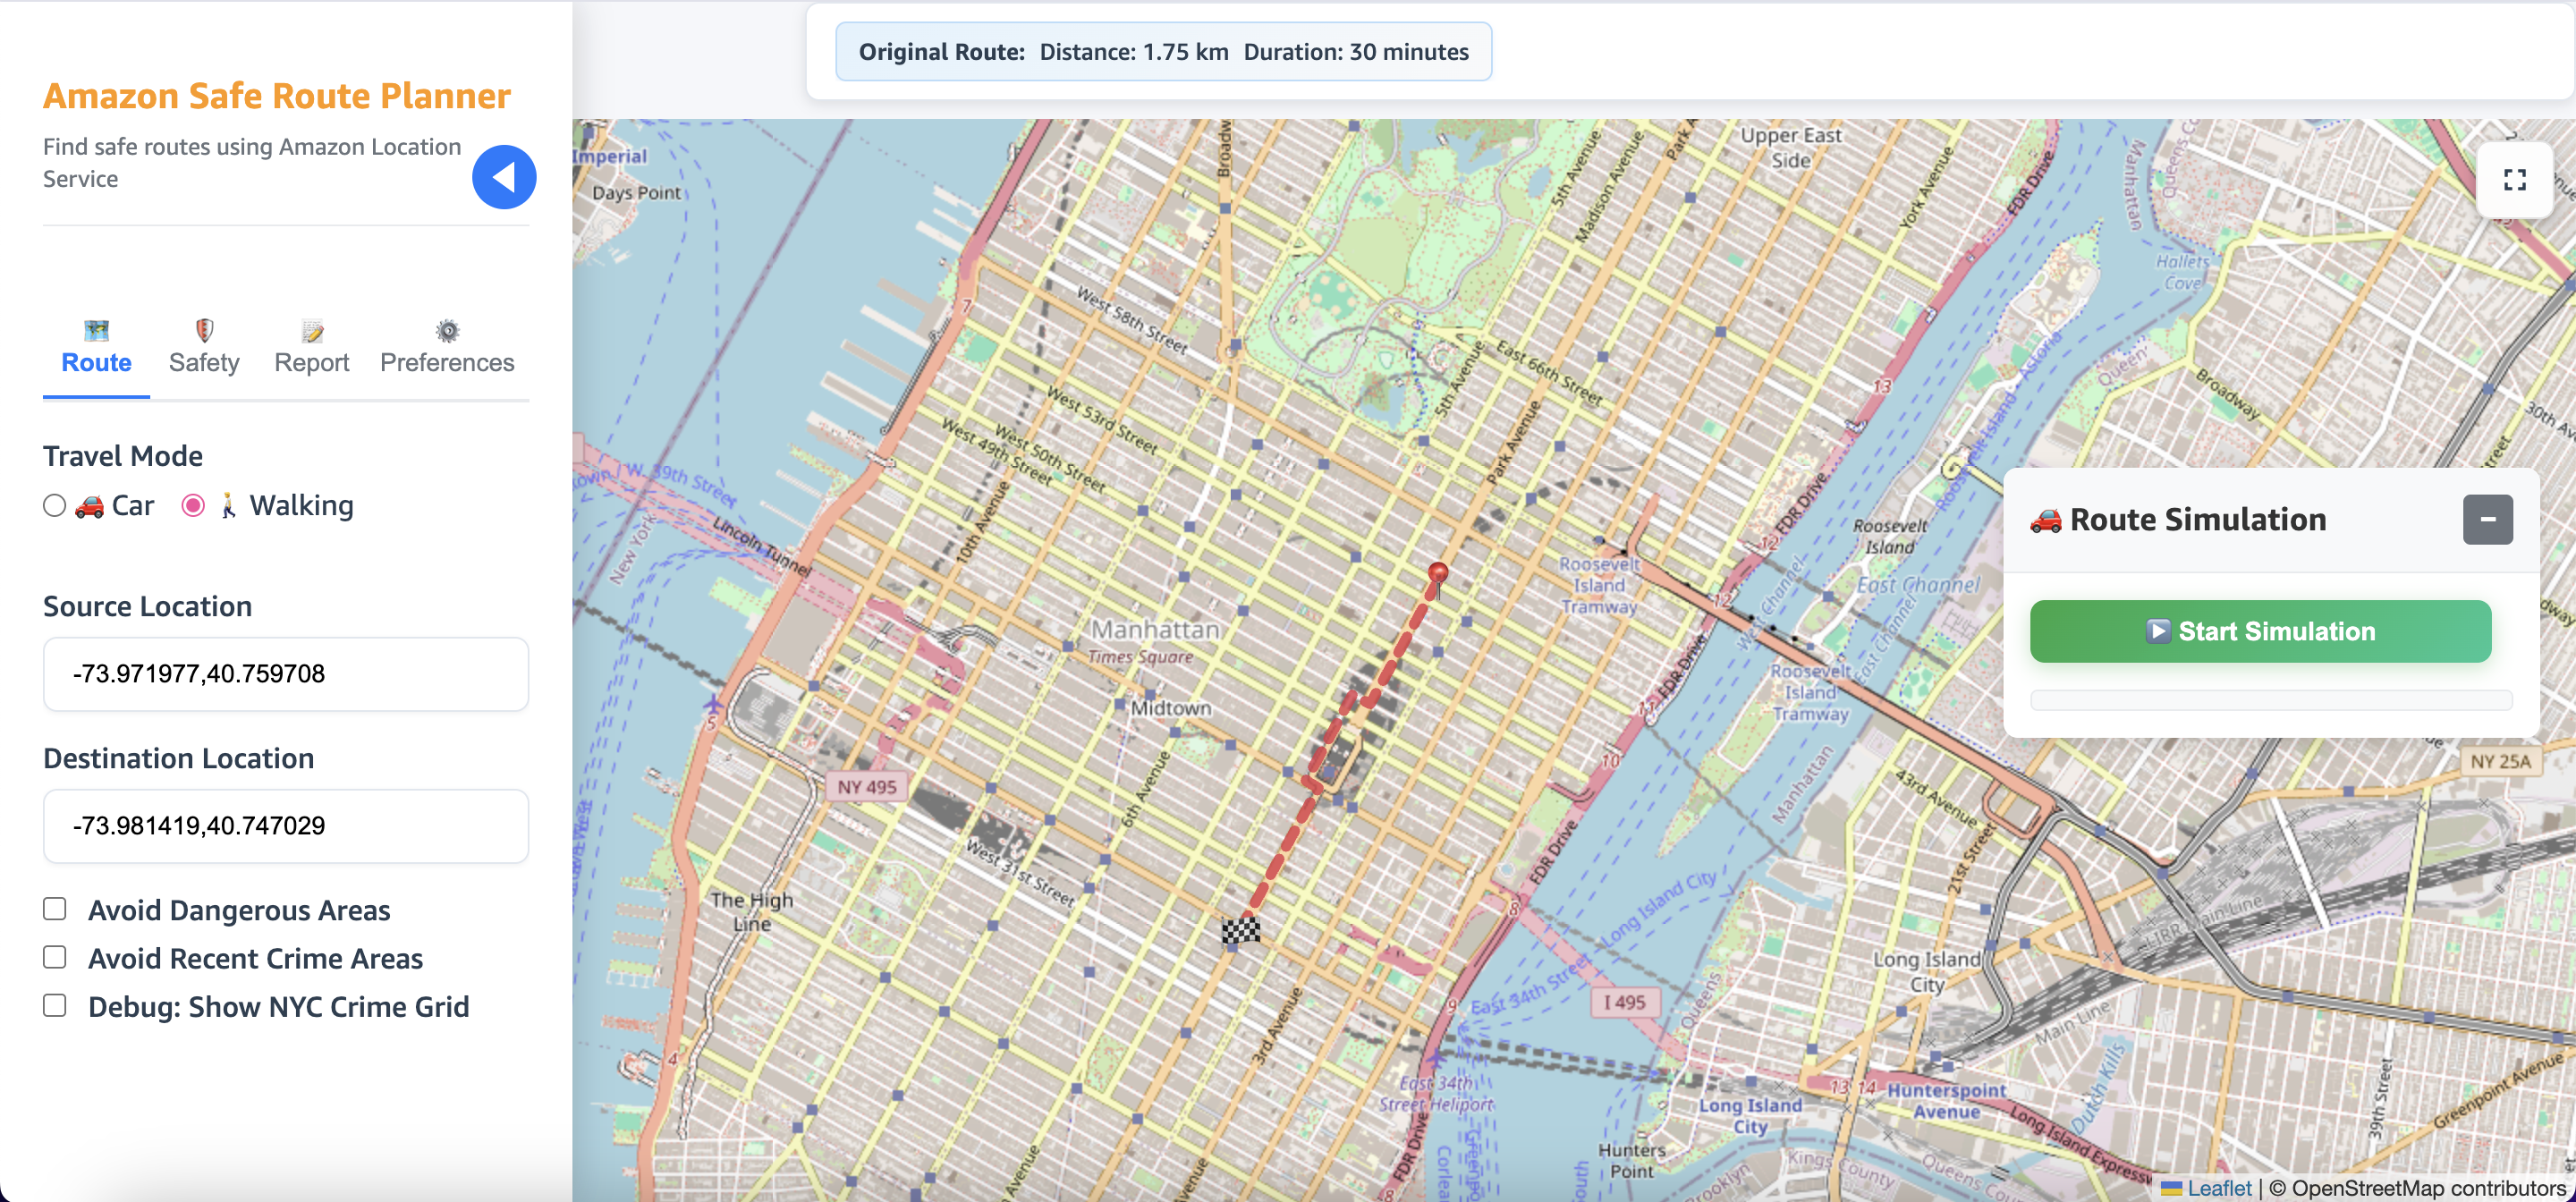
Figure 3: Travelers enter the travel mode, source, and destination
3. To enable safer routing, users can select Avoid Dangerous Areas and Avoid Recent Crime Areas. When either of these features are enabled, the app highlights high-, medium-, and low-risk areas based on crime data. SafeRoute then suggests alternative routes that avoid or reduce travel through these shaded zones, as shown in the following screenshot.
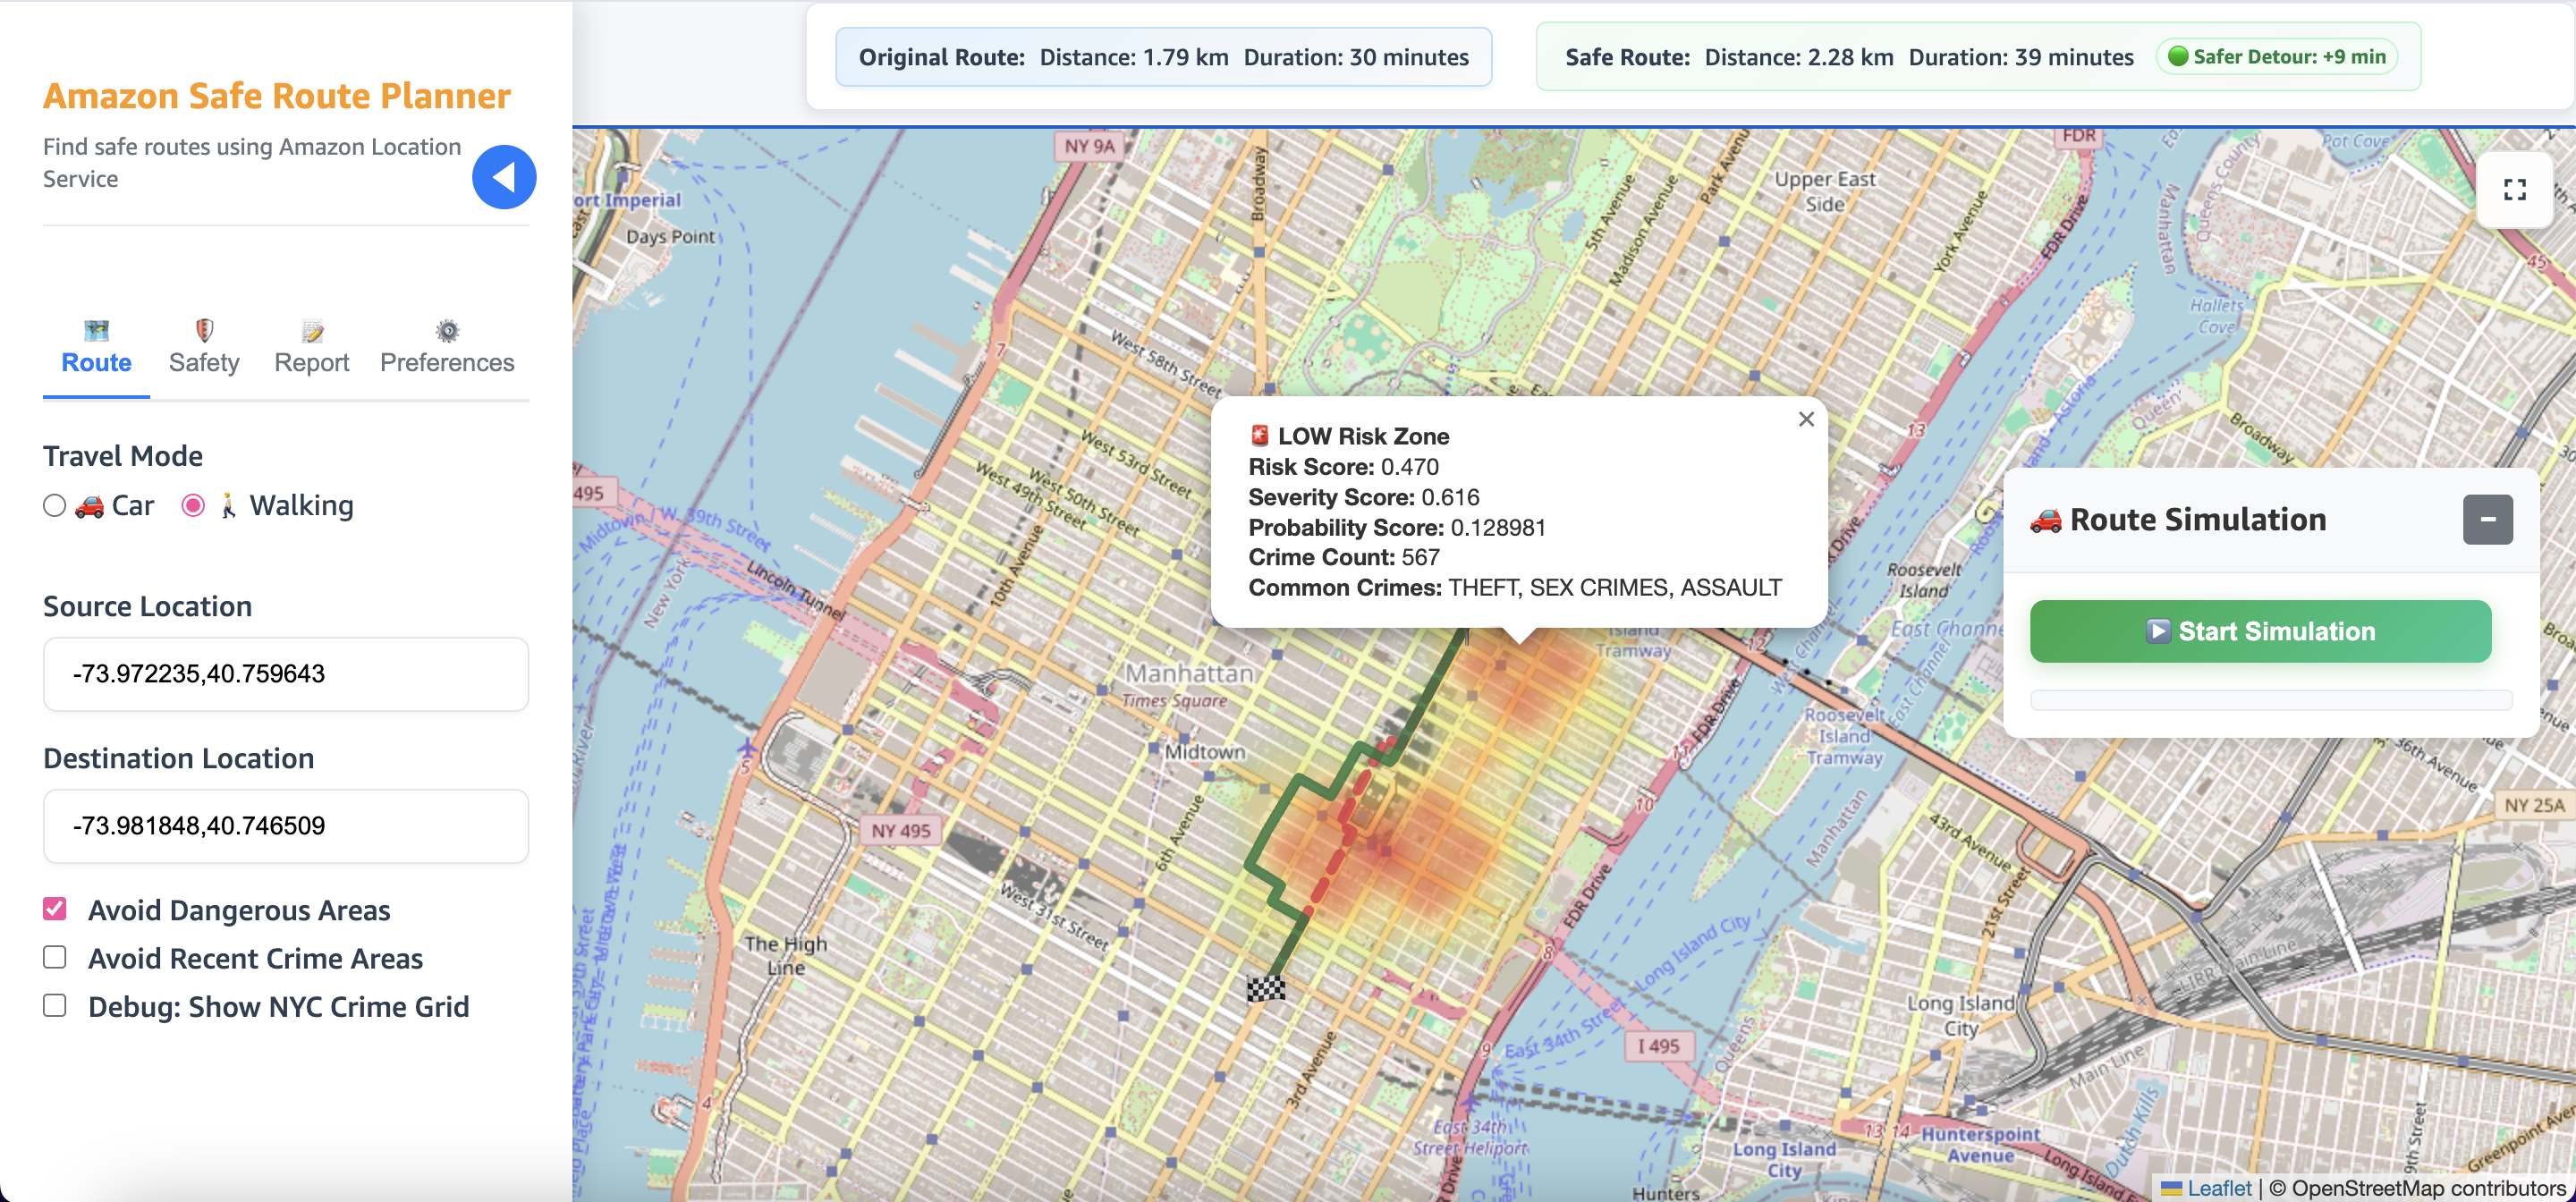
Figure 4: Turn on features to avoid dangerous areas
4. On the Preferences tab, users can customize how the system scores risk. For example, someone might want to avoid certain crime types more than others. SafeRoute uses these preferences to adjust its calculations and offer personalized route suggestions.
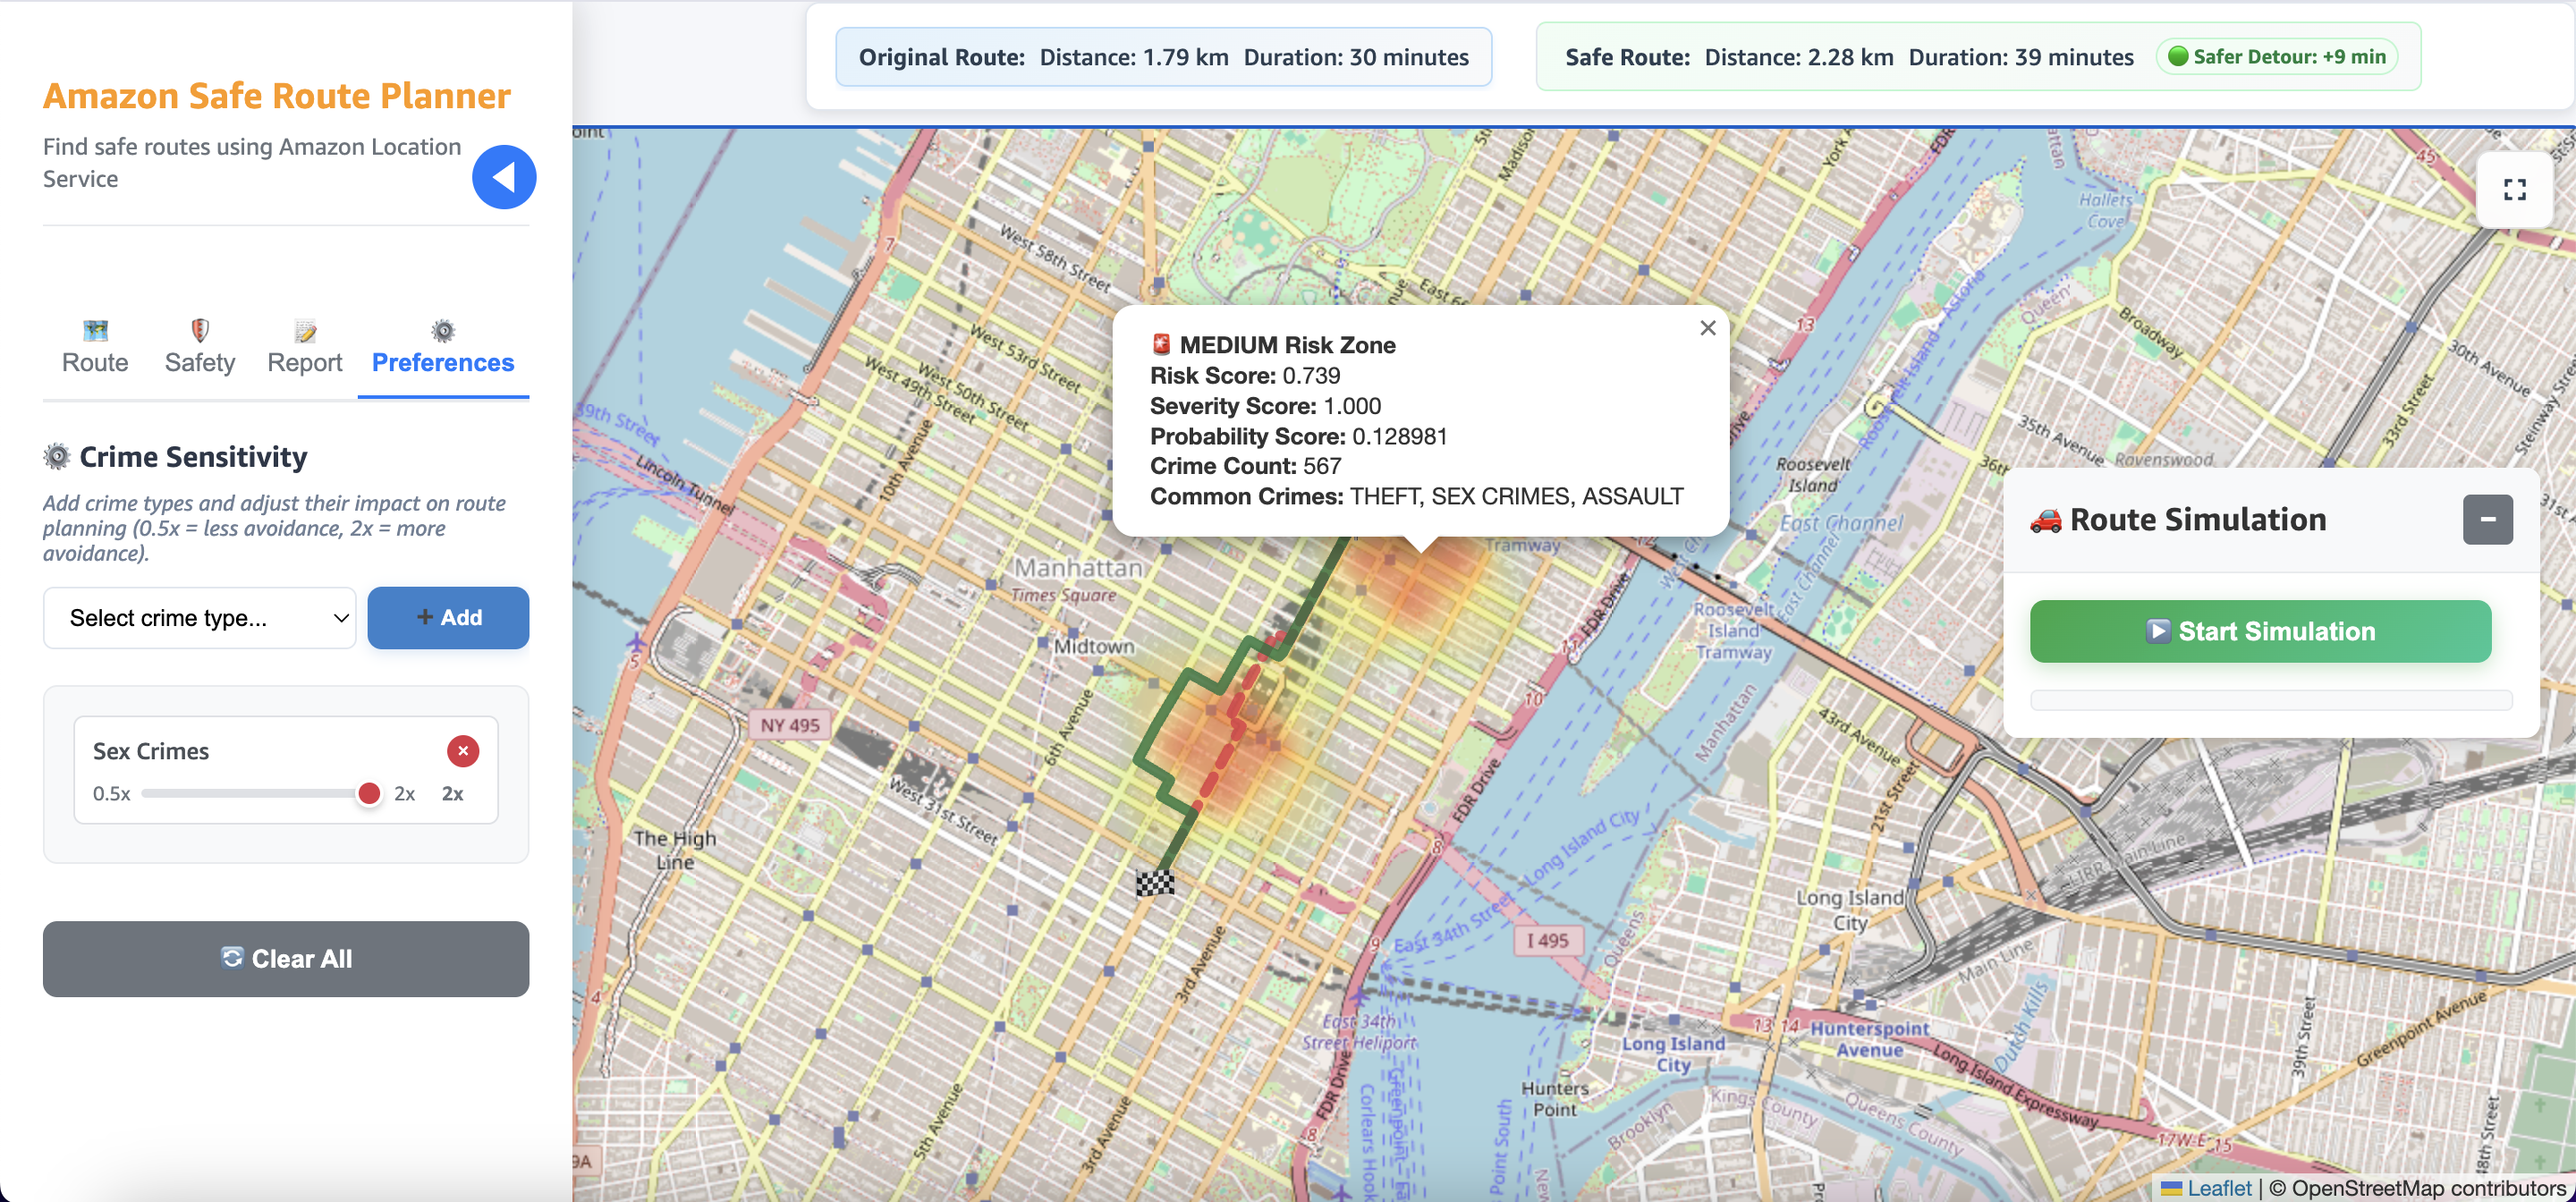
Figure 5: Customize score risk to prioritize avoiding certain crime types
5. If users witness an incident, they can report it directly in the app. On the Report tab under Crime Description, they type what happened, and the system identifies the crime type and location. Reported crimes appear for 12 hours as recent crimes, keeping the information fresh for other travelers.
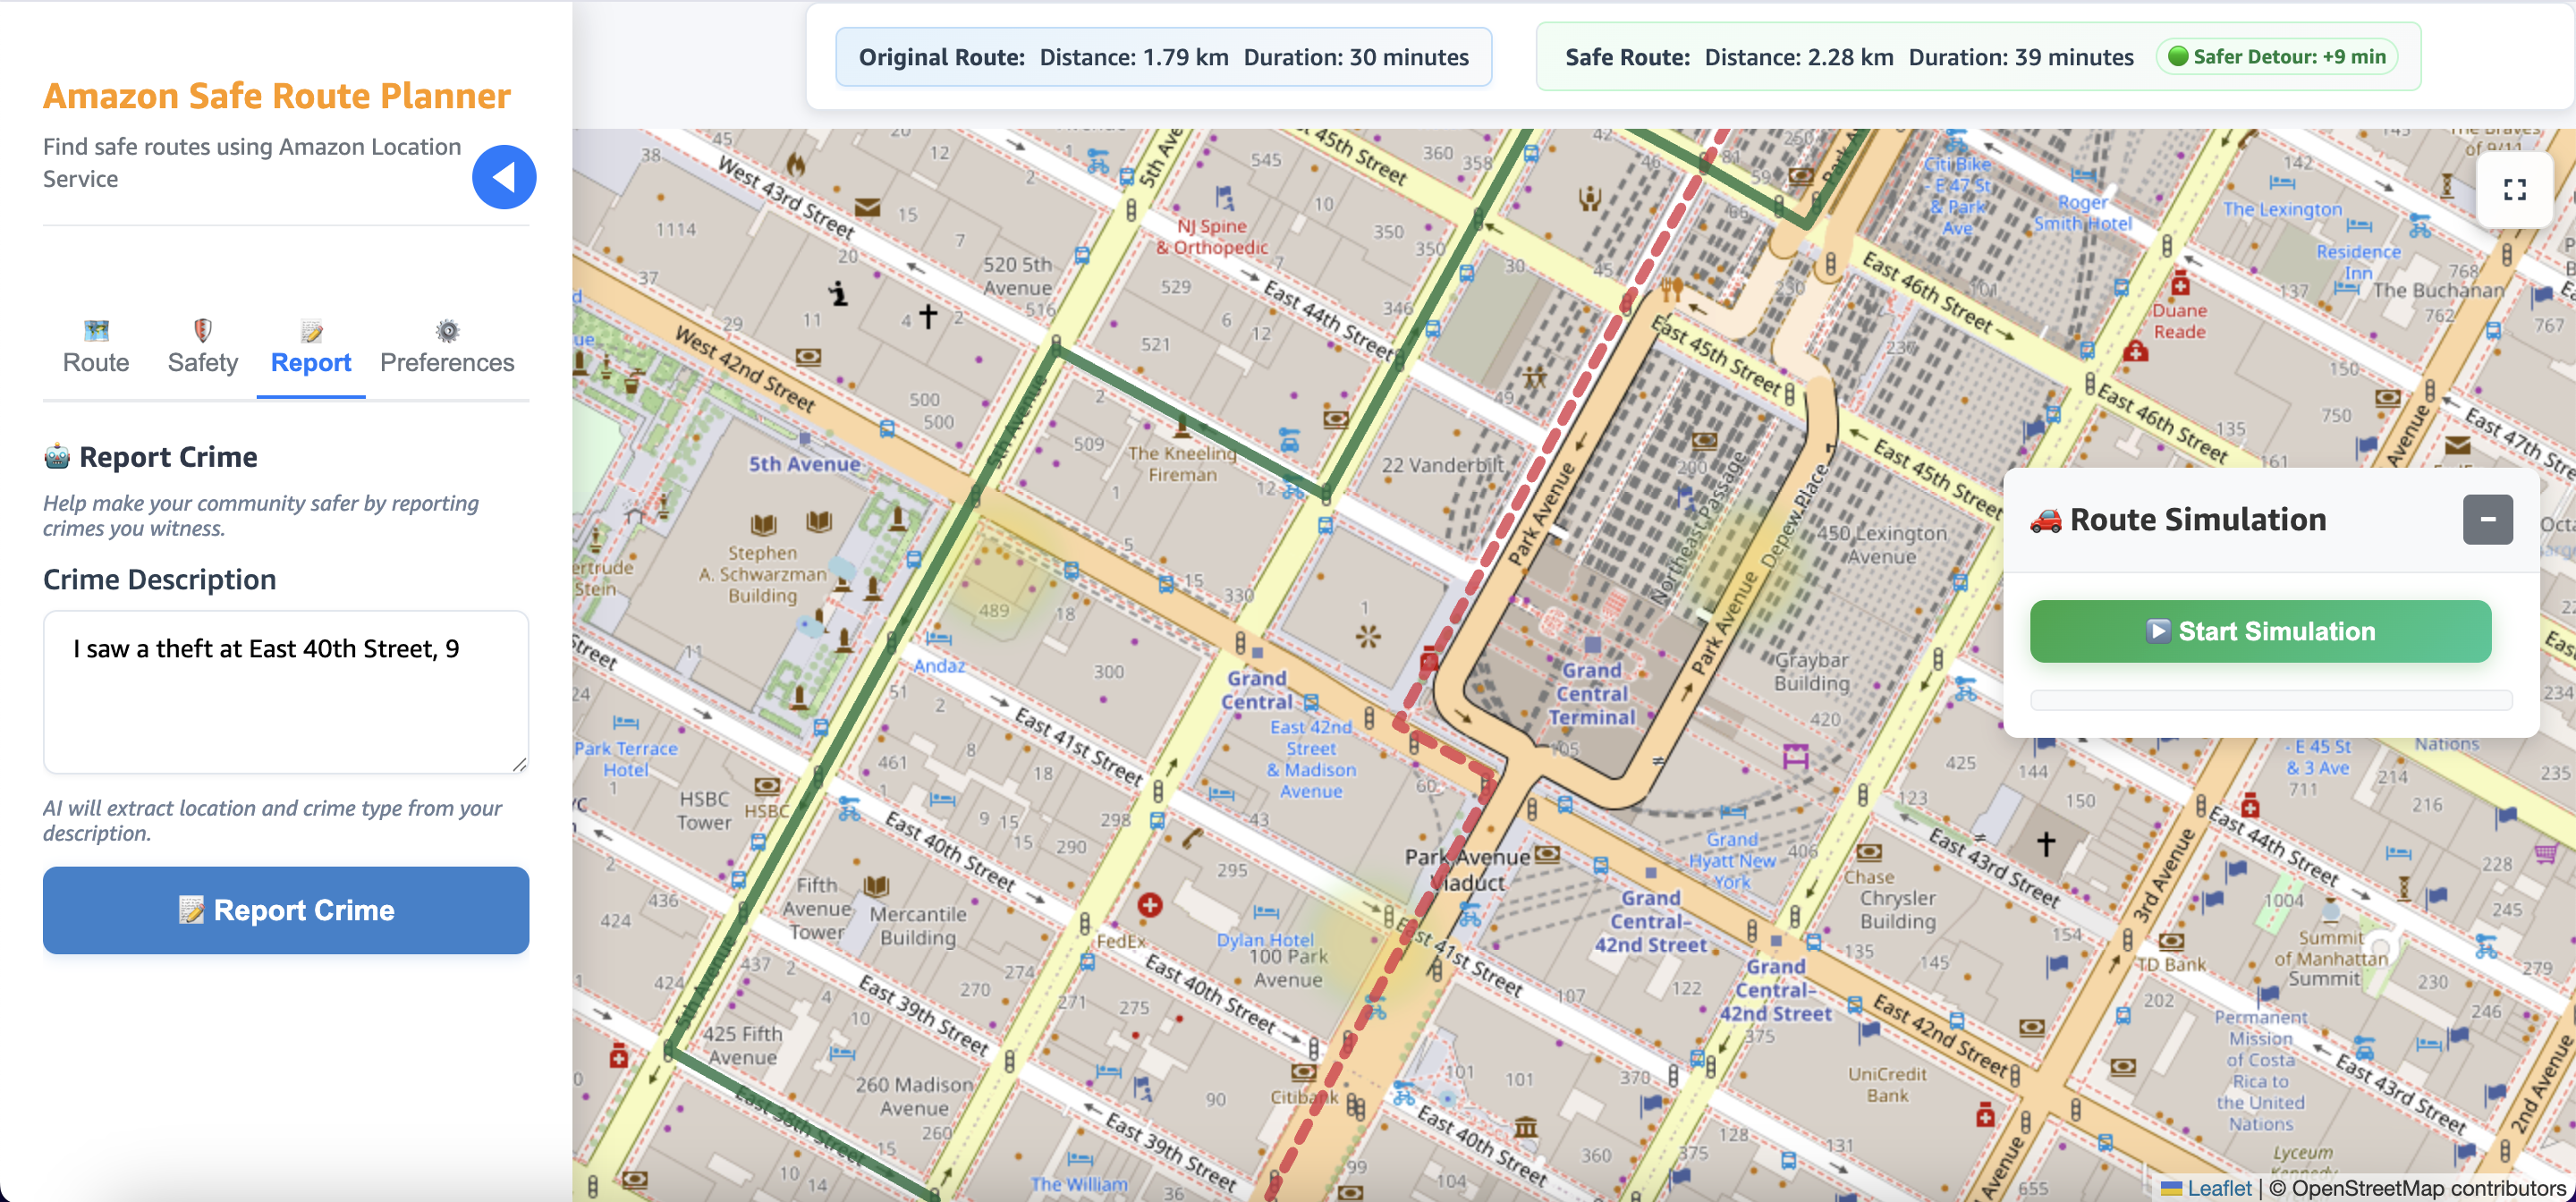
Figure 6: Users report witnessed incidents to provide feedback on recent crimes for other travelers
6. After seeing newly reported crimes along their route, users can select an avoidance distance on the Route tab under Avoidance Area Size. The app adjusts the path to avoid these areas by the distance you select.
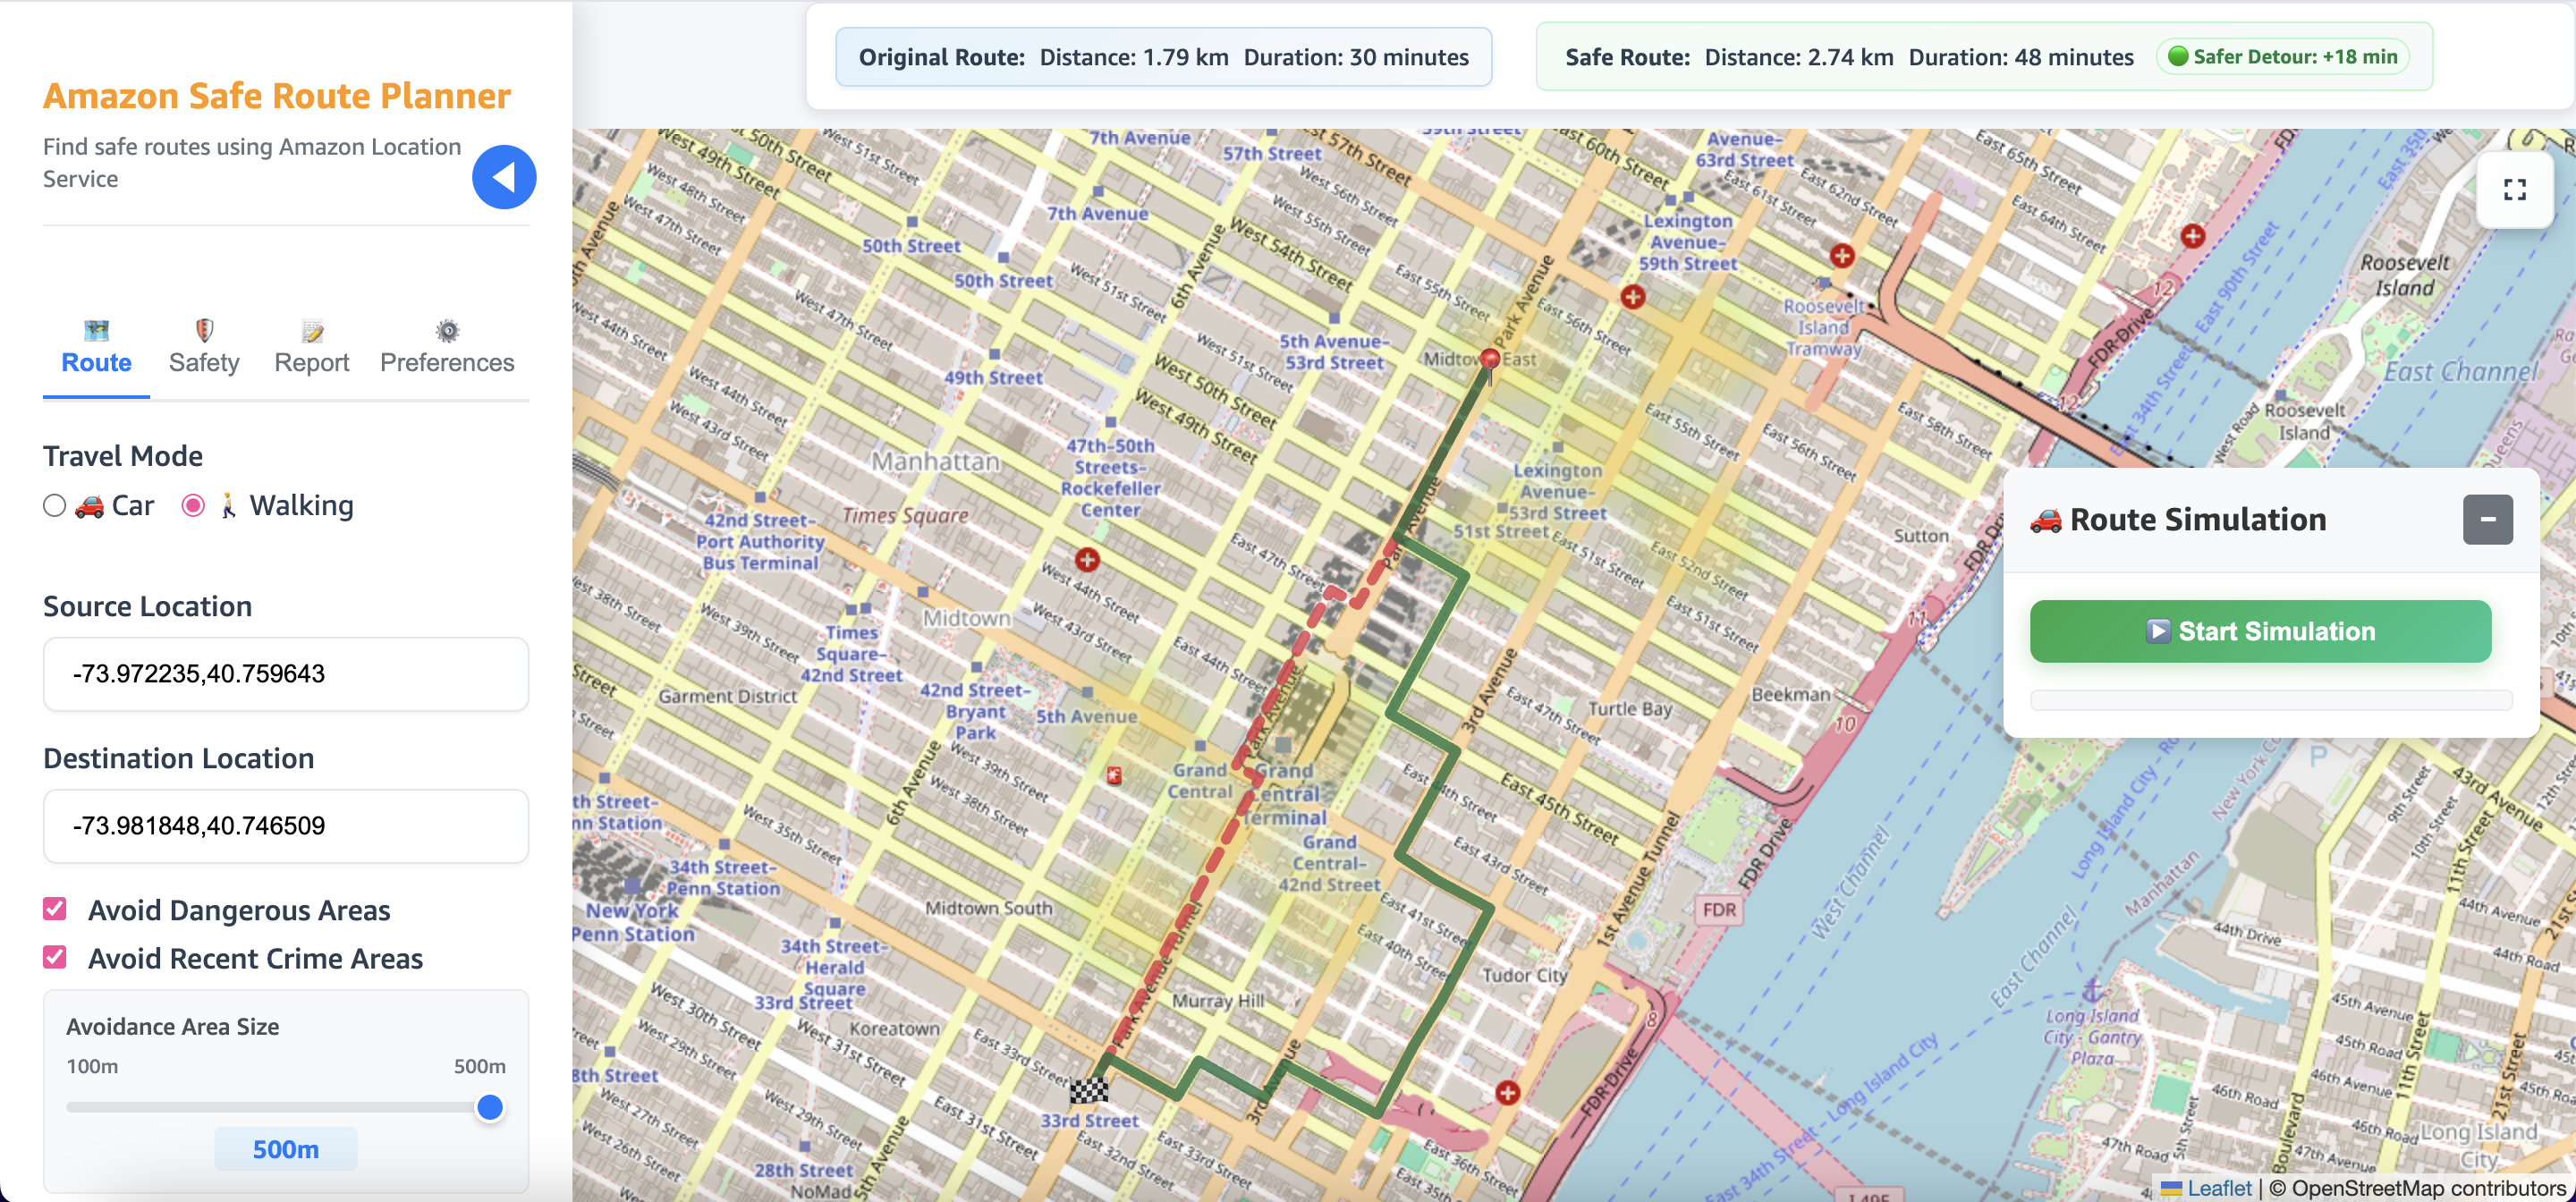
Figure 7: Users adjust their route according to newly reported incidents
Stay informed during travel
The app provides in-app alerts as users move. These alerts include the distance to the upcoming risk zone, the risk zone levels (high, medium, or low), and the most common crime types in that area. This way, users can understand their surroundings in real time. On the Safety tab, users can enable optional features such as:
- SMS alerts when the user enters a high-risk zone
- Automatic emergency-contact calling, in which the contact receives a call with the user’s location and the information that they might need help.
These features are illustrated in the following screenshot.
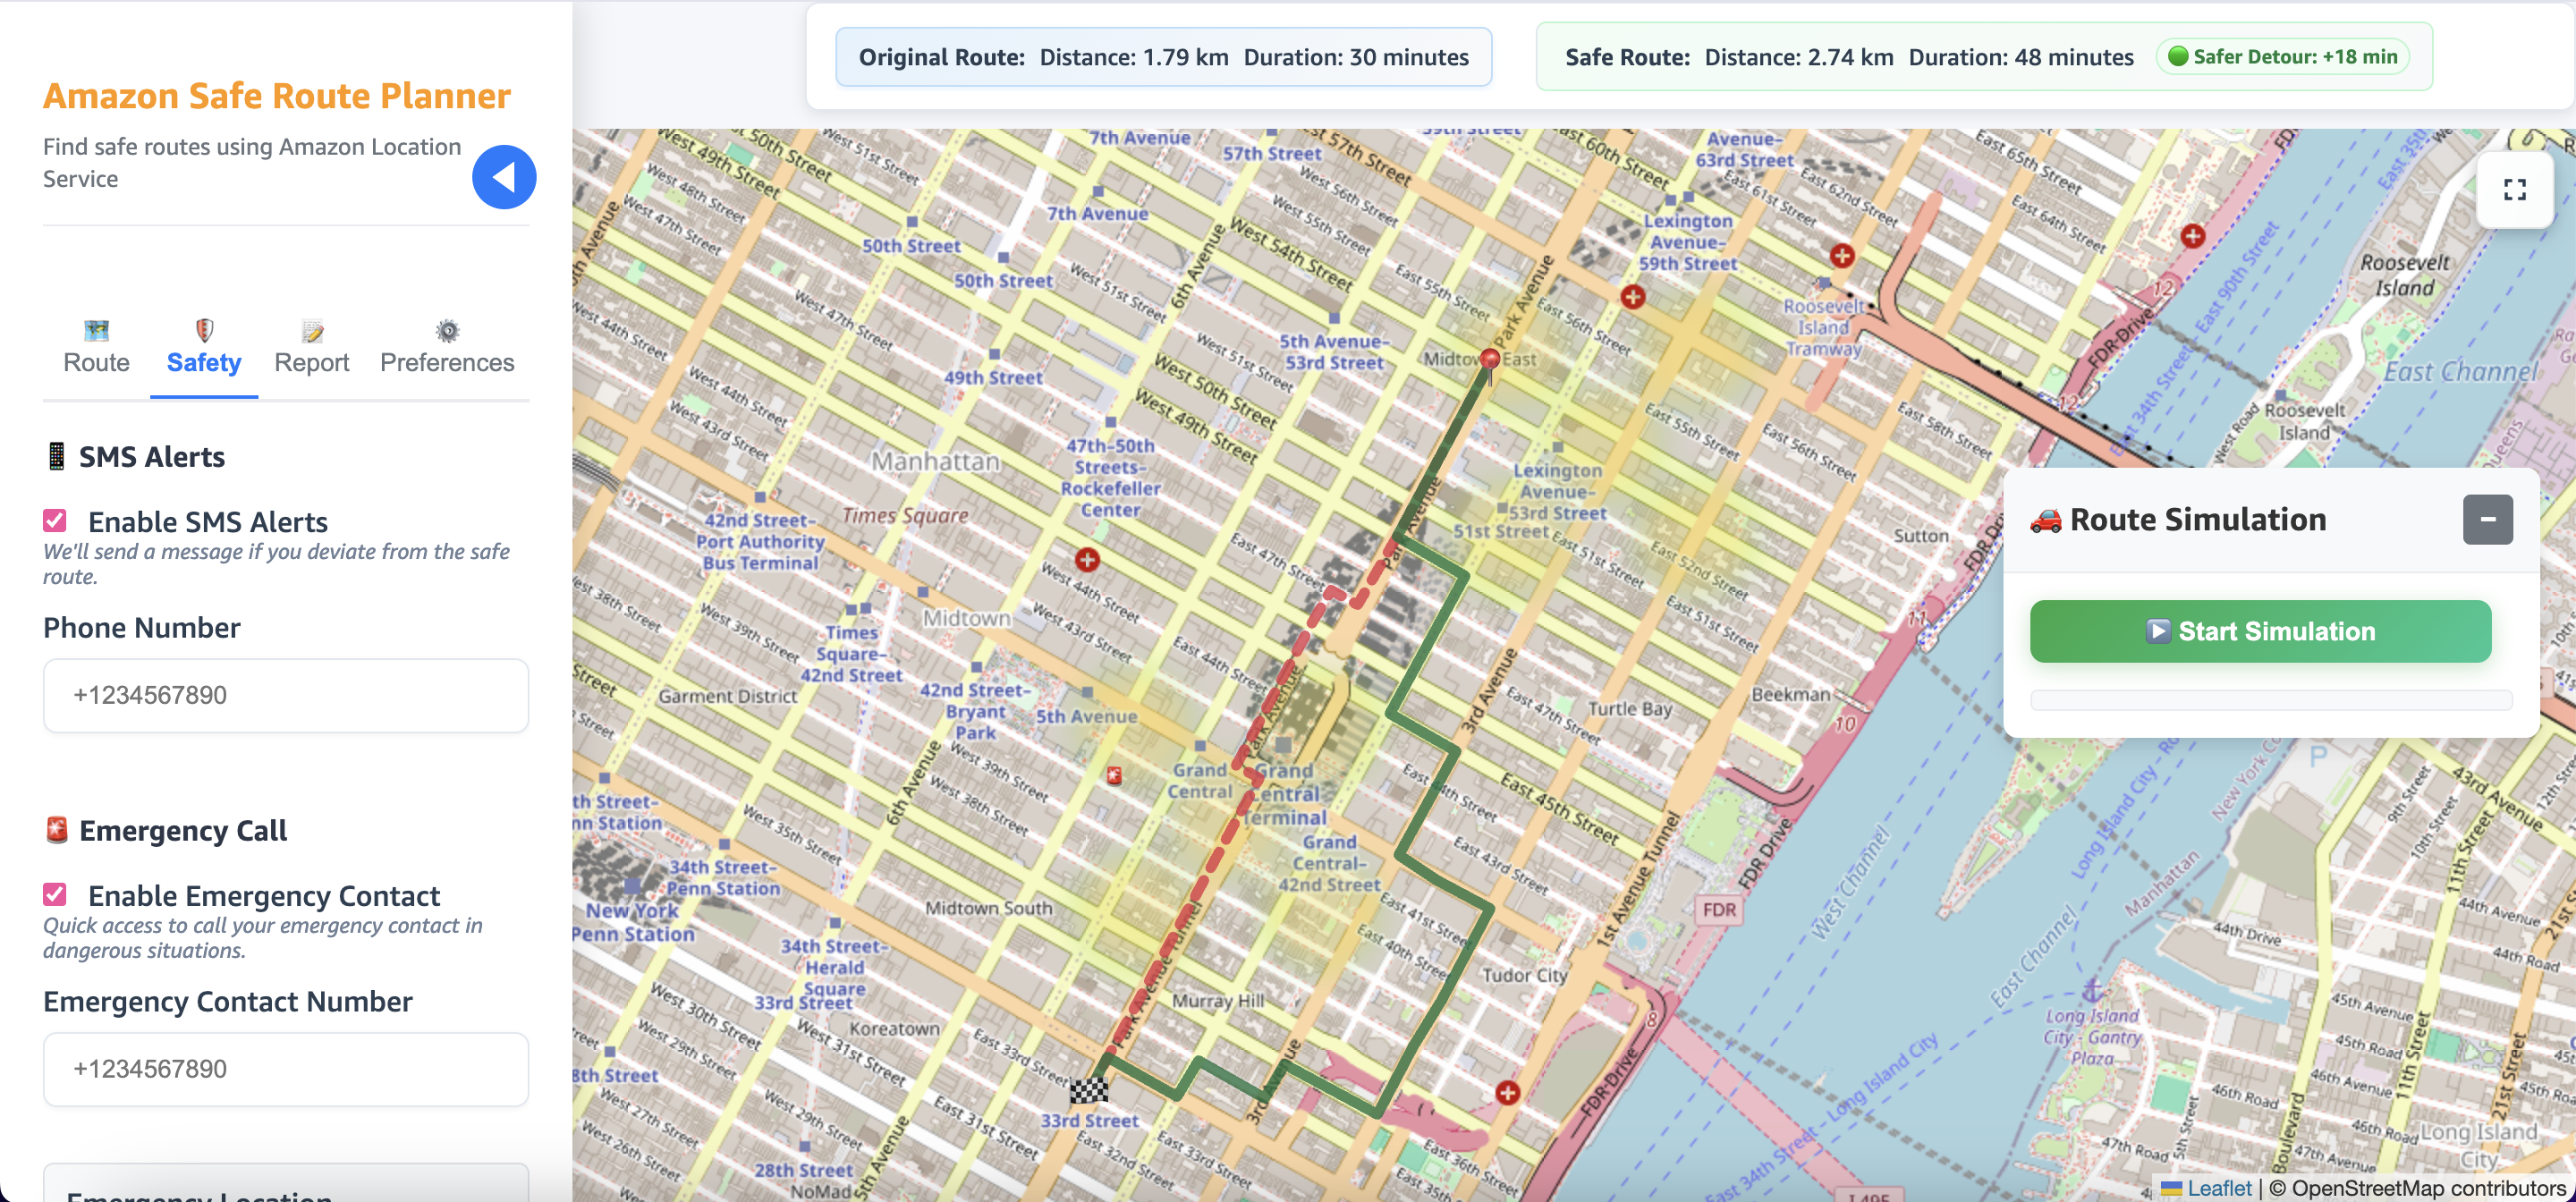
Figure 8: Users stay informed during the journey by receiving alerts
These options help travelers stay aware even when they can’t constantly look at the screen. The following screenshot shows an example SMS alert from the app.
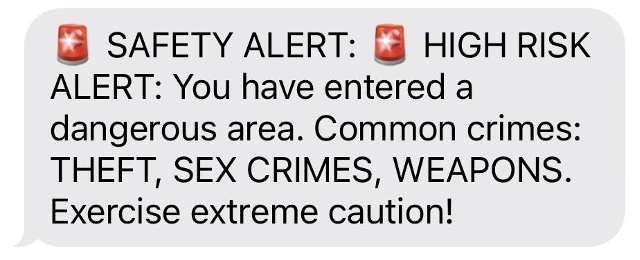
Figure 9: SMS message displaying a safety alert indicating a high-risk area
Considerations
User location data, emergency contacts, and crime reports contain personally identifiable information (PII) that must be encrypted both at rest and in transit. Network traffic uses HTTP over TLS, and stored data is encrypted at rest in the database and object storage. Sensitive configuration values (such as database credentials) should be stored in a managed secrets service such as AWS Secrets Manager.
Crime data usage and location tracking are governed by privacy regulations such as General Data Protection Regulation (GDPR), California Consumer Privacy Act (CCPA), and local surveillance laws. You must ensure compliance by implementing user consent workflows, enforcing appropriate data retention policies and data sovereignty, and aligning practices with applicable legislation.
Conclusion
SafeRoute shows how AWS services can be combined to build a scalable, intelligent navigation system that prioritizes safety over speed. By blending crime data analysis with geospatial queries, dynamic risk scoring, and real-time features such as reporting and alerts, the solution demonstrates how modern cloud tools can enhance everyday urban mobility. The prototype uses New York City crime data, but the architecture is adaptable to any urban, regional, or national area with available records, offering you a flexible path to safer routing worldwide.