AWS Security Blog
How to Monitor and Visualize Failed SSH Access Attempts to Amazon EC2 Linux Instances
As part of the AWS Shared Responsibility Model, you are responsible for monitoring and managing your resources at the operating system and application level. When you monitor your application servers, for example, you can measure, visualize, react to, and improve the security of those servers. You probably already do this on premises or in other environments, and you can adapt your existing processes, tools, and methodologies for use in the AWS Cloud. For more details about best practices for monitoring your AWS resources, see the “Manage Security Monitoring, Alerting, Audit Trail, and Incident Response” section in the AWS Security Best Practices whitepaper.
This blog post focuses on how to log and create alarms on invalid Secure Shell (SSH) access attempts. Implementing live monitoring and session recording facilitates the identification of unauthorized activity and can help confirm that remote users access only those systems they are authorized to use. With SSH log information in hand (such as invalid access type, bad private keys, and remote IP addresses), you can take proactive actions to protect your servers. For example, you can use an AWS Lambda function to adjust your server’s security rules when an alarm is triggered that indicates an invalid SSH access attempt.
In this post, I demonstrate how to use Amazon CloudWatch Logs to monitor SSH access to your application servers (Amazon EC2 Linux instances) so that you can monitor rejected SSH connection requests and take action. I also show how to configure CloudWatch Logs to send SSH access logs from application servers that reside in a public subnet. Last, I demonstrate how to visualize how many attempts are made to SSH into your application servers with bad private keys and invalid user names. Using these techniques and tools can help you improve the security of your application servers.
AWS services and terminology I use in this post
In this post, I use the following AWS services and terminology:
- Amazon CloudWatch – A monitoring service for the resources and applications you run on the AWS Cloud. You can use CloudWatch to collect and track metrics, collect and monitor log files, set alarms, and automatically react to changes in your AWS resources.
- CloudWatch namespaces – Containers for metrics. Metrics in different namespaces are isolated from each other so that metrics from different applications are not mistakenly aggregated into the same statistics. You also can create custom metrics for which you must specify namespaces as containers.
- CloudWatch Logs – A feature of CloudWatch that allows you to monitor, store, and access your log files from EC2 instances, AWS CloudTrail, and other sources. Additionally, you can use CloudWatch Logs to monitor applications and systems by using log data and create alarms. For example, you can choose to search for a phrase in logs and then create an alarm if the phrase you are looking for is found in the log more than 5 times in the last 10 minutes. You can then take action on these alarms, if necessary.
- Log stream – A log stream represents the sequence of events coming from an application instance or resource that you are monitoring. In this post, I use the EC2 instance ID as the log stream identifier so that I can easily map log entries to the instances that produced the log entries
- Log group – In CloudWatch Logs, a group of log streams that share the same retention time, monitoring, and access control settings. Each log stream must belong to one log
- Metric – A specific term or value that you can monitor and extract from log events.
- Metric filter – A metric filter describes how Amazon CloudWatch Logs extracts information from logs and transforms it into CloudWatch metrics. It defines the terms and patterns to look for in log data as the data is sent to CloudWatch Logs. Metric filters are assigned to log groups, and all metric filters assigned to a given log group are applied to their log stream—see the following diagram for more details.
- SSH logs – Reside on EC2 instances and capture all SSH activities. The logs include successful attempts as well as unsuccessful attempts. Debian Linux SSH logs reside in /var/log/auth.log, and stock CentOS SSH logs are written to /var/log/secure. This blog post uses an Amazon Linux AMI, which also logs SSH sessions to /var/log/secure.
- AWS Identity and Access Management (IAM) – IAM enables you to securely control access to AWS services and resources for your users. In the solution in this post, you create an IAM policy and configure an EC2 instance that assumes a role. The IAM policy allows the EC2 instance to create log events and save them in an Amazon S3 bucket (in other words, CloudWatch Logs log files are saved in the S3 bucket).
- CloudWatch dashboards – Amazon CloudWatch dashboards are customizable home pages in the CloudWatch console that you can use to monitor your resources in a single view, even those resources that are spread across different regions. You can use CloudWatch dashboards to create customized views of the metrics and alarms for your AWS resources.
Architectural overview
The following diagram depicts the services and flow of information between the different AWS services used in this post’s solution.

Here is how the process works, as illustrated and numbered in the preceding diagram:
- A CloudWatch Logs agent runs on each EC2 instance. The agents are configured to send SSH logs from the EC2 instance to a log stream identified by an instance ID.
- Log streams are aggregated into a log group. As a result, one log group contains all the logs you want to analyze from one or more instances.
- You apply metric filters to a log group in order to search for specific keywords. When the metric filter finds specific keywords, the filter counts the occurrences of the keywords in a time-based sliding window. If the occurrence of a keyword exceeds the CloudWatch alarm threshold, an alarm is triggered.
- An IAM policy defines a role that gives the EC2 servers permission to create logs in a log group and send log events (new log entries) from EC2 to log groups. This role is then assumed by the application servers.
- CloudWatch alarms notify users when a specified threshold has been crossed. For example, you can set an alarm to trigger when more than 2 failed SSH connections happen in a 5-minute period.
- The CloudWatch dashboard is used to visualize data and alarms from the monitoring process.
Deploy and test the solution
1. Deploy the solution by using CloudFormation
Now that I have explained how the solution works, I will show how to use AWS CloudFormation to create a stack with the desired solution configuration. CloudFormation allows you to create a stack of resources in your AWS account.
- Sign in to the AWS Management Console, choose CloudFormation, choose Create Stack, choose Specify an Amazon S3 template URL and paste the following link in the box: https://s3.amazonaws.com/aws-security-blog-content/public/sample/MonitorSSHActivities/CloudWatchLogs_ssh.yaml

- Choose Launch to deploy the stack.
- On the Specify Details page, enter the Stack name. Then enter the KeyName, which is the SSH key pair for the region you use. I use this key-pair later in this post; if you don’t have a key pair for your current region, follow these instructions to create one. The OperatorEmail is the CloudWatch alarm recipient email address (this field is mandatory to launch the stack), which is the email address to which SSH activity alarms will be sent. You can use the SSHLocation box to limit the IP address range that can access your instances; the default is 0.0.0/0, which means that any IP can access the instance. After specifying these variables, click Next.

- On the Options page, tag your instance, and click Next. Tags allow you to assign metadata to AWS resources. For example, you can tag a project’s resources and then use the tag to manage, search for, and filter resources. For more information about tagging, see Tagging Your Amazon EC2 Resources.

- Wait until the CloudFormation template shows CREATE_COMPLETE, as shown in the following screenshot. This means your stack was created successfully.

After the stack is created successfully, you have two distinct application servers running, each with a CloudWatch agent. These servers represent a fleet of servers in your infrastructure. Choose the Outputs tab to see more details about the resources, such as the public IP addresses of the servers. You will need to use these IP addresses later in this post in order to trigger log events and alarms.

The CloudWatch log agent on each server is installed at startup and configured to stream SSH log entries from /var/log/secure to CloudWatch via a log stream. CloudWatch aggregates the log streams (ssh.log) from the application servers and saves them in a CloudWatch Logs log group. Each log stream is identified by an instance-ID, as shown in the following screenshot.

The application servers assume a role that gives them permissions to create CloudWatch Logs log files and events. CloudFormation also configures two metrics: ssh/InvalidUser and ssh/Disconnect. The ssh/InvalidUser metric sends an alarm when there are more than 2 SSH attempts into any server that include an invalid user name. Similarly, the ssh/Disconnect metric creates an alarm when more than 10 SSH disconnect requests come from users within 5 minutes.
To review the metrics created by CloudFormation, choose Metrics in the CloudWatch console. A new SSH custom namespace has been created, which contains the two metrics described in the previous paragraph.
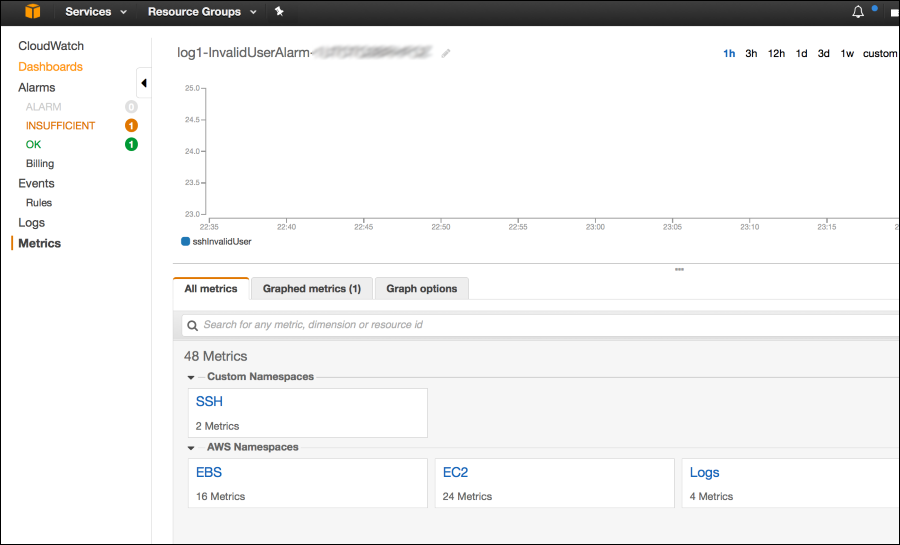
You should now have two application servers running and two custom CloudWatch metrics and alarms configured. Now, it’s time to generate log events, trigger alarms, and test the configurations.
2. Test SSH metrics and alarms
Now, let’s try to trigger an alarm by trying to SSH with an invalid user name into one of the servers. Use the key pair you specified when launching the stack and connect to one of the Linux instances from a terminal window (replace the placeholder values in the following command).
Now, exit the session and try to sign in as bad-user, as shown in the following command.
The following command is the same as the previous command, but with the placeholder values replaced by actual values.
Because the alarm triggers after two or more unsuccessful SSH login attempts with an invalid user name in 1 minute, run the preceding command a few times. The server’s log captures the bad SSH login attempts, and after a minute, you should see InvalidUserAlarm in the CloudWatch console, as shown in the following screenshot. Choose Alarms to see more details. The alarm should disappear after another minute if there are no more SSH login attempts.

You can also view the history of your alarms by choosing the History tab. CloudWatch metrics are saved for 15 months.
When the CloudFormation stack launches, a topic-registration email is sent to the email address you specified in the template. After you accept the topic registration, you will receive an alarm email with details about the alarm. The email looks like what is shown in the following screenshot.

3. Understanding CloudWatch metric filters and their transformation
The CloudFormation template includes two alarms, InvalidUserAlarm and SSHReceiveddisconnectAlarm, and two metric filters. As I mentioned previously, the metric filters define the pattern you want to match in a CloudWatch Logs log group. When a pattern is found, it transforms into an Amazon metric as defined in the MetricTransformations section of the metric filter.
The following is a snippet of the InvalidUser metric filter. Each pattern match—denoted by FilterPattern—is counted as one metric value as specified in the MetricValue parameter in the MetricTranformations section. The CloudWatch alarm associated with this metric filter will be triggered when the metric value crosses a specified threshold.
When a CloudWatch alarm is triggered, the service sends an email to an Amazon SNS topic with more details about the alarm type, trigger parameters, and status.
4. Create a CloudWatch metric filter to identify attempts to SSH into your servers with bad private keys
You can create additional metric filters in CloudWatch Logs to provide better visibility into the SSH activity on your servers. Let’s assume you want to know if there are too many attempts to SSH into your servers with bad private keys. If an attempt is made with a bad private key, a line like the following is logged in the SSH log file.
You can produce this log line by modifying the pem file you are using (a pem file holds your private key). In a terminal window, modify your private key by copying and pasting the following lines in the same directory where your key resides.
These lines simply change the characters at positions 25 and 26 from their current value to the character A, keeping the original pem file intact. Alternatively, you can use nano <valid-keys>.pem from the command line or any other editor, change a character, save the file as bad-keys.pem, and exit the file.
Now, try to use bad-keys.pem to access one of the application servers.
The SSH attempt should fail because you are using a bad private key.
Now, let’s look at the server’s ssh.log file from the CloudWatch Logs console and analyze the error log messages. I need to understand the log format in order to configure a new filter. To review the logs, choose Logs in the navigation pane, and select the log group that was created by CloudFormation (it starts with the name you specified when launching the CloudFormation template).

In particular, notice the following line when you try to SSH with a bad private key.
![]()
Let’s add a metric filter to capture this line so that we can use this metric later when we build an SSH Dashboard. Copy the following line to the Filter events search box at the top of the console screen and press Enter.

You can now see only the lines that match the pattern you specified. These are the lines you want to count and transform into metrics. Each string in the message is represented by a word in the filter. In our example, we are looking for a pattern where the sixth word is Connection and the seventh word is closed. Other words in the log line are not important in this context. The following image depicts the mapping between a string in a log file and a metric filter.

To create the metric filter, choose Logs in the navigation pane of the CloudWatch console. Choose the log groups to which you want to apply the new metric filter and then choose Create Metric Filter. Choose Next.

Paste the filter pattern we used previously (the sixth word equals Connection and the seventh word equals closed) in the Filter Pattern box. Select the server you tried to sign in to with the bad private key to Select Log Data to Test and click Test Pattern. You should see the results that are shown in the following screenshot. When completed, click Assign Metric.

Type SSH for the Metric Namespace and sshClosedConnection-InvalidKeysFilter for Filter Name. Choose Create Filter to see your new metric filter listed. You can use the newly created metric filter to graph the metrics and set alarms. The alarms can be used to inform your administrator via email of any event you specify. In addition, metrics can be used to generate SNS notification to trigger an AWS Lambda function in order to take proactive actions, such as blocking suspicious IP addresses in a security group.

Choose Create Alarm next to Filter Name and follow the instructions to create a CloudWatch alarm.

Back at the Metrics view, you should now have three SSH metric filters under Custom Namespaces. Note that it can take a few minutes for the number of SSH metrics to update from two to three.

5. Create a graph by using a CloudWatch dashboard
After you have configured the metrics, you can display SSH metrics in a graph. CloudWatch dashboards allow you to create reusable graphs of AWS resources and custom metrics so that you can quickly monitor your operational status and identify issues at a glance. Metrics data is kept for a period of two weeks.
In the CloudWatch console, choose Dashboards in the navigation pane, and then choose Create dashboard to create a new graph in a dashboard. Name your dashboard SSH-Dashboard and choose Create dashboard. Choose Line Graph from the graph options and choose Configure.

In the Add metric graph window under Custom Namespace, choose SSH > Metrics with no dimensions. Select all three metrics you have configured (the CloudFormation template configured two metrics and you manually added one more metric).

By default, the metrics are displayed on the graph as an average. However, you configured metrics that are based on summary metrics (for example, the total number of alarms in two minutes). To change the default, choose the Graphed metrics tab, and change the statistic from Average to Sum, as shown in the following screenshot. Also, change the time period from 5 minutes to 1 minute.

Your graphed metrics should look like the following screenshot. When you have provided all the necessary information, choose Create Widget.

You can rename the graph and add static text to give the console more context. To add a text widget, choose Widget and select text. Then edit the widget with markdown language. Your dashboard may then look like the following screenshot.
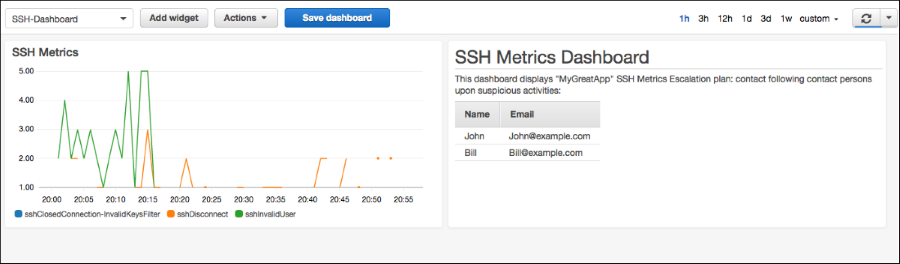
The consolidated metrics graph displays the number of SSH attempts with bad private keys, invalid user names, and too many disconnects.
Conclusion
In this blog post, I demonstrated how to automate the deployment of the CloudWatch Logs agent, create filters and alarms, and write, test, and apply metrics on the fly from the AWS Management Console. You can then visualize the metrics with the AWS Management Console. The solution described in this post gives you monitoring and alarming capabilities that can help you understand the status of and potential risks to your instances and applications. You can easily aggregate logs from many servers and different applications, create alarms, and display logs’ metrics on a graph.
If you have comments about this post, submit them in the “Comments” section below. If you have questions about the solution in this post, start a new thread on the CloudWatch forum.
– Assaf
Want more AWS Security how-to content, news, and feature announcements? Follow us on Twitter.