AWS Storage Blog
Amazon S3 audit logging, Part 1: Analyzing server access logs with Amazon Athena for performance insights
Organizations storing sensitive data must maintain complete visibility into how it’s accessed, by whom, and what changes occur over time. Regulatory frameworks demand detailed audit trails, security teams need rapid answers during investigations, and finance teams require granular cost attribution. Yet as data grows from terabytes to petabytes, the scale that makes centralized storage attractive also makes it challenging to analyze. Log volumes reach billions of records, queries that once took seconds now consume hours, and audit data storage costs demand optimization. Many organizations find themselves trapped in a paradox, where they’ve collected all their access data in one place but can no longer efficiently extract meaningful insights from it.
Amazon Simple Storage Service (Amazon S3) addresses these challenges through three audit logging mechanisms, each designed for a distinct analytical perspective and capable of delivering value independently. Server access logs capture HTTP-level request details for performance and cost analysis. Amazon S3 data events in AWS CloudTrail provide comprehensive user identity context for security and compliance investigations. S3 Metadata journal tables track object state changes throughout their lifecycle for storage optimization and governance. Depending on the use case, you can use one or more of these mechanisms to answer key audit questions: how data was accessed, who accessed it, and what changes at object metadata level happened over time.
This is Part 1 of a three-part series where we dive into each of these audit logging mechanisms. In this post, we demonstrate how to implement server access logging with partition projection in Amazon Athena, giving you fast, cost-effective querying across centralized log repositories. You will learn how to enable and configure centralized access logging for multiple buckets in the account, create optimized Athena tables that reduce query costs by up to 90% through intelligent partitioning, and run common analysis patterns for performance troubleshooting, cost attribution, error investigation, and traffic analysis—turning your raw access logs into an operational advantage rather than a storage burden.
Which part should you read?
The following decision tree will help you determine which option is most relevant for your situation.
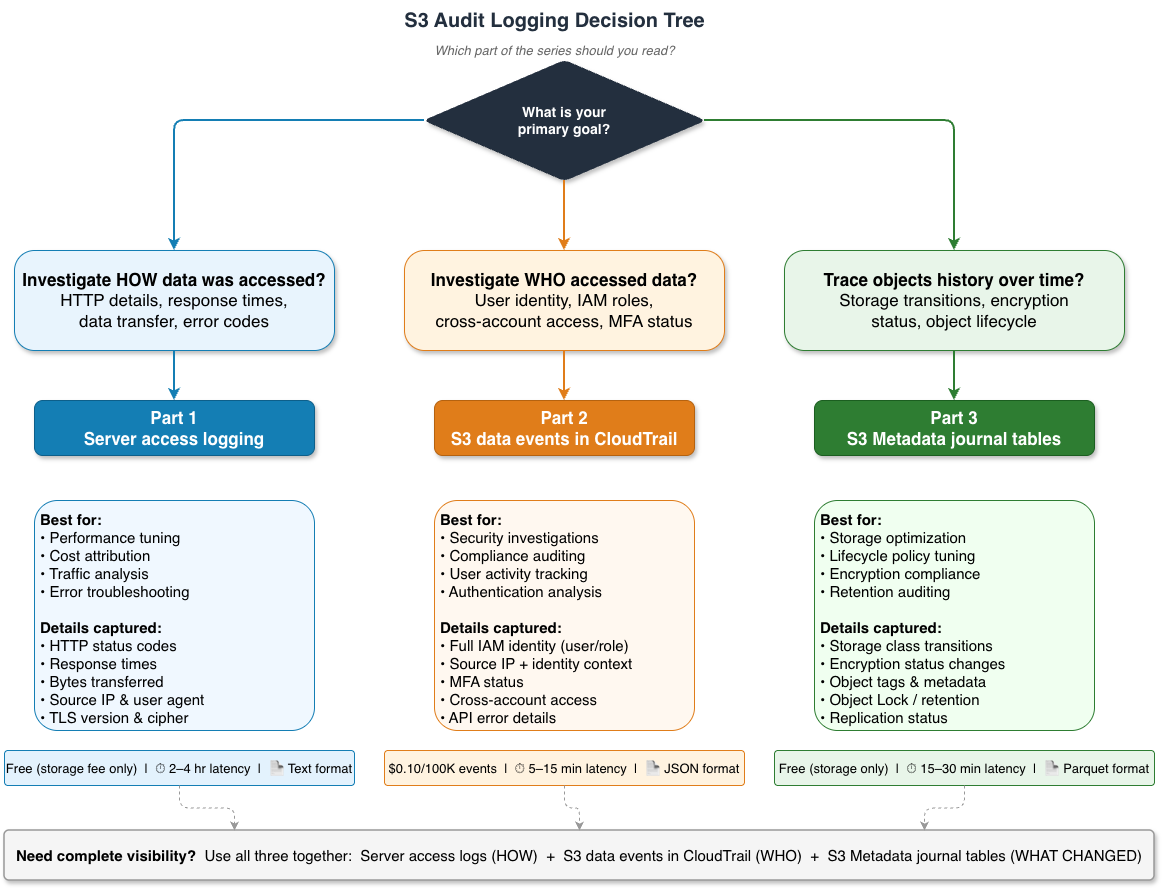
Many organizations use multiple mechanisms together for complete visibility. Server access logs tell you how something was accessed, AWS CloudTrail tells you who did it, and S3 Metadata journal tables tell you what changes at object metadata level happened over time. Read all three parts to build a comprehensive audit strategy.
What server access logs capture
Server access logs act as your HTTP request auditor, recording detailed information about every request made to your bucket.
What is captured:
- HTTP request details – Method, response code, error codes
- Performance metrics – Response times, turnaround times, bytes transferred
- Network context – Source IP, referrer, user agent
- TLS/Security details – TLS version, cipher suite
What is not captured:
- User identity – The requester field contains the AWS Identity and Access Management (IAM) Amazon Resource Name (ARN) for authenticated requests, but doesn’t have full session context such as multi-factor authentication (MFA) status, role assumption chains, and federation details (use CloudTrail data events, as discussed in Part 2, for complete identity auditing).
- Metadata or storage changes – No tracking of object property changes or lifecycle events (use S3 Metadata journal tables, as detailed in Part 3).
- Cross-account context – The requester field captures the canonical user ID for cross-account requests, but full IAM session context, role assumption chains, and assumed role ARNs require CloudTrail data events.
- Session context – No MFA or role assumption details.
Delivery latency – Logs are delivered on a best-effort basis, typically within a few hours, though delays or occasional non-delivery can occur. Access logs might not fit if the use case demands real-time alerting.
Enable S3 server access logging
For centralized logging, create a dedicated logging account with a central S3 bucket, then configure all the required buckets in that account to deliver their S3 access logs to this central location. Complete the following steps:
- On the S3 console, choose General purpose buckets in the navigation pane.
- Choose the source bucket you want to monitor.
- On the Properties tab, in the Server access logging section, choose Edit.
- Choose Enable.
- For Destination, choose Browse S3 to choose an existing bucket, or enter a
bucket name and prefix:s3://<server-access-logs-destination-bucket-name>/access-logs. Use a separate bucket for logs (not the source bucket). - For Log object key format, select the detailed option:
[DestinationPrefix][SourceAccountId]/[SourceRegion]/[SourceBucket]/[YYYY]/[MM]/[DD]/[YYYY]-[MM]-[DD]-[hh]-[mm]-[ss]-[UniqueString]You must select the structured log key format (shown in the preceding code) for the Athena partition projection table to function correctly. The legacy default format does not include account, AWS Region, or bucket in the path.
- For Source of date, choose S3 event time (recommended for accurate event tracking). With event time selected, logs for a given day might arrive hours later. Avoid querying the current day’s partition expecting complete results.
- Choose Save changes.
(Optional) Set up S3 Lifecycle policy for server access logs
It is recommended to set up an S3 Lifecycle policy for your CloudTrail logs. The following lifecycle settings are general recommendations; you can adjust them based on your organization’s requirements.
- On the S3 console, go to your log destination bucket.
- On the Management tab, under Lifecycle configuration, choose Create lifecycle rule.
- For Lifecycle rule name, enter a name (for example,
S3AccessLogsLifecycle). - Select Limit the scope of this rule using one or more filters.
- For Prefix, enter a prefix (for example,
access-logs/). - For Lifecycle rule actions:
- Select Transition current versions of objects between storage classes.
- Select Expire current versions of objects (optional, for automatic deletion).
- For Transitions for current versions, adjust transition days as appropriate to your use cases:
- Choose Add transition.
- Transition to Standard-IA after 30 days.
- Choose Add transition again.
- Transition to Glacier Flexible Retrieval after 90 days.
- Choose Add transition again.
- Transition to Glacier Deep Archive after 365 days.
- For Expiration, optionally expire current versions of objects in 2,555 days (7 years). The 7-year retention period aligns with SOX compliance requirements. Adjust based on your organization’s specific regulatory obligations (for example, PCI-DSS: 1 year, HIPAA: 6 years).
- Choose Create rule.
Create Athena table with partition projection
Partition projection alleviates the need for an AWS Glue crawler and enables Athena to automatically resolve partitions at query time, reducing both cost and complexity. For more details, refer to Using S3 server access logs to identify requests.
To create an Athena table with partition projection, complete the following steps:
- On the Athena console, choose Query editor in the navigation pane.
- Run the following command (you can use the database name of your choice):
CREATE DATABASE s3_access_logs_enterprise- For Data source, choose
AWSDataCatalog. - For Catalog, choose
default. - For Database, choose
s3_access_logs_enterprise. - Enter the following SQL query:
CREATE EXTERNAL TABLE IF NOT EXISTS s3_access_logs_enterprise (
bucketowner STRING,
bucket_name STRING,
requestdatetime STRING,
remoteip STRING,
requester STRING,
requestid STRING,
operation STRING,
key STRING,
request_uri STRING,
httpstatus STRING,
errorcode STRING,
bytessent BIGINT,
objectsize BIGINT,
totaltime STRING,
turnaround_time STRING,
referrer STRING,
useragent STRING,
versionid STRING,
hostid STRING,
signatureversion STRING,
ciphersuite STRING,
authtype STRING,
endpoint STRING,
tlsversion STRING,
accesspointarn STRING,
aclrequired STRING,
sourceregion STRING
)
PARTITIONED BY (
account STRING,
region STRING,
source_bucket STRING,
`timestamp` STRING
)
ROW FORMAT SERDE 'org.apache.hadoop.hive.serde2.RegexSerDe'
WITH SERDEPROPERTIES (
'serialization.format' = '1',
'input.regex' = '([^ ]*) ([^ ]*) \\[(.*?)\\] ([^ ]*) ([^ ]*) ([^ ]*) ([^ ]*) ([^ ]*) (\"[^\"]*\"|-) (-|[0-9]*) ([^ ]*) ([^ ]*) ([^ ]*) ([^ ]*) ([^ ]*) (\"[^\"]*\"|-) (\"[^\"]*\"|-) ([^ ]*) ([^ ]*) ([^ ]*) ([^ ]*) ([^ ]*) ([^ ]*) ([^ ]*) ([^ ]*) ([^ ]*) ([^ ]*)')
LOCATION 's3://my-s3-access-logs-bucket/access-logs/'
TBLPROPERTIES (
'projection.enabled' = 'true',
'projection.account.type' = 'injected',
'projection.region.type' = 'injected',
'projection.source_bucket.type' = 'injected',
'projection.timestamp.type' = 'date',
'projection.timestamp.format' = 'yyyy/MM/dd',
'projection.timestamp.range' = '2024/01/01,NOW',
'projection.timestamp.interval' = '1',
'projection.timestamp.interval.unit' = 'DAYS',
'storage.location.template' = 's3://my-s3-access-logs-bucket/access-logs/${account}/${region}/${source_bucket}/${timestamp}/');- Choose Run.
- Verify table creation: you should see a Query successful message.
Analyze server access logs
In this section, we present common server access log analysis patterns. Each query demonstrates proper partition pruning to minimize data scanned and query cost. With injected partition projection, you must specify account, region, and source_bucket in every query’s WHERE clause.
All the dates and date ranges used in the following query patterns are examples and use placeholders; these need to be adjusted based on your requirements.
To run each query, complete the following steps:
- On the Athena console, choose the database
s3_access_logs_enterprise. - In the query editor, enter your desired query.
- Choose Run or press Ctrl+Enter.
- View results in the Results pane.
Performance & reliability tips for server access logs queries:
- Always filter on timestamp (partition column) first — Athena uses it to enable partition pruning, skipping entire S3 paths and reducing data scanned and query cost. Use
requestdatetimeonly when you need sub-day precision (hours/minutes/seconds), and always pair it with a timestamp filter to preserve partition pruning benefits. - Be aware that S3 server access logs are delivered on best effort basis and (typically minutes to hours), so a request occurring at time T may land in a partition for a different day than expected — especially near midnight UTC boundaries. Check both adjacent partitions when investigating events near day boundaries (e.g.,
WHERE timestamp BETWEEN '2025/09/15' AND '2025/09/16') to avoid missing logs.
Query pattern 1: Access pattern analysis for specific bucket
The following query breaks down S3 bucket access patterns by operation type and HTTP status code for a given day to help identify traffic trends, unusual activity, or error spikes:
-- Analyze access patterns for a specific bucket
SELECT
operation,
httpstatus,
COUNT(*) as request_count,
SUM(COALESCE(bytessent, 0)) as total_bytes_sent,
COUNT(DISTINCT remoteip) as unique_ips
FROM s3_access_logs_enterprise
WHERE account = '123456789012'        -- REQUIRED: Your AWS account ID
AND region = 'us-east-1'              -- REQUIRED: AWS region
AND source_bucket = 'my-prod-bucket'  -- REQUIRED: Source bucket name
AND timestamp = '2026/05/15'
GROUP BY operation, httpstatus
ORDER BY request_count DESC;
Query pattern 2: Security investigation of IP activity
The following query surfaces external IP addresses with unusually high activity (over 100 requests) against a specific S3 bucket and helps identify potential data exfiltration or unauthorized access patterns. In this example, both, timestamp partition and actual requestdatetime column are used for filtering as mentioned in notes earlier.
-- Investigate suspicious IP addresses accessing specific bucket
SELECT
remoteip,
COUNT(*) as request_count,
COUNT(DISTINCT key) as unique_objects_accessed,
SUM(COALESCE(bytessent, 0)) as total_bytes_transferred,
MIN(parse_datetime(requestdatetime,'dd/MMM/yyyy:HH:mm:ss Z')) as first_access,
MAX(parse_datetime(requestdatetime,'dd/MMM/yyyy:HH:mm:ss Z')) as last_access,
COUNT(CASE WHEN httpstatus NOT IN ('200', '206', '304') THEN 1 END) as error_count
FROM s3_access_logs_enterprise
WHERE account = '123456789012'        -- REQUIRED
AND region = 'us-east-1'              -- REQUIRED
AND source_bucket = 'my-prod-bucket'  -- REQUIRED
AND timestamp BETWEEN '2026/05/15' AND '2026/05/16'
  AND parse_datetime(requestdatetime,'dd/MMM/yyyy:HH:mm:ss Z')
BETWEEN parse_datetime('2026-05-15:07:00:00','yyyy-MM-dd:HH:mm:ss')
AND parse_datetime('2026-05-15:23:00:00','yyyy-MM-dd:HH:mm:ss')
AND remoteip NOT LIKE '10.%'          -- External IPs only
AND remoteip NOT LIKE '172.16.%'
AND remoteip NOT LIKE '192.168.%'
GROUP BY remoteip
HAVING COUNT(*) > 100 -- High activity threshold
ORDER BY request_count DESC
LIMIT 50;
Query pattern 3: Multi-bucket analysis
The following query compares access patterns across multiple S3 buckets over a date range, summarizing request counts, total data transferred (in GB), and unique source IPs by bucket and operation type to help identify usage differences and spot anomalies across buckets:
-- Compare access patterns across multiple buckets
SELECT
source_bucket,
operation,
COUNT(*) as request_count,
SUM(COALESCE(bytessent, 0)) / 1024 / 1024 / 1024 as total_gb_transferred,
COUNT(DISTINCT remoteip) as unique_ips
FROM s3_access_logs_enterprise
WHERE account = '123456789012'   -- REQUIRED: Same account
AND region = 'us-east-1'         -- REQUIRED: Same region
AND source_bucket IN('bucket-1', 'bucket-2', 'bucket-3')
AND timestamp BETWEEN '2026/05/15' AND '2026/05/17'
GROUP BY source_bucket, operation
ORDER BY source_bucket, request_count DESC;
Query pattern 4: Regional access analysis
The following query compares S3 access patterns across multiple Regions for the same account, summarizing request counts and total data transferred (in GB) by Region and bucket to help identify Regional traffic distribution and data transfer hotspots:
-- Analyze access patterns across different regions (same account)
SELECT
region,
source_bucket,
COUNT(*) as request_count,
SUM(COALESCE(bytessent, 0)) / 1024 / 1024 / 1024 as total_gb_transferred
FROM s3_access_logs_enterprise
WHERE account = '123456789012'                       -- REQUIRED: Same account
AND region IN('us-east-1', 'us-west-2', 'eu-west-1') -- REQUIRED: List regions
AND source_bucket IN('bucket-1', 'bucket-2', 'bucket-3')
AND timestamp = '2026/05/15'
GROUP BY region, source_bucket
ORDER BY total_gb_transferred DESC;
Query pattern 5: Error analysis
The following query identifies the most frequent S3 access errors for a specific bucket by grouping non-success HTTP status codes with their error codes, helping you pinpoint failing requests and determine how many unique IPs are affected:
-- Analyze error patterns for troubleshooting
SELECT
httpstatus,
errorcode,
operation,
key,
COUNT(*) as error_count,
COUNT(DISTINCT remoteip) as unique_ips_affected
FROM s3_access_logs_enterprise
WHERE account = '123456789012'        -- REQUIRED
AND region = 'us-east-1'              -- REQUIRED
AND source_bucket = 'my-prod-bucket'  -- REQUIRED
AND timestamp = '2026/05/15'
AND httpstatus NOT IN ('200', '206', '304') -- Non-success codes
AND httpstatus != '-'
GROUP BY httpstatus, errorcode, operation, key
ORDER BY error_count DESC
LIMIT 100;
Query pattern 6: Performance analysis
The following query surfaces the slowest S3 requests (over 5 seconds) for a specific bucket to help identify performance bottlenecks and optimize access patterns:
-- Identify slow requests for performance optimization
SELECT
operation,
key,
httpstatus,
CAST(totaltime AS INTEGER) as response_time_ms,
COALESCE(objectsize, 0) as object_size_bytes,
remoteip,
requestdatetime
FROM s3_access_logs_enterprise
WHERE account = '123456789012'        -- REQUIRED
AND region = 'us-east-1'              -- REQUIRED
AND source_bucket = 'my-prod-bucket'  -- REQUIRED
AND timestamp = '2026/05/15'
AND totaltime != '-'
AND CAST(totaltime AS INTEGER) > 5000 -- Requests taking >5 seconds
ORDER BY CAST(totaltime AS INTEGER) DESC
LIMIT 100;
Query pattern 7: Cost attribution
The following query gives you the cost estimate attributed from S3 data transfer excluding API cost. This query has first-tier S3 data transfer rate and rates decrease at higher volumes; refer to S3 pricing for more details and adjust as needed.
-- Analyze data transfer costs by requester
SELECT
requester,
remoteip,
COUNT(*) as request_count,
SUM(COALESCE(bytessent, 0)) / 1024 / 1024 / 1024 as total_gb_sent,
-- Estimate data transfer costs (adjust rate as needed)
(SUM(COALESCE(bytessent, 0)) / 1024 / 1024 / 1024) * 0.09 as estimated_cost_usd
FROM s3_access_logs_enterprise
WHERE account = '123456789012'          -- REQUIRED
AND region = 'us-east-1'                -- REQUIRED
AND source_bucket = 'my-prod-bucket'    -- REQUIRED
AND timestamp BETWEEN '2026/04/01' AND '2026/04/30'
AND operation IN ('REST.GET.OBJECT', 'REST.HEAD.OBJECT')
AND httpstatus IN ('200', '206')
AND bytessent > 0
GROUP BY requester, remoteip
ORDER BY total_gb_sent DESC
LIMIT 50;
Query pattern 8: Popular content analysis
The following identifies the most frequently accessed objects in a specific S3 bucket over a date range to help optimize caching and content delivery strategies:
-- Identify most accessed objects
SELECT
key,
COUNT(*) as access_count,
COUNT(DISTINCT remoteip) as unique_visitors,
SUM(COALESCE(bytessent, 0)) / 1024 / 1024 as total_mb_served,
AVG(CAST(totaltime AS INTEGER)) as avg_response_time_ms,
MAX(parse_datetime(requestdatetime,'dd/MMM/yyyy:HH:mm:ss Z')) as last_accessed
FROM s3_access_logs_enterprise
WHERE account = '123456789012'         -- REQUIRED
AND region = 'us-east-1'               -- REQUIRED
AND source_bucket = 'my-prod-bucket'   -- REQUIRED
AND timestamp BETWEEN '2026/05/15' AND '2026/05/17'
AND operation = 'REST.GET.OBJECT'
AND httpstatus = '200'
AND key != '-'
AND totaltime != '-'
GROUP BY key
HAVING COUNT(*) > 10
ORDER BY access_count DESC
LIMIT 100;
Advanced analysis techniques
In this section, we discuss two advanced analysis techniques. For frequently used queries, consider saving them in Athena and views can also be created for recurring queries.
Create saved queries in Athena
To create saved queries in Athena, complete the following steps:
- On the Athena console, open the query editor.
- Enter your query, then choose the options menu (three dots) and choose Save.
- For Query name, enter a descriptive name (for example,
Daily Security Investigation). - For Description, enter details about what the query does.
- Choose Save.
- Choose the Saved queries tab to access your list of saved queries.
Create views for recurring queries
The following example query creates views for recurring queries:
-- Create a view for daily security summary
CREATE OR REPLACE VIEW daily_security_summary AS
SELECT
account,
region,
source_bucket,
SUBSTR(timestamp, 1, 4) AS year,
SUBSTR(timestamp, 6, 2) AS month,
SUBSTR(timestamp, 9, 2) AS day,
COUNT(*) as total_requests,
COUNT(DISTINCT remoteip) as unique_ips,
COUNT(CASE WHEN httpstatus NOT IN ('200', '206', '304') THEN 1 END) as error_count,
SUM(COALESCE(bytessent, 0)) / 1024 / 1024 / 1024 as total_gb_transferred
FROM s3_access_logs_enterprise
GROUP BY account, region, source_bucket, 4, 5, 6;

-- Query the view
SELECT *
FROM daily_security_summary
WHERE account = '123456789012'
AND region = 'us-east-1'
AND source_bucket = 'my-prod-bucket'
AND year = '2026'
AND month = '05'
ORDER BY year DESC, month DESC, day DESC;
Cost optimization best practices
For cost optimization, we recommend using partition pruning. The following query is efficient and scans only the targeted partition:
SELECT * FROM s3_access_logs_enterprise
WHERE account = '123456789012'   -- Partition pruning
AND region = 'us-east-1'         -- Partition pruning
AND source_bucket = 'my-bucket'  -- Partition pruning
AND timestamp = '2026/05/15'     -- Partition pruning
AND httpstatus = '404';
The following query is a full table scan (missing required partition columns) and more expensive:
-- Missing required partition columns!
SELECT * FROM s3_access_logs_enterprise
WHERE httpstatus = '404';
Another best practice for cost optimization is to use LIMIT for one-time exploratory queries.
Troubleshooting common issues
The following are common issues and troubleshooting tips:
- Query returns no results – Logs are delivered on a best-effort basis (typically 2–4 hours after enabling). Verify log files exist in S3 at the expected path and confirm partition values in your WHERE clause match the actual S3 structure.
- “HIVE_PARTITION_SCHEMA_MISMATCH” error – The storage.location.template in your table properties doesn’t match the actual S3 path structure. Ensure partition column types match.
- High query costs – This happens when you are not using partition pruning effectively. Always include all partition columns in the WHERE clause:
-- Always include ALL partition columns in WHERE clause
WHERE account = 'xxx'      -- REQUIRED
AND region = 'xxx'         -- REQUIRED
AND source_bucket = 'xxx'  -- REQUIRED
AND timestamp = 'xxxx'. -- REQUIRED- Slow query performance – Use more specific date ranges, add LIMIT clauses, and consider creating materialized views for frequent queries.
Conclusion
In this post, we reviewed how to implement server access logging with partition projection in Athena to efficiently analyze HTTP-level access patterns across centralized log repositories. You now have query patterns for performance troubleshooting, cost attribution, error investigation, traffic analysis, and suspicious activity detection—all optimized with partition pruning to minimize query costs.
Server access logs tell you how data was accessed, but not who did it or what changes at object metadata level happened over time. In Part 2, we cover CloudTrail data events for identity-focused security and compliance investigations. In Part 3, we explore S3 Metadata journal tables for object lifecycle tracking and storage optimization.