Artificial Intelligence
Atlassian continuously profiles services in production with Amazon CodeGuru Profiler
This is a guest post by the Jira Cloud Performance Team at Atlassian. In their own words, Atlassian’s mission is to unleash the potential in every team. Our products help teams organize, discuss, and complete their work. And what teams do can change the world. We have helped NASA teams design the Mars Rover, Cochlear teams develop hearing implants and hundreds of thousands of other teams do amazing things. We have an incredible opportunity to help millions more teams in organizations across nearly every industry. Teamwork is hard. We make it easier.
The products we build at Atlassian have hundreds of developers working on them, composed of a mixture of monolithic applications and microservices. When an incident occurs, it can be hard to diagnose the root cause due to the high rate of change within the codebases. Profiling can speed up root cause diagnosis significantly and is an effective technique to identify runtime hotspots and latency contributors within an application. Without profiling, you commonly need to implement custom and ad hoc latency instrumentation of the code, which can be error-prone or cause other side effects.
At Atlassian, we’ve always had tooling to profile services in production, such as using Linux perf or async-profiler, and while these are highly valuable, our methods had some limitations:
- Intervention from a person (or system) was required to capture a profile at the right time, which meant transient problems were often missed
- Ad hoc profiling didn’t provide a baseline profile to compare with
- For security and reliability, a limited number of people had access to run these tools in production
These limitations led us to look into continuous profiling.
In addition to helping diagnose where a service is spending CPU cycles (or time), we wanted a profiling solution that provided visualizations like flame graphs, which are a great diagnostic aid when trying to understand call paths in a complex and dynamic application, and can also be used to aid a developers’ understanding of the system.
Our existing in-house profiling solution comprised scripts deployed alongside our services that can generate profiles using Linux perf or async-profiler. A subset of privileged developers (and SREs) could run these scripts on production nodes using AWS Systems Manager. Our use of Linux perf and async-profiler came with several advantages, including:
- Data in a format that we could visualize as a flame graph (which is easy to interpret)
- The ability to profile either a single process or a whole node
- Profiling across different dimensions such as CPU, memory, and I/O
Our initial continuous profiling solution comprised a scheduled job that ran async-profiler (or Linux perf) regularly, uploading the raw results to a microservice that transformed the raw data into a columnar data format (Parquet), and writing the result to Amazon Simple Storage Service (Amazon S3).
We defined a schema in AWS Glue allowing developers to query the profile data for a particular service using Amazon Athena. Athena empowered developers to write complex SQL queries to filter profile data on dimensions like time range and stack frames.
We also started building a UI to run the Athena queries and render the results as flame graphs using SpeedScope.
Even with the effort we already employed for this solution, we still had significant work ahead of us to build out an optimal solution.
Meanwhile, the announcement of Amazon CodeGuru Profiler caught our attention—the service offering was highly relevant to us and largely overlapped with our existing capability. After a successful spike and evaluation, we decided to stop building out our solution and integrate CodeGuru Profiler instead.
We chose to define a single profiling group for each of our smaller services. For our larger services, which are partitioned into shards (a separate Auto Scaling group per shard), we choose to create one profiling group per shard.
You can integrate the Java profiler via two available modes: agent and code mode. To ensure a safe rollout, we decided to use the code mode, launching the agent from within our application code. This allowed us to control when to start (or stop) the agent via our existing feature flag mechanism.
We have now integrated CodeGuru Profiler at a platform level, enabling any Atlassian service team to easily take advantage of this capability.
Inspect and latency
One of the first ways we utilized CodeGuru Profiler was to identify code paths that show obvious or well-known problems in terms of CPU utilization or latency. We searched for different forms of synchronization in the profiled data. One interesting case was an EnumMap that was wrapped in a Collections.synchronizedMap. The following screenshot shows the thread states of the stack frames in this code path for a span of 24 hours.
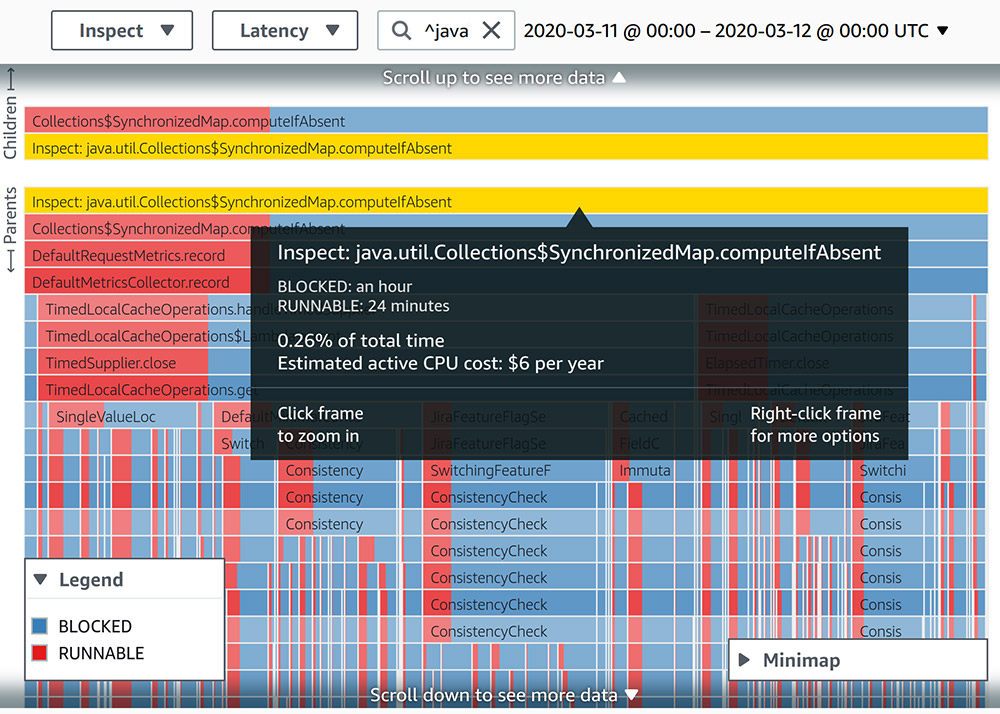
Although the involved stack trace consumes less than 0.5% of all runtime, when we visualized the latency of thread states, we saw that it spent twice the amount of time in a BLOCKED state than a RUNNABLE state. To increase the ratio of time spent in a RUNNABLE state, we moved away from using EnumMap to using an instance of ConcurrentHashMap.
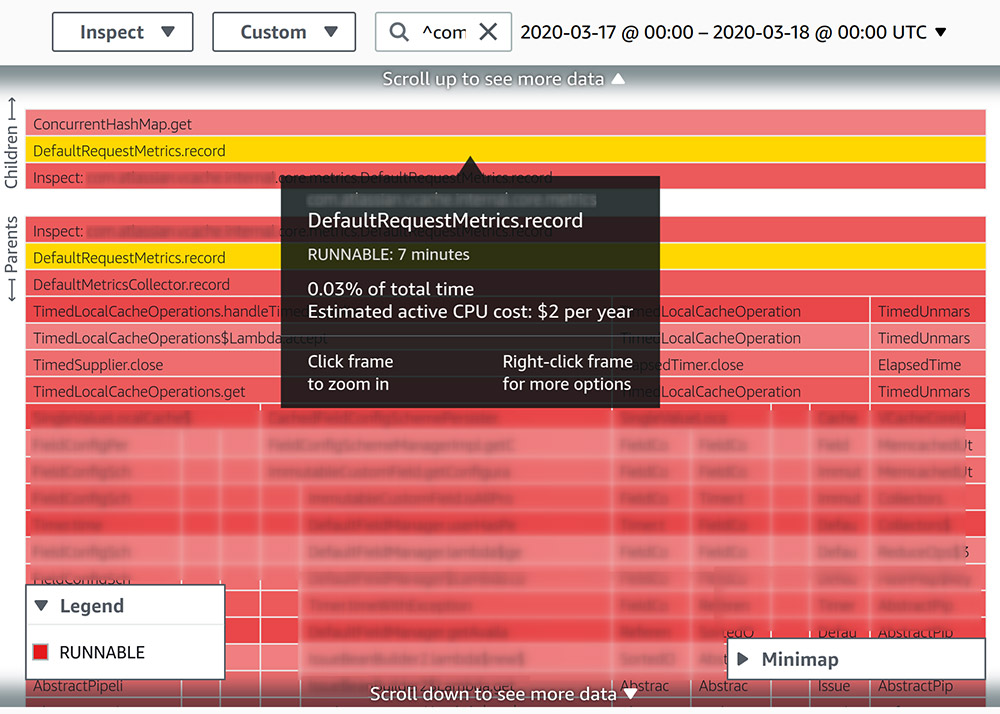
The following screenshot shows a profile of a similar 24-hour period. After we implemented the change, the relevant stack trace is now all in a RUNNABLE state.
Recommendation Reports
CodeGuru Profiler also provides a recommendation report on every profiling group, which identifies commonly known anti-patterns from a performance perspective and suggests known solutions. One such report we received (see the following screenshot) highlighted an issue with how we used Jackson ObjectMapper.
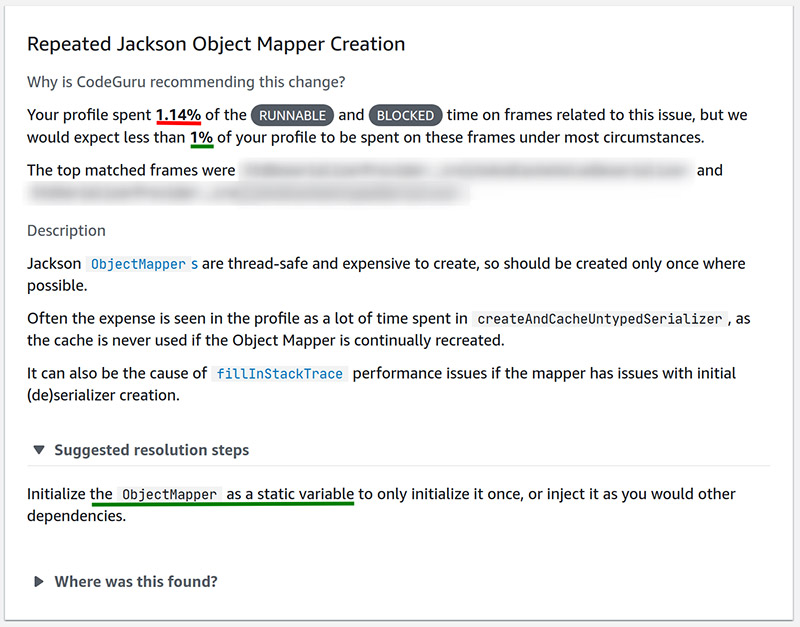
Upon receipt of this report, we quickly identified and resolved the problem code.
Conclusion
Integration with CodeGuru Profiler has been a major step forward for us, enabling every developer within Atlassian to own and take action on performance engineering.
Since enabling CodeGuru Profiler, we’ve already gained the following benefits:
- Any Atlassian developer can look up a profile from any point in time to understand the call paths that took place in production. This helps developers understand complex applications and aids us when investigating performance issues.
- The time to diagnose the root cause of performance issues in production has significantly reduced, and our developers no longer need to inject custom instrumentation code when diagnosing problems.
- Open availability of profile data across the organization has helped increase developer ownership of performance optimization.
We’re excited by what the CodeGuru Profiler team has built, and are looking forward to the profiling technologies and capabilities that they’ll build next.
About the Authors
|
|
|
|
|
Behrooz Nobakht Senior Software Engineer |
Matthew Ponsford Engineering Manager |
Narayanaswamy Anandapadmanabhan Senior Software Engineer |


We are Jira Cloud Performance from Atlassian. We make tools like Jira and Trello that are used by thousands of teams worldwide. We’re serious about creating amazing products, practices, and open work for all teams. Jira Cloud Performance is a specialized working group focused on enabling Jira and Atlassian teams to better observe, monitor, and enhance the performance of their products and services.