AWS News Blog
New- Amazon DevOps Guru Helps Identify Application Errors and Fixes
|
|
Today, we are announcing Amazon DevOps Guru, a fully managed operations service that makes it easy for developers and operators to improve application availability by automatically detecting operational issues and recommending fixes. DevOps Guru applies machine learning informed by years of operational excellence from Amazon.com and Amazon Web Services (AWS) to automatically collect and analyze data such as application metrics, logs, and events to identify behavior that deviates from normal operational patterns.
Once a behavior is identified as an operational problem or risk, DevOps Guru alerts developers and operators to the details of the problem so they can quickly understand the scope of the problem and possible causes. DevOps Guru provides intelligent recommendations for fixing problems, saving you time resolving them. With DevOps Guru, there is no hardware or software to deploy, and you only pay for the data analyzed; there is no upfront cost or commitment.
Distributed/Complex Architecture and Operational Excellence
As applications become more distributed and complex, operators need more automated practices to maintain application availability and reduce the time and effort spent on detecting, debugging, and resolving operational issues. Application downtime, for example, as caused by misconfiguration, unbalanced container clusters, or resource depletion, can result in significant revenue loss to an enterprise.
In many cases, companies must invest developer time in deploying and managing multiple monitoring tools, such as metrics, logs, traces, and events, and storing them in various locations for analysis. Developers or operators also spend time developing and maintaining custom alarms to alert them to issues such as sudden spikes in load balancer errors or unusual drops in application request rates. When a problem occurs, operators receive multiple alerts related to the same issue and spend time combining alerts to prioritize those that need immediate attention.
How DevOps Guru Works
The DevOps Guru machine learning models leverages AWS expertise in running highly available applications for the world’s largest e-commerce business for the past 20 years. DevOps Guru automatically detects operational problems, details the possible causes, and recommends remediation actions. DevOps Guru provides customers with a single console experience to search and visualize operational data by integrating data across multiple sources supporting Amazon CloudWatch, AWS Config, AWS CloudTrail, AWS CloudFormation, and AWS X-Ray and reduces the need to use multiple tools.
Getting Started with DevOps Guru
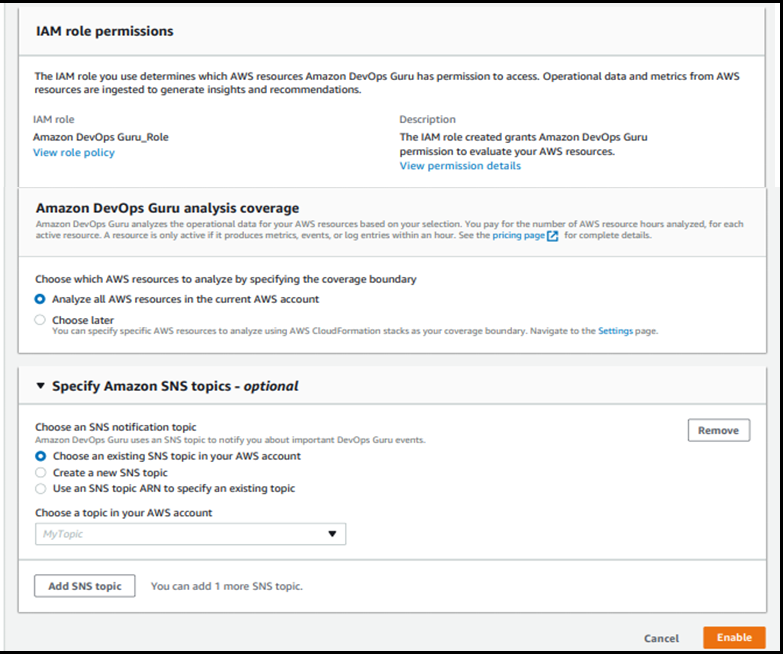
Activating DevOps Guru is as easy as accessing the AWS Management Console and clicking Enable. When enabling DevOps Guru, you can select the IAM role. You’ll then choose the AWS resources to analyze, which may include all resources in your AWS account or just specified CloudFormation StackSets. Finally, you can set an Amazon SNS topic if you want to send notifications from DevOps Guru via SNS.
DevOps Guru starts to accumulate logs and analyze your environment; it can take up to several hours. Let’s assume we have a simple serverless architecture as shown in this illustration.
When the system has an error, the operator needs to investigate if the error came from Amazon API Gateway, AWS Lambda, or AWS DynamoDB. They must then determine the root cause and how to fix the issue. With DevOps Guru, the process is now easy and simple.
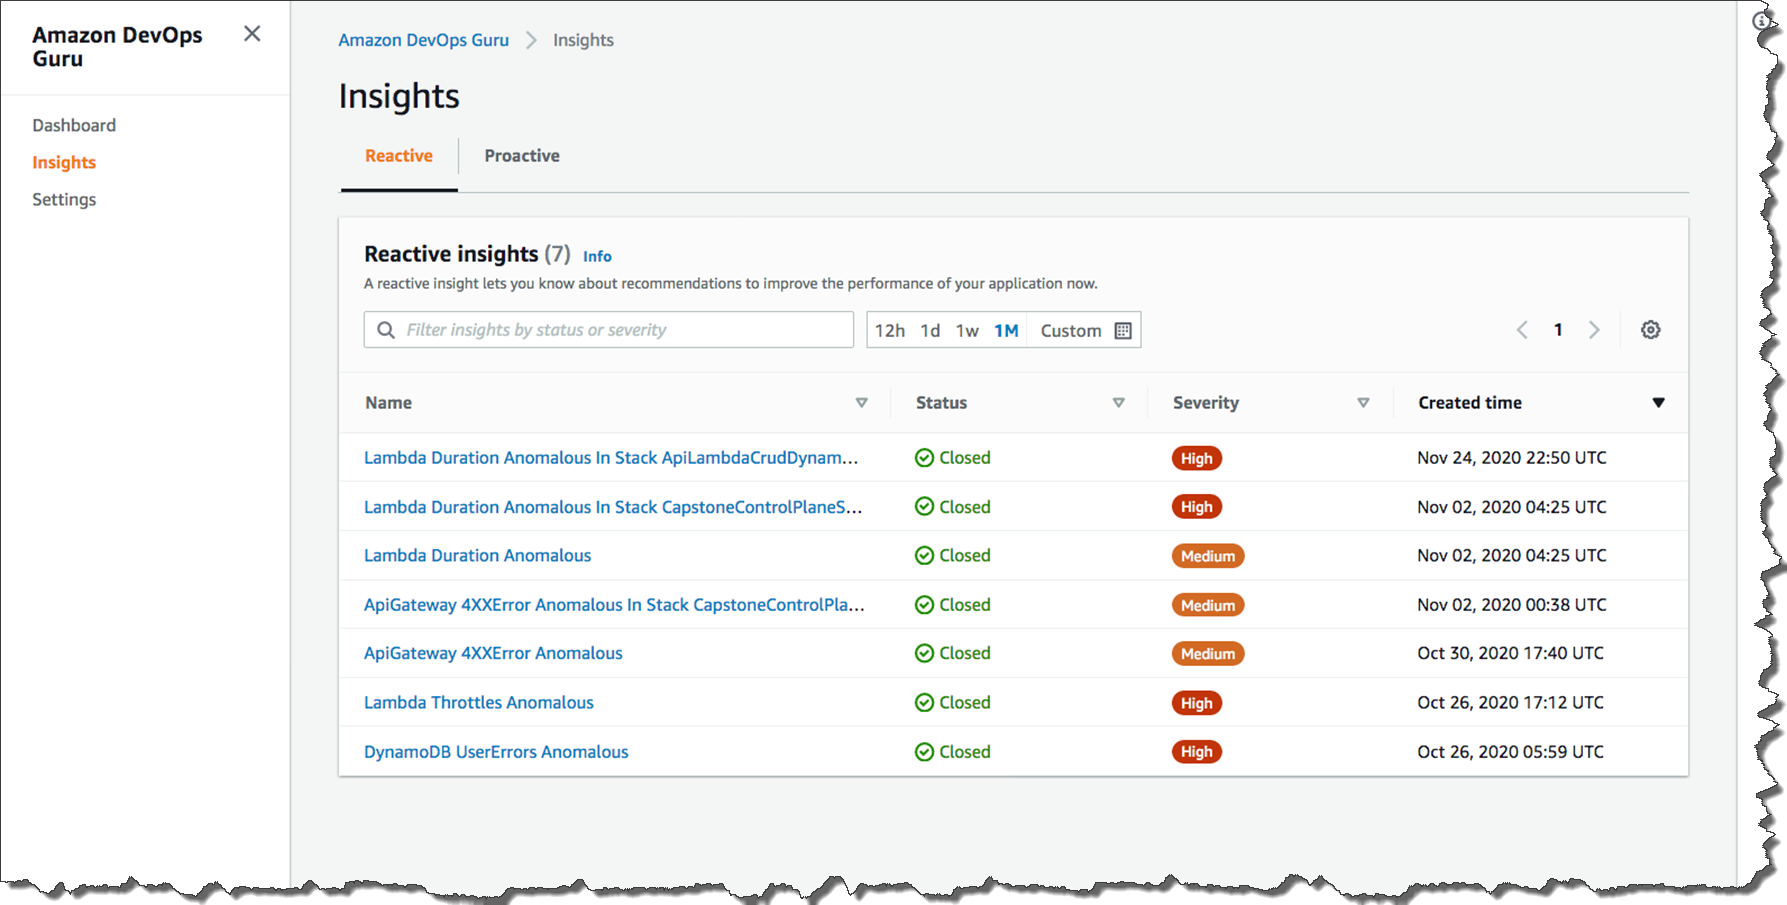
When a developer accesses the management console of DevOps Guru, they will see a list of insights which is a collection of anomalies that are created during the analysis of the AWS resources configured within your application. In this case, Amazon API Gateway, AWS Lambda, and Amazon DynamoDB. Each insight contains observations, recommendations, and contextual data you can use to better understand and resolve the operational problem.
The list below shows the insight name, the status (closed or ongoing), severity, and when the insight was created. Without checking any logs, you can immediately see that in the most recent issue (line1), a problem with a Lambda function within your stack was the cause of the issue, and it was related to duration. If the issue was still occurring, the status would be listed as Ongoing. Since this issue was temporary, the status is showing Closed.
Let’s look deeper at the most recent anomaly by clicking through the first insight link. There are two tabs: Aggregated metrics and Graphed anomalies.
Aggregated metrics display metrics that are related to the insight. Operators can see which AWS CloudFormation stack created the resource that emitted the metric, the name of the resource, and its type. The red lines on a timeline indicate spans of time when a metric emitted unusual values. In this case, the operator can see the specific time of day on Nov 24 when the anomaly occurred for each metric.
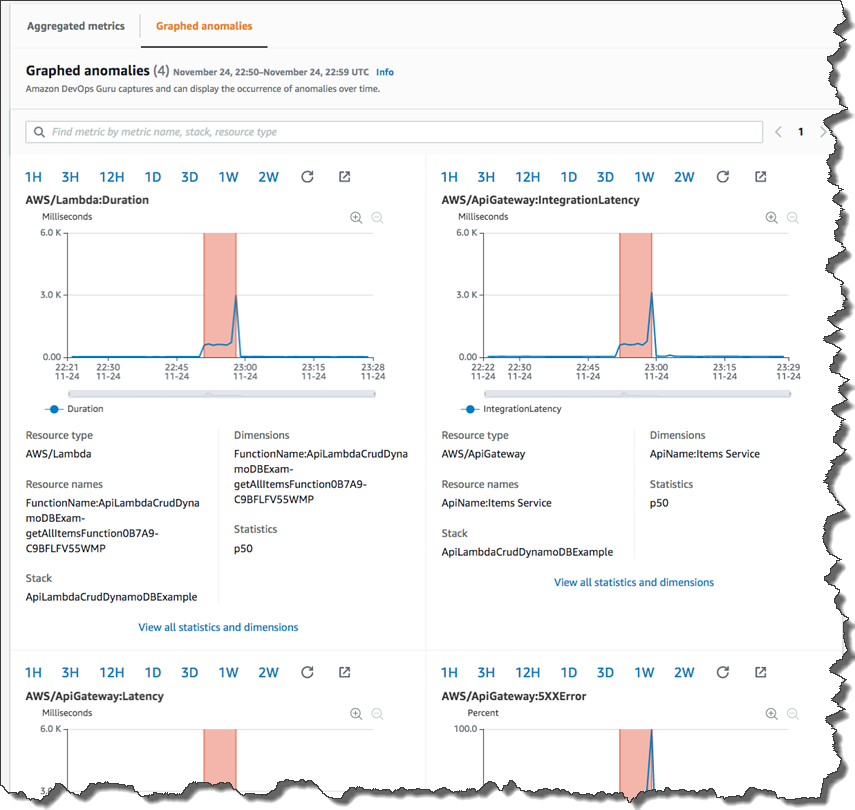
Graphed anomalies display detailed graphs for each of the insight’s anomalies. Operators can investigate and look at an anomaly at the resource level and per statistic. The graphs are grouped by metric name.
By reviewing aggregated and graphed anomalies, an operator can see when the issue occurred, whether it is still ongoing, as well as the resources impacted. It appears the increased Lambda duration had a corresponding impact on API Gateway causing timeouts and resulted in 5XX errors in API Gateway.
Dev Ops Guru also provides Relevant events which are related to activities that changed your application’s configuration as illustrated below.
We can now see that a configuration change happened 2 hours before this issue occurred. If we click the point on the graph at 20:30 on 11/24, we can learn more and see the details of that change.
If you click through to the Ops event, the AWS CloudTrail logs would show that the configuration change was twofold: 1) a change in the concurrency provisioned capacity on a Lambda function and 2) the reduction in the integration timeout on an API integration latency.
The recommendations tell the operator to evaluate the provisioned concurrency for Lambda and how to troubleshoot errors in API Gateway. After further evaluation, the operator will discover this is exactly correct. The root cause is a mismatch between the Lambda provisioned concurrency setting and the API Gateway integration latency timeout. When the Lambda configuration was updated in the last deployment, it altered how this application responded to burst traffic, and it no longer fit within the API Gateway timeout window. This error is unlikely to have been found in unit testing and will occur repeatedly if the configurations are not updated.
DevOps Guru can send alerts of anomalies to operators via Amazon SNS, and it is integrated with AWS Systems Manager OpsCenter, enabling customers to receive insights directly within OpsCenter as quickly diagnose and remediate issues.
Available for Preview Today
Amazon DevOps Guru is available for preview in US East (N. Virginia), US East (Ohio), US West (Oregon), Europe (Ireland), and Asia Pacific (Tokyo). To learn more about DevOps Guru, please visit our web site and technical documentation, and get started today.
– Kame


