AWS Big Data Blog
A systematic approach to benchmarking SQL processing engines on AWS
Selecting the right SQL processing solution for large-scale data analytics is a critical decision for organizations. As data volumes grow exponentially, the technology landscape has evolved to offer diverse options for processing and analyzing this information efficiently. This post presents a systematic framework for evaluating and benchmarking SQL processing engines on AWS, using Apache JMeter to conduct practical performance testing at scale.
The AWS analytics ecosystem
AWS offers a rich portfolio of SQL processing solutions to meet various analytical needs:
- Serverless query services – Amazon Athena is a serverless, interactive query service that uses standard SQL to analyze data in Amazon Simple Storage Service (Amazon S3), offering automatic scaling, parallel query execution, and pay-per-query pricing with no infrastructure management required
- Data warehouse solutions – Amazon Redshift offers scalable, high-performance cloud data warehousing with serverless options, zero-ETL integrations, AI-powered query assistance, and seamless machine learning (ML) integration for modern analytics at scale
- Managed open source engines – Amazon EMR supports Apache Spark SQL, Apache Trino (formerly PrestoSQL), and other distributed query frameworks
- Self-managed options – You can deploy open source engines like Apache Spark, Apache Flink, and Trino on Amazon Elastic Kubernetes Service (Amazon EKS) for greater control
- Partner solutions – You can access specialized big data analytics tools through AWS Marketplace
These options are further enhanced by modern open table formats such as Apache Iceberg, Delta Lake, and Apache Hudi, which bring crucial enterprise features like ACID (Atomicity, Consistency, Isolation, and Durability) transactions, schema evolution, and time travel capabilities to data lakes. These SQL processing solutions operate under the AWS Shared Responsibility Model. AWS manages the security of the underlying infrastructure and services, and customers are responsible for secure configuration, access management, and data protection within their testing environments. This division of responsibility remains important when evaluating and benchmarking different SQL engines. Proper security configuration and implementation by customers is essential for maintaining a secure analytics environment.
Evaluation challenges in SQL engine selection
The rich ecosystem of SQL processing options creates significant evaluation challenges. Each SQL engine employs unique architectural approaches and optimization strategies, making direct comparisons complex. Organizations embarking on this evaluation journey face several interconnected obstacles:
- Creating environments that accurately reflect production scenarios
- Developing test datasets that mirror real-world data characteristics and volumes
- Replicating real-world query patterns and concurrency levels
- Maintaining uniform testing conditions across different engine architectures
- Controlling infrastructure expenses throughout the evaluation process
Performance considerations at petabyte scale
When evaluating solutions for petabyte-scale deployments, the complexity intensifies considerably. Several critical factors come into play:
- Resource management – Distributed SQL engines require precise balancing of CPU, memory, and storage resources. Suboptimal resource allocation can lead to query failures and performance degradation, particularly as data volumes grow.
- Data distribution patterns – How data is distributed across partitions or nodes significantly impacts query performance. Data skew can create processing bottlenecks, with some nodes handling disproportionate workloads while others remain underutilized.
- Concurrency handling – High-concurrency environments demand sophisticated workload scheduling and resource isolation mechanisms. The ability to maintain consistent performance under varying concurrent loads becomes a critical differentiator between solutions.
- Meaningful metrics – Performance evaluation at scale requires comprehensive metrics analysis:
- Mean, median, and percentile response times (particularly p90 and p95)
- Query throughput under varying concurrency levels
- Scalability characteristics across diverse workload types
- Resource utilization efficiency during peak loads
Limitations of traditional benchmarks
Although industry-standard benchmarks like TPC-DS and TPC-H provide valuable insights, our experience with multiple customer engagements has shown that tailored, workload-specific testing often reveals performance characteristics not captured by these standardized tests. This is especially true for complex, multi-tenant environments with diverse query patterns. Organizations that complement standard benchmarks with workload-specific testing typically experience shorter proof-of-concept cycles, optimized evaluation costs, and more efficient testing operations. This comprehensive approach helps reduce uncertainty in the final solution selection process.
Prerequisites
Before you dive into the evaluation process, make sure you have the following prerequisites:
- An AWS account with appropriate permissions to create and manage Amazon Elastic Compute Cloud (Amazon EC2) instances and access the SQL engines you plan to benchmark.
- Basic familiarity with AWS services, particularly Amazon EC2 and the SQL engines you intend to evaluate (such as Athena, Amazon Redshift, or Amazon EMR).
- Experience with SQL and data analytics concepts.
- Access to the SQL engines you choose to benchmark. This post assumes you’ve already set up the engines you want to test. For setup instructions, refer to the AWS documentation for each service.
- A dataset suitable for your benchmarking needs. Dataset creation and loading are not covered in this post. Build petabyte-scale synthetic test data with Amazon EMR on EC2 provides prescriptive guidance to generate test datasets at scale. Make sure your test datasets are stored in S3 buckets with encryption enabled (using SSE-KMS or SSE-S3) and that all service connections use TLS for data in transit.
Benefits of Apache JMeter
As organizations scale their analytics workloads to petabyte levels, there is a growing need for a robust, structured approach to SQL query performance testing. Although many organizations develop custom testing frameworks or use various benchmarking tools, these approaches often lack standardization and can be difficult to replicate across different SQL engines. The complexity of modern data architectures, combined with the variety of available SQL processing solutions, demands a systematic evaluation methodology. Apache JMeter emerges as a powerful solution to address this challenge. Though traditionally known for web application testing, JMeter’s extensible architecture and robust feature set make it particularly well-suited for SQL performance testing at scale.JMeter offers several advantages for evaluating SQL engines:
- Support for multiple protocols and connections
- Ability to simulate complex concurrent workloads
- Built-in performance metrics and reporting
- Extensible architecture for custom testing scenarios
- Integration capabilities with continuous integration and continuous delivery (CI/CD) pipelines
Through this proposed framework, which has been validated across multiple customer engagements at petabyte scale, we aim to help organizations make more informed decisions when selecting a SQL processing solution. Our experience working with customers to assess various AWS Analytics services and open source solutions has demonstrated that a systematic evaluation approach significantly reduces proof-of-concept cycles and optimizes resource investments. This framework has helped organizations effectively evaluate services like Athena, Amazon Redshift, and Amazon EMR, alongside open source solutions such as Trino on Amazon EKS, based on their specific workload profiles and performance requirements.With this methodology, organizations can accomplish the following:
- Navigate the complex landscape of large-scale data processing technologies
- Reduce proof-of-concept cycles from months to weeks
- Minimize infrastructure costs during evaluation phases
- Make data-driven decisions about technology selection
- Better align technology choices with business requirements
- Establish repeatable testing patterns for future evaluations
Testing methodology in practice
A successful SQL engine evaluation requires understanding and replicating real-world workload patterns. Our methodology, refined through numerous customer engagements, focuses on comprehensive testing across multiple dimensions while remaining adaptable to specific organizational needs.
Query pattern selection
We begin by selecting representative query patterns that mirror production workloads:
- Aggregation queries that summarize large datasets using operations like SUM, AVG, and COUNT
- Complex join operations that test the engine’s ability to combine data efficiently across multiple tables
- String operations that evaluate text processing capabilities
- Nested queries that assess the engine’s optimization capabilities for complex query structures
A carefully selected set of 8–10 queries typically provides sufficient coverage while keeping the evaluation manageable. These should reflect your actual workload characteristics and business requirements.
Data volume variations
Testing across different data volumes is important for understanding scalability characteristics. We structure our tests around varying data scan ranges:
- Small-scale scans – Queries accessing 1–7 days of data (megabytes to gigabytes)
- Large-scale scans – Queries spanning 14–30 days (terabytes to petabytes)
This approach evaluates both I/O efficiency with large datasets and metadata handling with smaller, frequent queries, helping understand how services like Amazon EMR, Amazon Redshift, or Athena optimize query execution across different access patterns.
Concurrency testing
Real-world analytics environments rarely process single queries in isolation. Our methodology incorporates the following features:
- Progressive concurrency testing starting at lower levels (typically 16, 32, 64, and 128 parallel queries), though these numbers can be adjusted based on your test infrastructure capacity and specific requirements. We recommend starting with smaller concurrency levels and gradually scaling up to understand performance characteristics
- Varied query complexity and frequency (referred to as query weights) to simulate realistic workload distributions. This means some queries are run more often or are more resource-intensive than others, mimicking real-world usage patterns.
- Mixed query patterns running simultaneously to test resource management.
- Consistent execution across different date ranges to evaluate scaling behavior.
This approach is particularly important when evaluating managed services like the workload management capabilities of Amazon Redshift or the resource allocation strategies of Amazon EMR.
Query weight distribution
Production environments typically see varying frequencies of different query types. Our framework incorporates weighted query distribution to simulate real-world scenarios more accurately. In a typical distribution, frequent lightweight queries might represent 60% of the workload, complex analytical queries might comprise 30%, and resource-intensive data processing operations might make up the remaining 10%.This weighted approach makes sure performance testing reflects actual usage patterns rather than artificial benchmarking scenarios. The exact distribution should mirror your organization’s specific workload patterns.
Sequential vs. concurrent testing
Our methodology implements two distinct testing phases:
- Sequential testing – Establishes baseline performance metrics:
- Runs each query type independently across different date ranges
- Runs multiple iterations to provide consistency and identify variability
- Helps understand individual query performance characteristics
- Concurrent testing – Simulates real-world multi-user scenarios:
- Implements weighted query distributions
- Tests different concurrency levels to identify scaling limitations
- Evaluates resource management capabilities of different engines
JMeter efficiently implements both testing phases while maintaining consistent test conditions across SQL engines. Its ability to handle various JDBC connections makes it particularly suitable for testing AWS analytics services.Through this structured approach, organizations can gather comprehensive performance data reflecting their specific use cases, enabling informed SQL engine selection decisions while maintaining core principles of systematic evaluation and realistic workload simulation.
Test plans
To evaluate SQL engines’ performance under varying workloads, we designed two test scenarios: sequential and concurrent execution plans. Each scenario was executed across different data volumes by adjusting the query date range filters to cover 1, 7, 14, and 30 days. These variations simulate typical analytical workloads with progressively increasing data sizes.For sequential runs, each test was treated as a distinct batch, grouping all queries (Query 1 to Query 9) under the same date range—each query will scan data for 1, 7, 14, and 30 days with appropriate date filtering in the query’s where predicate. We used JMeter to capture average query response times for each batch. This configuration was run three times, and the final metrics reflect the average response time across these iterations to ensure reliability and account for environmental variance.Although three iterations provide initial insights, if you observe significant variations in results (typically more than 10% deviation between runs), consider expanding to 10 or more iterations. This additional sampling helps establish statistical significance, identify true performance patterns, and distinguish outliers (beyond three standard deviations) from normal variations. Document any consistent anomalies, because they may indicate important performance or security considerations for your specific environment.The following table shows the sample test plans template for the sequential test plan run.
| Dataset Time Range | Run | Query Weights | ||||||||
| Query 1 | Query 2 | Query 3 | Query 4 | Query 5 | Query 6 | Query 7 | Query 8 | Query 9 | ||
| 1 day | Run 1 | |||||||||
| Run 2 | ||||||||||
| Run 3 | ||||||||||
| Avg | ||||||||||
| 7 days | Run 1 | |||||||||
| Run 2 | ||||||||||
| Run 3 | ||||||||||
| Avg | ||||||||||
| 14 days | Run 1 | |||||||||
| Run 2 | ||||||||||
| Run 3 | ||||||||||
| Avg | ||||||||||
| 30 days | Run 1 | |||||||||
| Run 2 | ||||||||||
| Run 3 | ||||||||||
| Avg | ||||||||||
For the concurrent test plan, we introduced a probabilistic weighted distribution to the queries (Query 1 to Query 9), simulating a more realistic production-like environment where query frequency varies based on business relevance and usage patterns. This added a layer of complexity to better reflect how the SQL engine would perform under real-world concurrent access patterns.The following table shows the sample test plans template for the concurrent test plan run.
| Dataset Time Range | Concurrent Runs | Query Weights | ||||||||
| Query 1 | Query 2 | Query 3 | Query 4 | Query 5 | Query 6 | Query 7 | Query 8 | Query 9 | ||
| 1 days | 8 | 11% | 11% | 11% | 11% | 11% | 11% | 11% | 11% | 11% |
| 16 | 10% | 5% | 24% | 5% | 5% | 5% | 24% | 14% | 10% | |
| 32 | 8% | 3% | 24% | 5% | 5% | 5% | 24% | 16% | 8% | |
| 64 | 7% | 3% | 24% | 6% | 4% | 6% | 26% | 16% | 9% | |
| 128 | 1% | 4% | 19% | 8% | 5% | 7% | 14% | 20% | 22% | |
| *7 days | 8 | 11% | 11% | 11% | 11% | 11% | 11% | 11% | 11% | 11% |
| 16 | 10% | 5% | 24% | 5% | 5% | 5% | 24% | 14% | 10% | |
| 32 | 8% | 3% | 24% | 5% | 5% | 5% | 24% | 16% | 8% | |
| 64 | 7% | 3% | 24% | 6% | 4% | 6% | 26% | 16% | 9% | |
| **128 | 1% | 4% | 19% | 8% | 5% | 7% | 14% | 20% | 22% | |
| 14 days | 8 | 11% | 11% | 11% | 11% | 11% | 11% | 11% | 11% | 11% |
| 16 | 10% | 5% | 24% | 5% | 5% | 5% | 24% | 14% | 10% | |
| 32 | 8% | 3% | 24% | 5% | 5% | 5% | 24% | 16% | 8% | |
| 64 | 7% | 3% | 24% | 6% | 4% | 6% | 26% | 16% | 9% | |
| 128 | 1% | 4% | 19% | 8% | 5% | 7% | 14% | 20% | 22% | |
| 30 days | 8 | 11% | 11% | 11% | 11% | 11% | 11% | 11% | 11% | 11% |
| 16 | 10% | 5% | 24% | 5% | 5% | 5% | 24% | 14% | 10% | |
| 32 | 8% | 3% | 24% | 5% | 5% | 5% | 24% | 16% | 8% | |
| 64 | 7% | 3% | 24% | 6% | 4% | 6% | 26% | 16% | 9% | |
| 128 | 1% | 4% | 19% | 8% | 5% | 7% | 14% | 20% | 22% | |
For example, for configuration of *7 days concurrent run with **128 concurrency, the proposed configuration distributes Query 1 to Query 9 with appropriate weighted submissions such that Query 9 is executed the greatest number of times in the overall 128 executions submitted across all 9 queries for this run.
JMeter setup
To begin, you must set up JMeter on a machine that can handle the desired test load. An EC2 instance is a flexible and cost-effective option. Choose an instance type with sufficient vCPUs to support your maximum planned concurrency. For example, a c6i.4xlarge or higher is typically suitable for moderate to high throughput testing scenarios. For the operating system, you might choose Amazon Linux, which is optimized for AWS. For production-grade testing environments, deploy the JMeter EC2 instance in a private subnet of a virtual private cloud (VPC) with appropriate security groups that allow only required connections. This network isolation helps maintain security while executing performance tests. Consider using Amazon Virtual Private Cloud (Amazon VPC) endpoints for secure access to AWS services.
After the instance is provisioned, install Java (Java 17 LTS or Java 21 LTS) and download the latest version of JMeter. Be sure to configure the system with appropriate JVM options to allocate sufficient heap memory for large-scale test executions. Refer to Getting Started to learn more.
JMeter concepts
Before you create test plans in JMeter, it’s important to understand a few foundational concepts that influence how your test plan behaves—such as thread groups, user-defined variables, and JDBC connection. These components enable the simulation of real-world query loads, including concurrency and pacing.
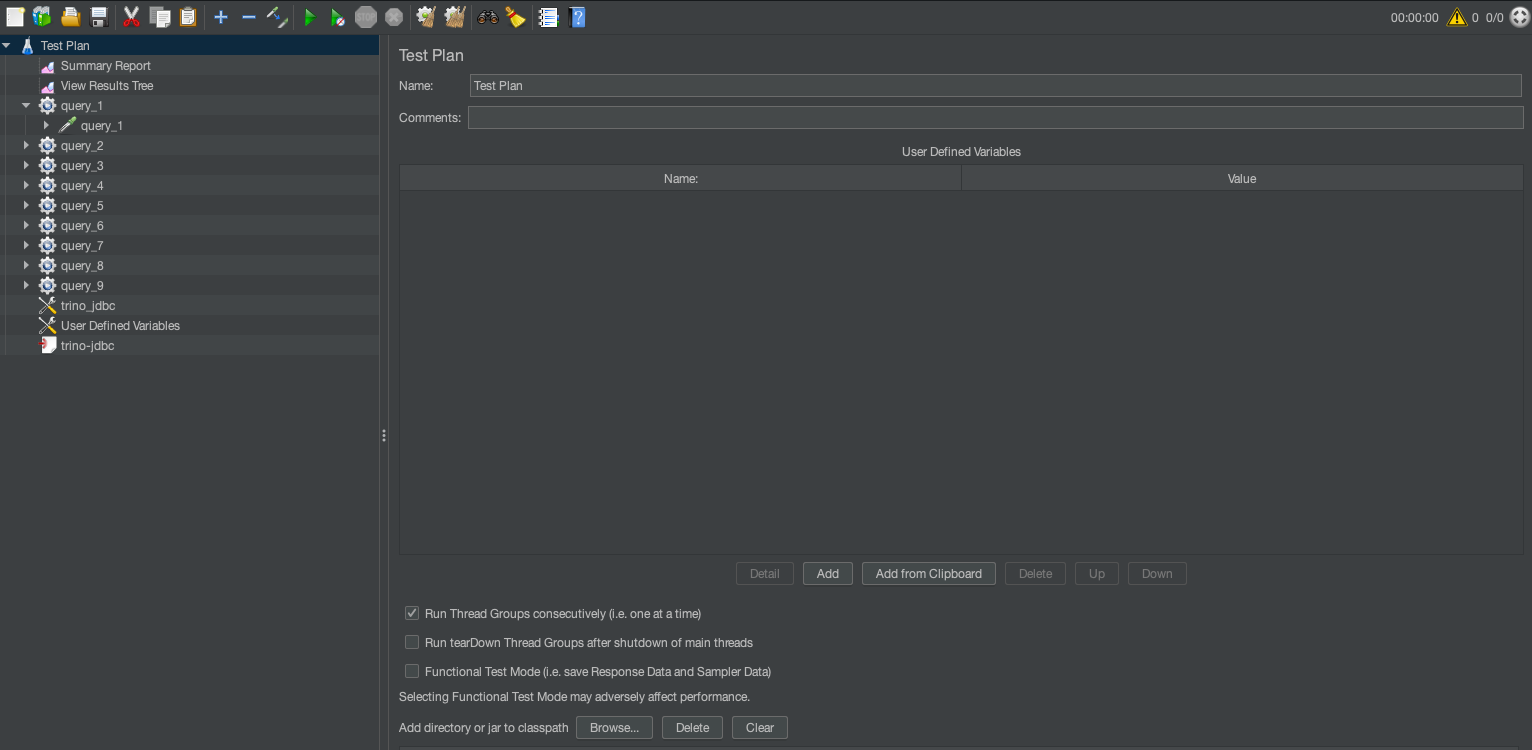
Test plans
The test plan is the top-level container for a JMeter test. It defines the overall testing strategy, including the queries to execute, their parameters, and the concurrent user behavior. These plans are represented as jmx files that can then be used for CLI-based execution. JMeter supports both GUI and CLI modes. It is highly recommended that you use the JMeter GUI primarily for creating test plans as jmx, and use the CLI for large load tests. You can also run thread groups consecutively for sequential execution. The default behavior is to run all thread groups in parallel suited for concurrent execution. Refer to Building a Test Plan to learn more about options available with test plans.
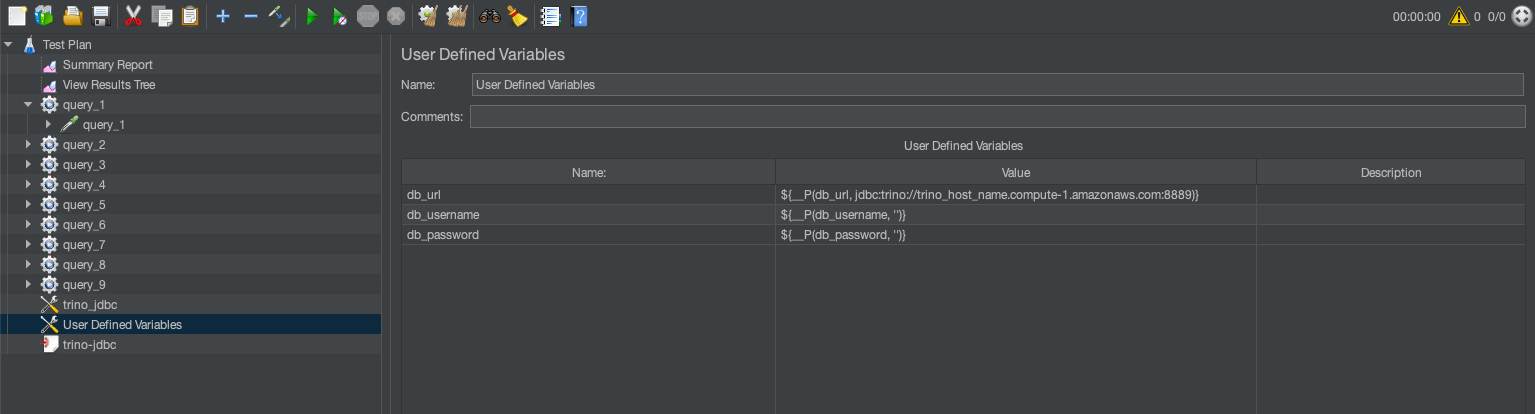
User-defined variables
User-defined variables are global parameters that you can reuse throughout the test plan. They are helpful for defining database credentials, server URLs, or query parameters. For example:DB_URL=jdbc:trino://trino-cluster.example.com:8889?SSL=true #Enable SSL/TLS
You can configure authentication (user name and password) through your organization’s approved methods, such as AWS Secrets Manager (see Move hardcoded secrets to AWS Secrets Manager) AWS Identity and Access Management (IAM) roles, or other secure credential management systems.
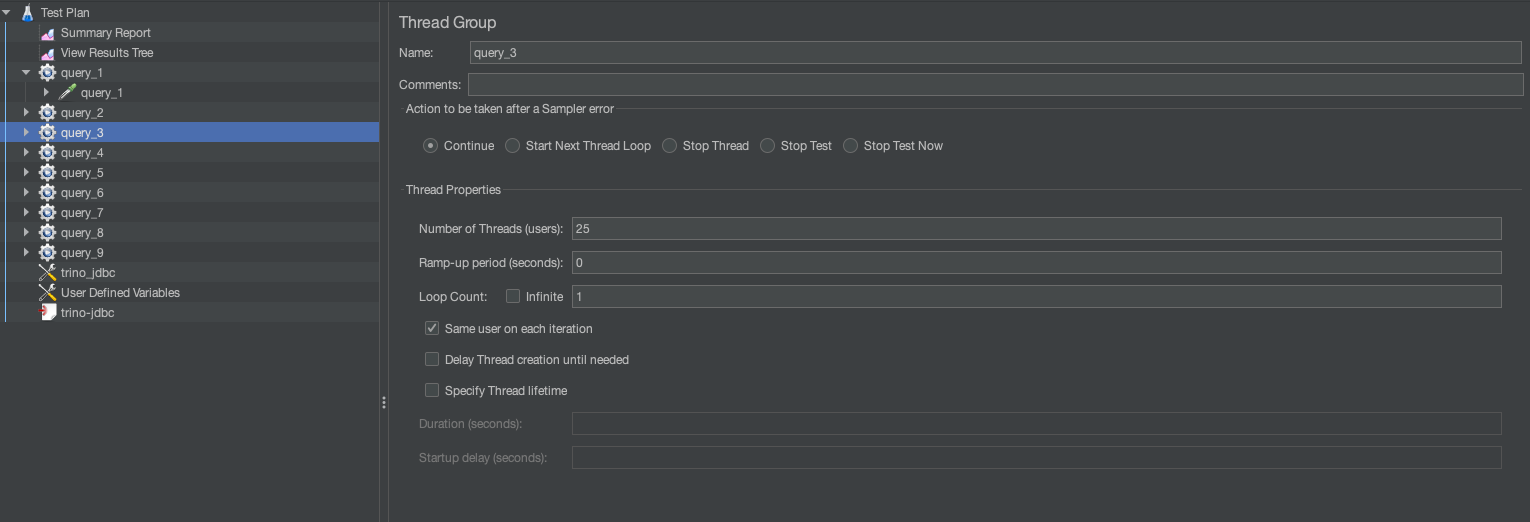
Thread groups
A thread group represents a group of virtual users (threads) executing test actions. Each thread simulates a single user sending requests to the SQL engine. This can be used to simulate concurrent runs. For example, in the preceding template, Query 3 has 19% weightage across 128 runs. This means .19*128=25 total runs, so we set the thread group to 25.
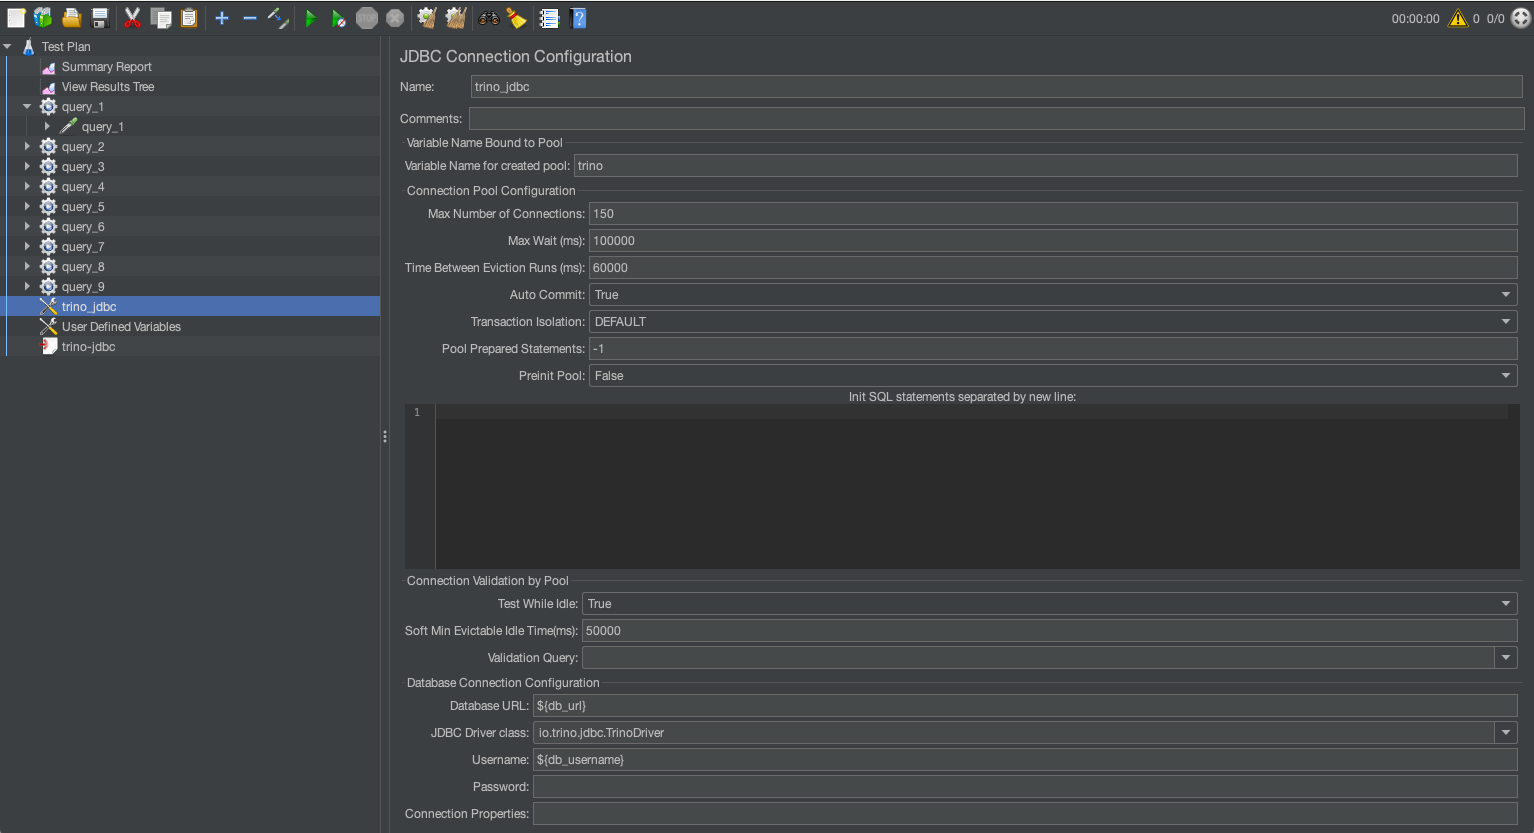
JDBC connection configuration
JDBC connection configuration sets up the database connection for the test. It specifies the database URL, driver, and credentials required for executing SQL queries. Key fields to configure are database URL and JDBC driver class. The following table summarizes the different configuration settings.
| SQL Engine | JDBC Driver | JDBC Driver Class |
| Trino on EMR | trino-jdbc-<trino_version>-amzn-0.jar |
io.trino.jdbc.TrinoDriver |
| Athena | Athena JDBC 3.x driver | com.amazon.athena.jdbc.AthenaDriver |
| Amazon Redshift | Amazon Redshift JDBC driver | com.amazon.redshift.jdbc.Driver |
| Trino on EKS | Trino JDBC driver | io.trino.jdbc.TrinoDriver |
JDBC requests
The JDBC request executes SQL queries against the database using the configuration defined in the JDBC connection configuration.
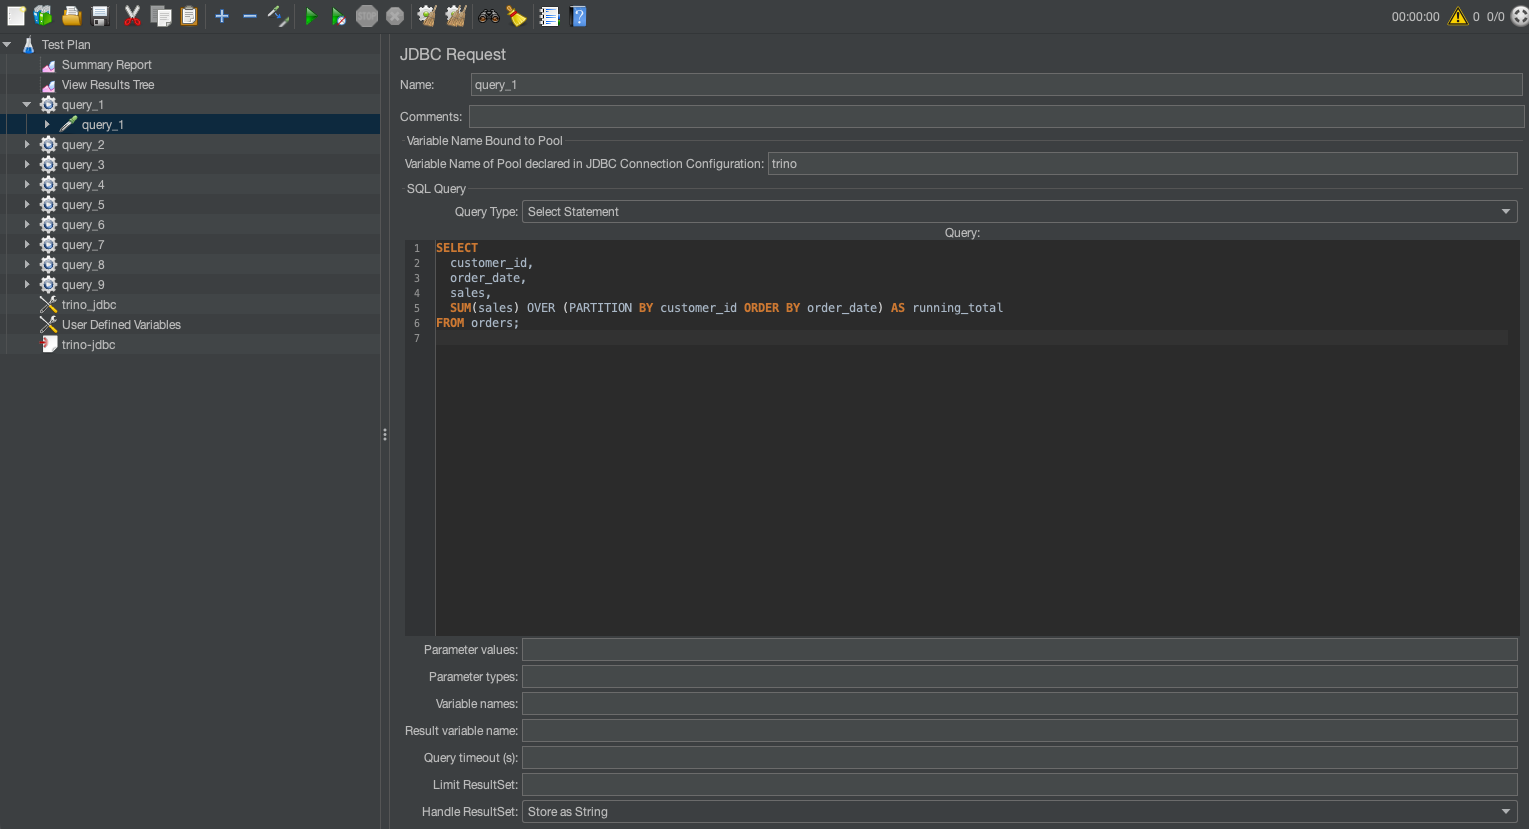
For example, following command runs the JMeter in CLI mode:
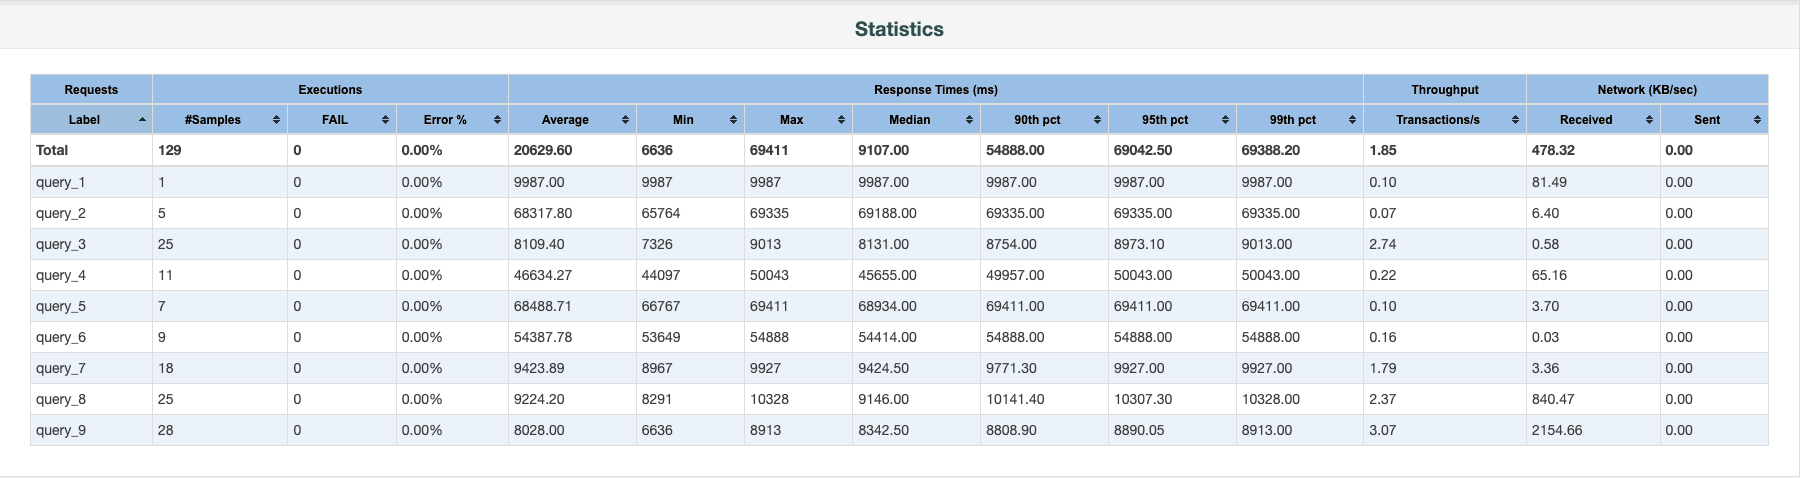
The output folder will contain an HTML report with different statistics. The following screenshot illustrates 128 concurrent runs.
Monitoring and logging
For comprehensive visibility and audit requirements, enable AWS CloudTrail logging, VPC Flow Logs, and service-specific logs (like Amazon S3 access logs). These logs can be centralized in Amazon CloudWatch Logs for monitoring and analysis. This provides proper audit trails while evaluating different SQL engines and helps track access patterns and potential security events.
Post-test steps
After running your JMeter tests, proceed with the following steps:
- Review the HTML report’s key metrics, including response times, throughput, and error rates across different query types and concurrency levels.
- Run identical test plans across your candidate SQL engines for direct performance comparison.
- Refine your test plans based on initial findings, focusing on areas where performance differences are significant.
- Factor in the cost implications alongside performance metrics to make a balanced decision.
These steps can help you systematically evaluate and select the most suitable SQL engine for your analytics workloads.
Resources
In the preceding steps, we walked through a UI-based setup for JMeter along with test plans. We have created a few sample JMeter test plans for both sequential and concurrent runs along with sample test reports. You can modify the plans to fit your needs.
- JMeter sample report
- JMeter test plan for sequential run
- JMeter test plan for concurrent run
Clean up
After you complete your benchmarking process, clean up the resources to avoid unnecessary costs:
- Stop or delete the EC2 instances used for running JMeter.
- Depending on which SQL engines you used for testing, clean up active resources.
- Review your AWS Management Console to confirm no active resources remain.
- If you created test datasets in Amazon S3 or other storage services specifically for this benchmarking, consider deleting them if they’re no longer needed.
- Although JMeter test plans and results don’t incur AWS costs, organize or delete local files as needed for your record-keeping.
Summary
Selecting the right SQL processing solution for large-scale analytics demands a systematic, data-driven approach. Our JMeter framework can help organizations effectively evaluate different SQL engines by simulating real-world workload patterns across various query types, data volumes, and concurrency levels. This methodology reduces proof-of-concept cycles and provides insights beyond traditional benchmarks, helping you assess managed AWS services like Athena and Amazon Redshift and open source solutions on Amazon EKS.