AWS Database Blog
Troubleshoot Amazon RDS for Oracle to Amazon Redshift DMS migrations with AWS DevOps Agent
When you troubleshoot AWS Database Migration Service (AWS DMS) issues in Amazon RDS for Oracle to Amazon Redshift migration, the investigations can be time-consuming and require deep expertise across multiple AWS services. AWS DMS is a managed service that migrates databases to AWS with minimal downtime, supporting both homogeneous and heterogeneous migrations. But when something goes wrong in a database migration, finding the root cause is the hard part.
In this post, we show how you can use AWS DevOps Agent to investigate, identify root causes of, and remediate common AWS DMS issues when migrating from Amazon RDS to Amazon Redshift. DevOps Agent is a Frontier agent that autonomously triages incidents 24/7, providing root cause analysis and recommended actions for resolution based on correlated metrics, logs, and application topology.
We walk through the solution architecture, configure Amazon CloudWatch alarms for key DMS metrics, set up Amazon EventBridge to AWS Lambda integration to trigger investigations automatically, and then demonstrate two real-world scenarios: CDC source latency on Oracle and CDC target latency on Amazon Redshift, showing how DevOps Agent investigates each one.
Challenges with troubleshooting DMS migrations
Migrating data from Oracle to Amazon Redshift using AWS DMS involves several components working together: the replication instance, source and target endpoints, full load tasks, change data capture (CDC), and the underlying network and IAM configurations.
When something goes wrong, you typically need to check DMS task status and table statistics, examine CloudWatch metrics and logs across multiple log components, correlate replication instance resource usage with task-level errors, and troubleshoot source and target specific issues across different consoles. This requires correlating timestamps across services and specialized knowledge of both Oracle and Amazon Redshift internals.
By the time the root cause is identified, the business impact such as stale data in Amazon Redshift or missed SLA windows may have already grown.
The DevOps Agent correlates CloudWatch metrics, DMS task logs, and Amazon Redshift system tables in a single investigation. There’s no need to navigate multiple consoles. It builds an application topology that maps relationships between your replication instance, Oracle source, and Amazon Redshift target, so you don’t have to manually match timestamps across services. It applies deep Oracle and Amazon Redshift knowledge, delivering a root cause analysis with actionable remediation steps in minutes, not hours.
Solution overview
This solution uses Amazon CloudWatch, Amazon EventBridge, and AWS Lambda to route DMS alerts to DevOps Agent for automated investigation. The following diagram shows how these components work together:
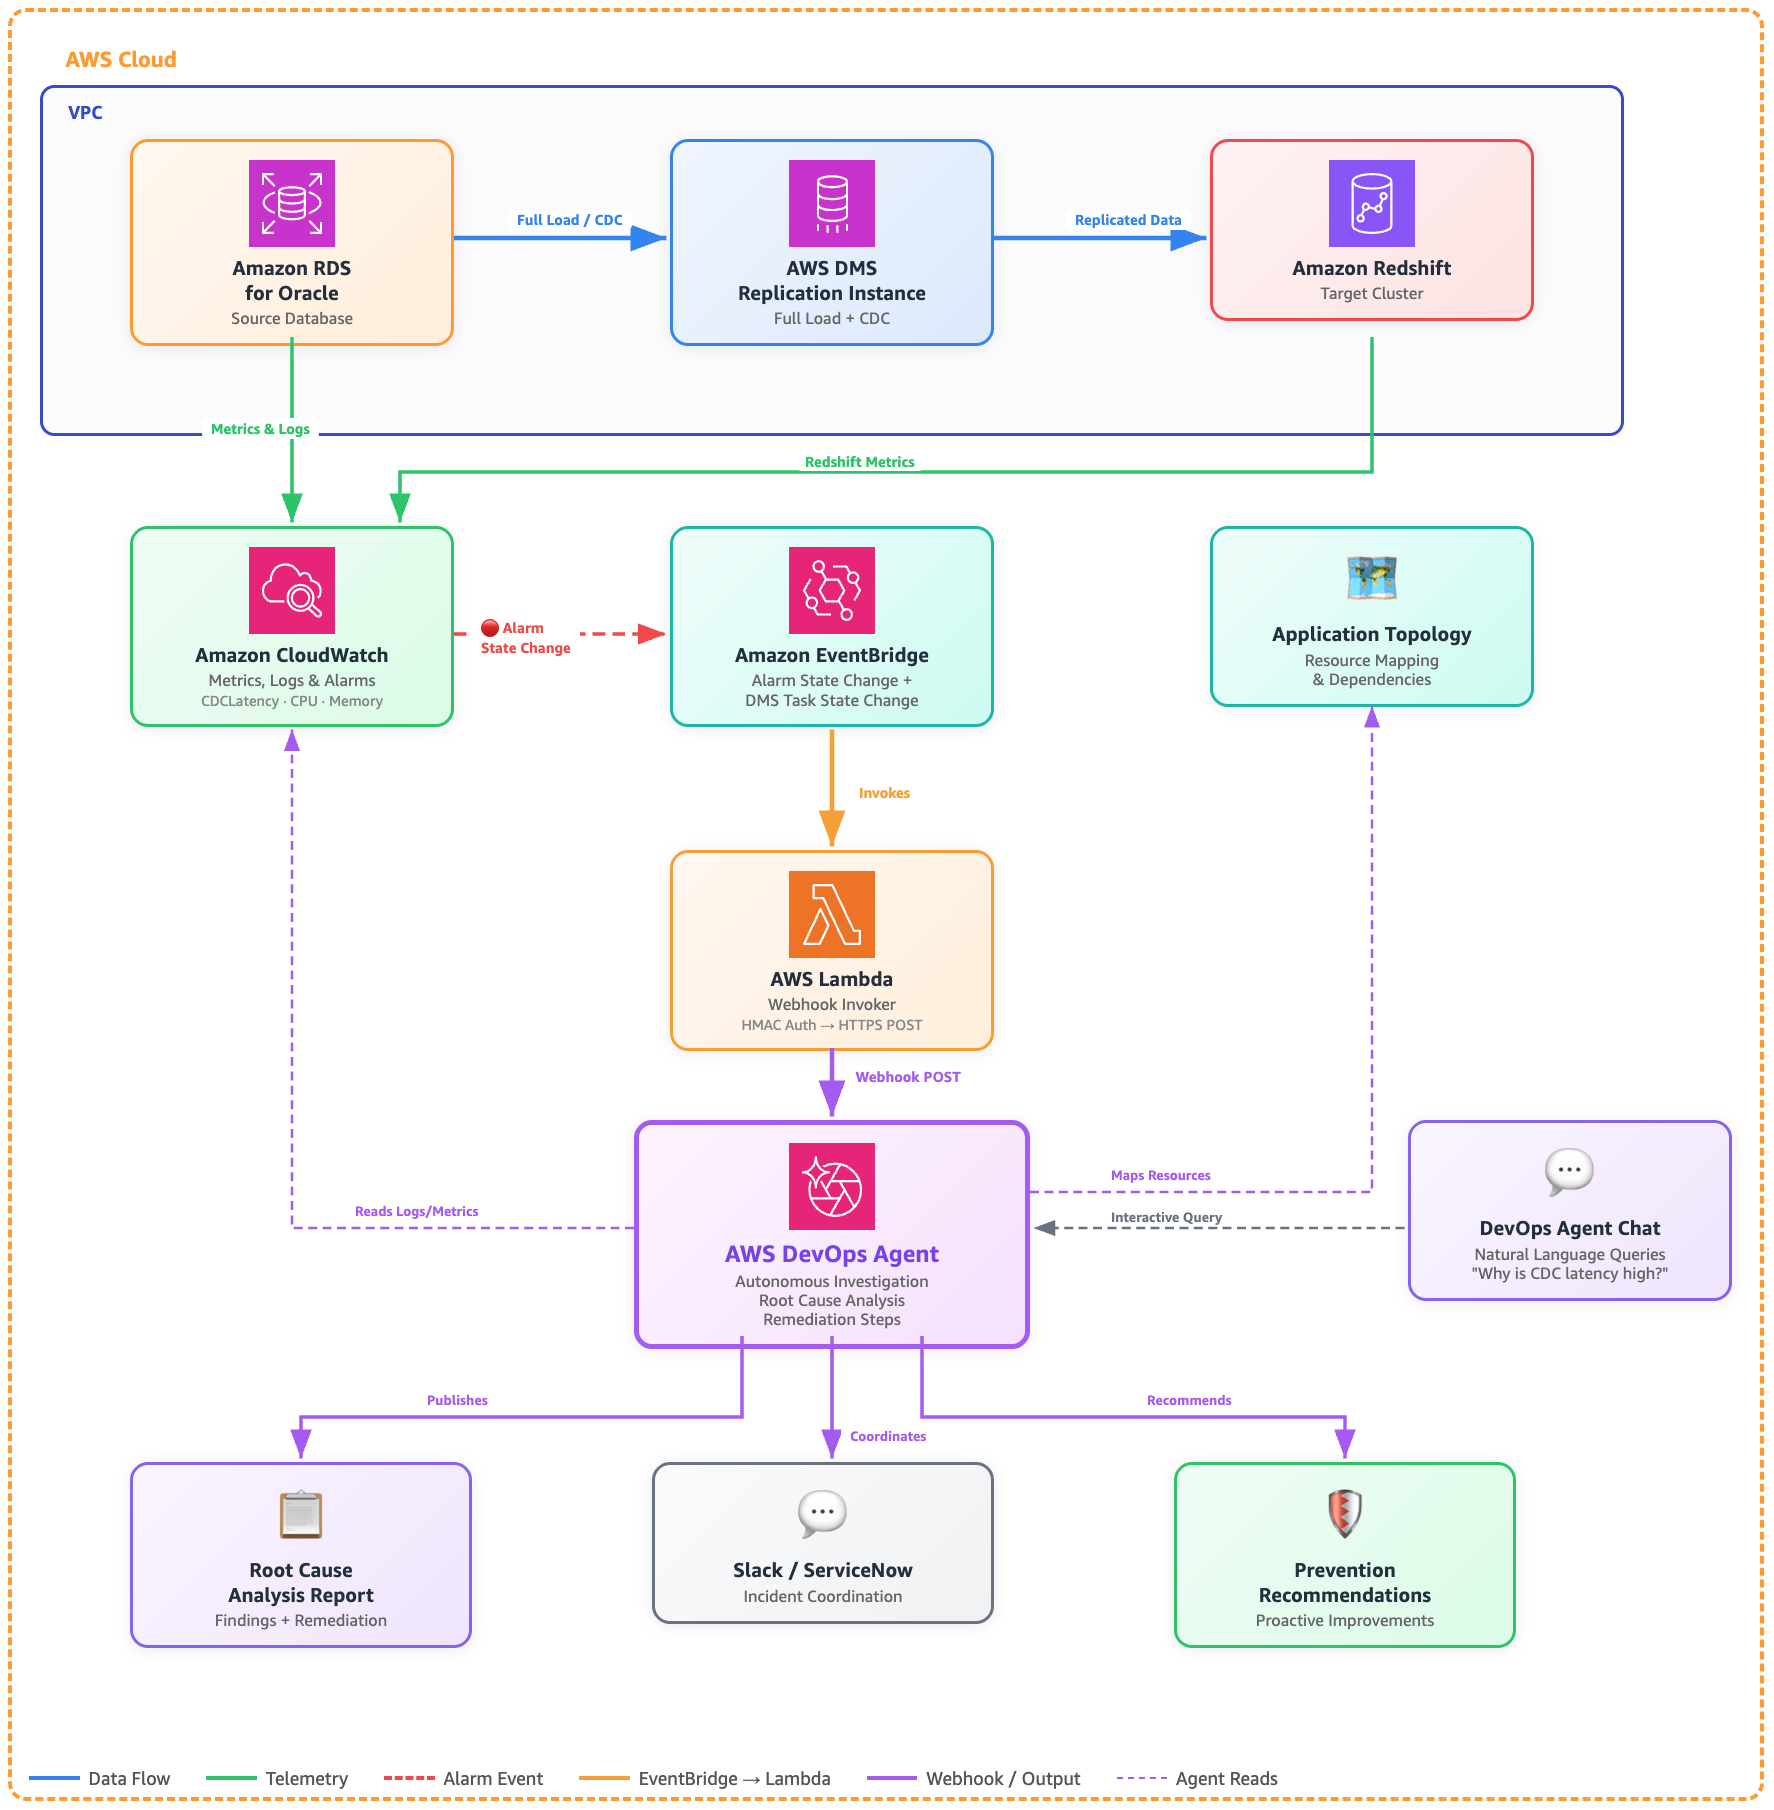
Architecture: Troubleshooting AWS DMS (Oracle to Redshift) with DevOps Agent
Although this post uses an Oracle to Amazon Redshift migration as the example, the same architecture applies to any DMS source and target combination.
Prerequisites
Before you start, you’ll need:
- An AWS DevOps Agent Space configured with access to the AWS accounts containing your DMS resources.
- An AWS DMS replication instance with source RDS for Oracle and target (Amazon Redshift) endpoints configured.
- An active AWS DMS replication task with CloudWatch logging enabled for all log components.
- CloudWatch alarms configured for key DMS metrics (we walk through this in the next section).
- Appropriate IAM permissions for DevOps Agent to access DMS, CloudWatch, and Amazon Redshift resources. Follow the principle of least privilege when granting permissions.
- An AWS Lambda execution role with permissions to read from AWS Secrets Manager and be invoked by Amazon EventBridge.
- (Optional) Slack or ServiceNow integration configured in your DevOps Agent Space for incident coordination.
Configure CloudWatch alarms for DMS
CloudWatch alarms on key DMS metrics provide operational visibility and automatically publish state change events to Amazon EventBridge, which triggers investigations via a Lambda function. In this post, we configure two alarms: CDC source latency and CDC target latency, as shown in the following JSON. You should add additional alarms as needed for your environment.
- CDC source latency alarms –The following alarm monitors CDC source latency, which measures how far behind DMS is in reading changes from the Oracle redo logs.
This alarm fires if DMS falls more than 2 minutes behind Oracle for 2 consecutive 30-second evaluation periods (1 straight minute). When it triggers, EventBridge picks up the state change, invokes the Lambda function, and the DevOps Agent webhook starts an investigation.
- CDC target latency alarm –The following alarm monitors CDC target latency, which measures how far behind DMS is in applying captured changes to Amazon Redshift.
This alarm fires if DMS falls more than 30 seconds behind applying changes to Amazon Redshift for 2 consecutive 10-second evaluation periods (20 straight seconds). When it triggers, EventBridge picks up the state change, invokes the Lambda function, and the DevOps Agent webhook starts an investigation.
Important:Make sure the ReplicationTaskIdentifier references an actively running task. If you stop or decommission a task, disable or delete its alarms to avoid false positives.
Setting up AWS DevOps Agent for DMS monitoring
Follow these steps to configure DevOps Agent for your DMS environment:
Step 1: Create a DevOps Agent Space
- Open the AWS DevOps Agent console.
- Choose Create Agent Space.
- Provide a name (for example,
dms-oracle-redshift-migration) and all other required information, then choose Create. - On the Agent Space details page, add the AWS accounts containing your DMS, Amazon RDS for Oracle, and Amazon Redshift resources.
Step 2: Configure integrations (optional)
- In your Agent Space, navigate to Integrations.
- (Optional) Add Slack or ServiceNow integration for incident coordination.
Step 3: Generate a DevOps Agent webhook
Generate a generic webhook in your Agent Space:
- Select your Agent Space created in step 1.
- Choose the Capabilities tab.
- In the Webhooks section, choose Add webhook, and follow the steps.
- The system generates an HMAC key pair. Securely store the generated WEBHOOK_URL and WEBHOOK_SECRET in. AWS Secrets Manager You won’t be able to retrieve them again. You will need them later in the Lambda function to invoke the DevOps Agent investigation.
Step 4: Create a Lambda function to start investigation
You need to create a Lambda function that receives events from Amazon EventBridge and calls the DevOps Agent webhook to start an investigation. You can use knowledge shared in Invoking DevOps Agent through Webhook webpage and extend it to create a Lambda function.
Step 5: Create EventBridge rules targeting the Lambda function
Create an EventBridge rule that targets the Lambda function. The rule is the primary trigger. It fires whenever any of your DMS CloudWatch alarms enter the `ALARM` state (for example, CDC latency, high CPU, low memory, etc.).
Rule: CloudWatch alarm state changes
This rule fires whenever any alarm with the dms- prefix enters the ALARM state.
Set the target of this rule to the Lambda function created in Step 4. When any DMS related alarm enters the ALARM state, the event flows through EventBridge to Lambda, which calls the DevOps Agent webhook and starts an investigation.
Step 6: Test the investigation flow
You can trigger investigations in three ways:
- Automatic – When a DMS CloudWatch alarm enters the `ALARM` state or a DMS task stops, EventBridge routes the event to the Lambda function, which calls the DevOps Agent webhook to start an investigation. Test this by temporarily lowering an alarm threshold.
- Manual – From the DevOps Agent web app, choose Start Investigation and provide context about the issue (for example, “DMS task dms-oracle-to-redshift stopped unexpectedly during full load”).
- Chat – Use DevOps Agent Chat to ask questions like: “Why is my DMS task dms-oracle-to-redshift showing high CDC latency?”
How AWS DevOps Agent investigates DMS issues
With the alarms, EventBridge rule, and Lambda function in place, investigations start automatically when a DMS alarm enters the ALARM state. The agent then works through the problem the same way an experienced DMS engineer would. Let’s walk through two common scenarios.
Scenario 1: CDC latency growing on Oracle source
To trigger this scenario, we ran a large write workload on the source Oracle RDS instance ‘ora19c’, which breached the dms-cdc-latency-source-breached-alarm, triggering an EventBridge event that invoked the Lambda function and started a DevOps Agent investigation.
What AWS DevOps Agent does:
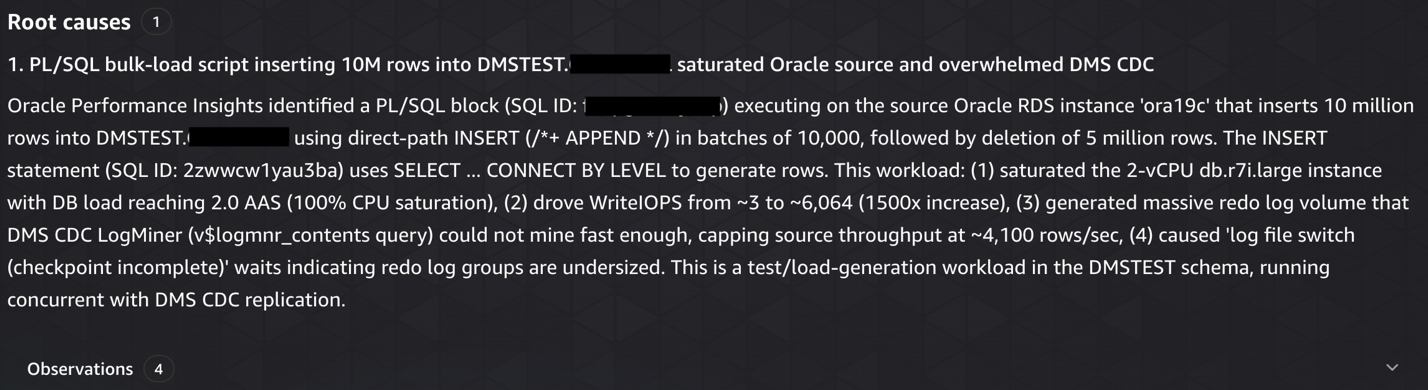
- Detected the latency spike: Identified
CDCLatencySourcebreached 186 seconds (threshold: 120 seconds) on theora-to-redshifttask, with peaks reaching 308 seconds during the incident window. - Traced to Oracle source activity: Analyzed Oracle RDS ora19c metrics and found a PL/SQL bulk-load script (SQL ID: fabpg237tyabp) inserting 10M rows and deleting 5M rows. This caused CPU to spike from 2–4% to 74%,
WriteIOPSto jump from 3–4 to 6,064 (a 1,500x increase) and consumed approximately 15 GB of storage in 30 minutes. - Quantified CDC backlog: Measured 200,032 incoming changes in a single minute (19:57), with CDC throughput capped at ~4,100 rows/sec while LogMiner struggled to keep pace with the redo log volume.
- Ruled out downstream bottlenecks: Confirmed DMS instance (CPU 3.9-4.2%, memory stable) and Amazon Redshift target (
CDCLatencyTargetonly 1-3s behind source) were healthy; the bottleneck was purely source side redo mining. - Identified contributing factors: Found the task was reconfigured at 18:53 to include the high-churn
DMSTEST.CAUDETAILtable with logging disabled, and Oracle showed log file switch (checkpoint incomplete) waits indicating undersized redo log groups.
The following screenshots show the CDC source latency investigation, from detection through root cause analysis to remediation.
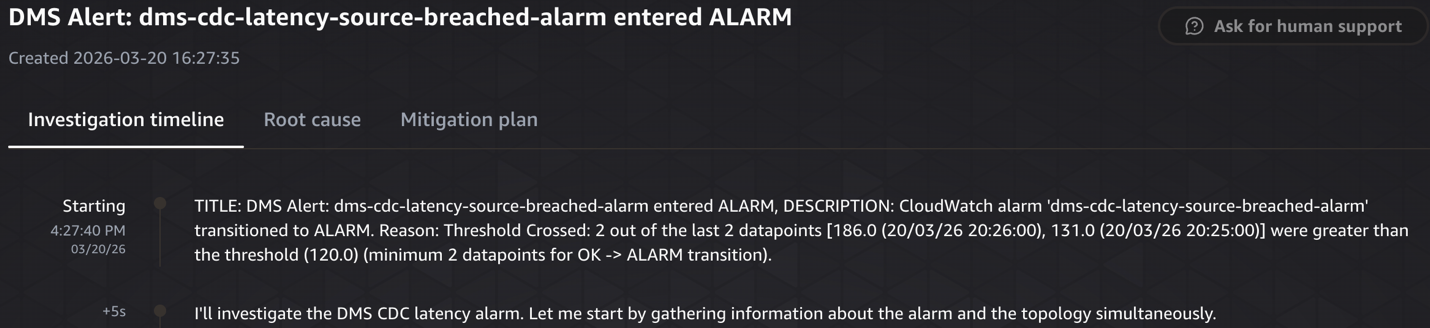
Investigation starting
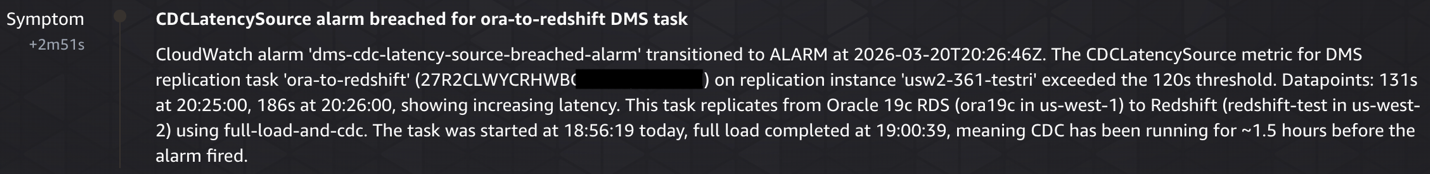
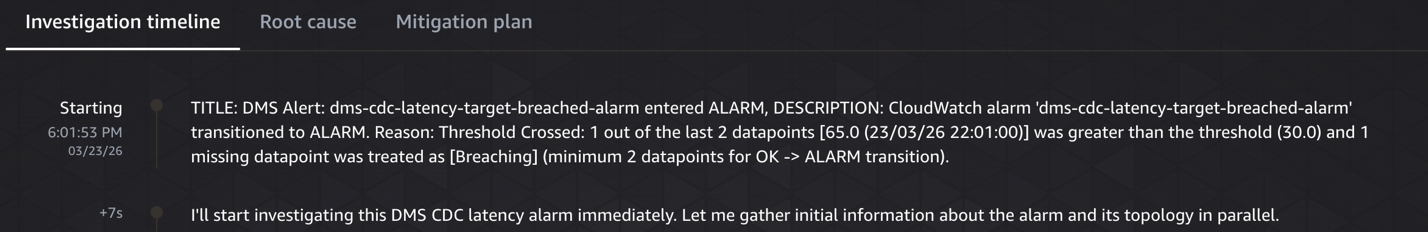
Symptom – CDCLatencySource alarm breached for ora-to-redshift DMS task
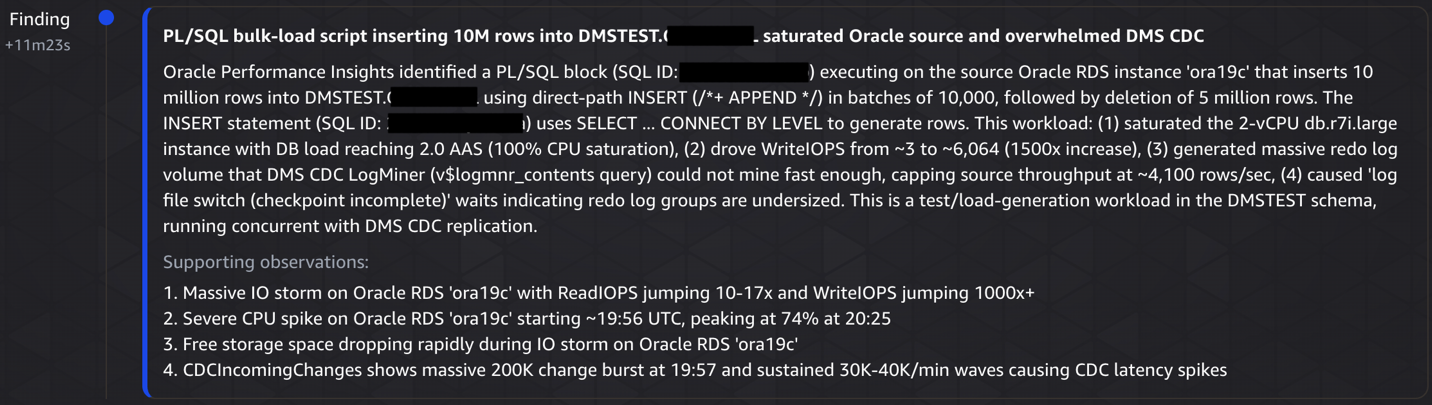
Investigation finding
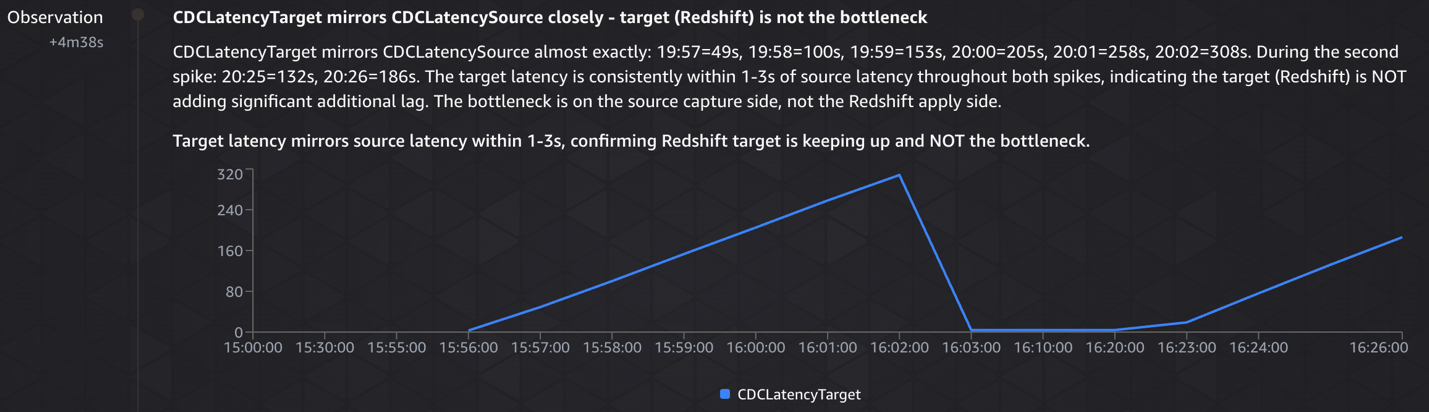
Investigation observation – CDCLatencyTarget mirrors CDCLatencySource closely – target (Redshift) is not the bottleneck
Root cause analysis
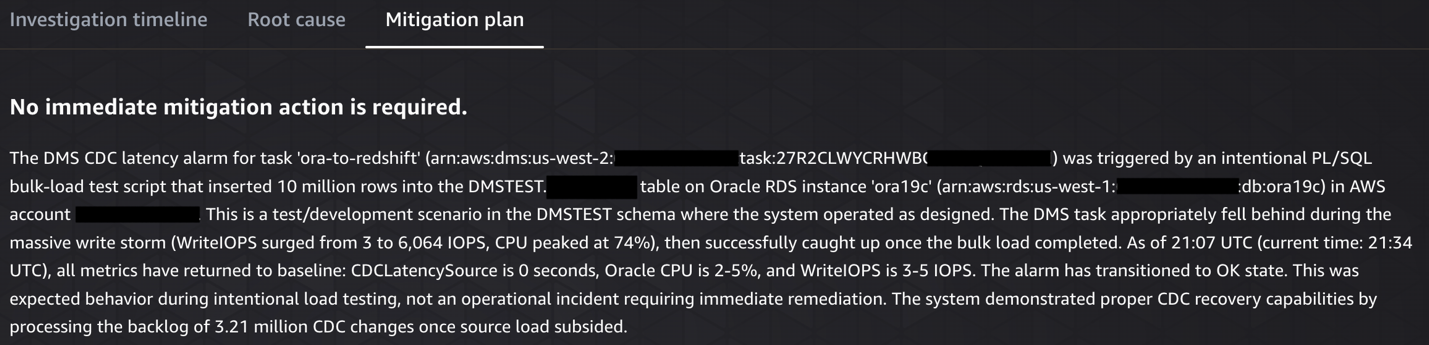
Mitigation plan
Scenario 2: CDC target latency on Amazon Redshift
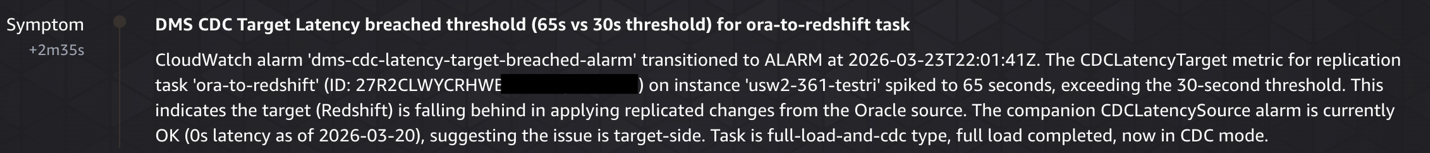
To trigger this scenario, we ran a burst of several hundred writes on the Oracle source, which breached the dms-cdc-latency-target-breached-alarm, triggering an EventBridge event that invoked the Lambda function and started a DevOps Agent investigation. The agent began by gathering alarm details and topology simultaneously, identifying when the latency started increasing and correlating it with other events in the environment, configuration changes, deployments, or workload spikes on the Amazon Redshift target.
What AWS DevOps Agent does:
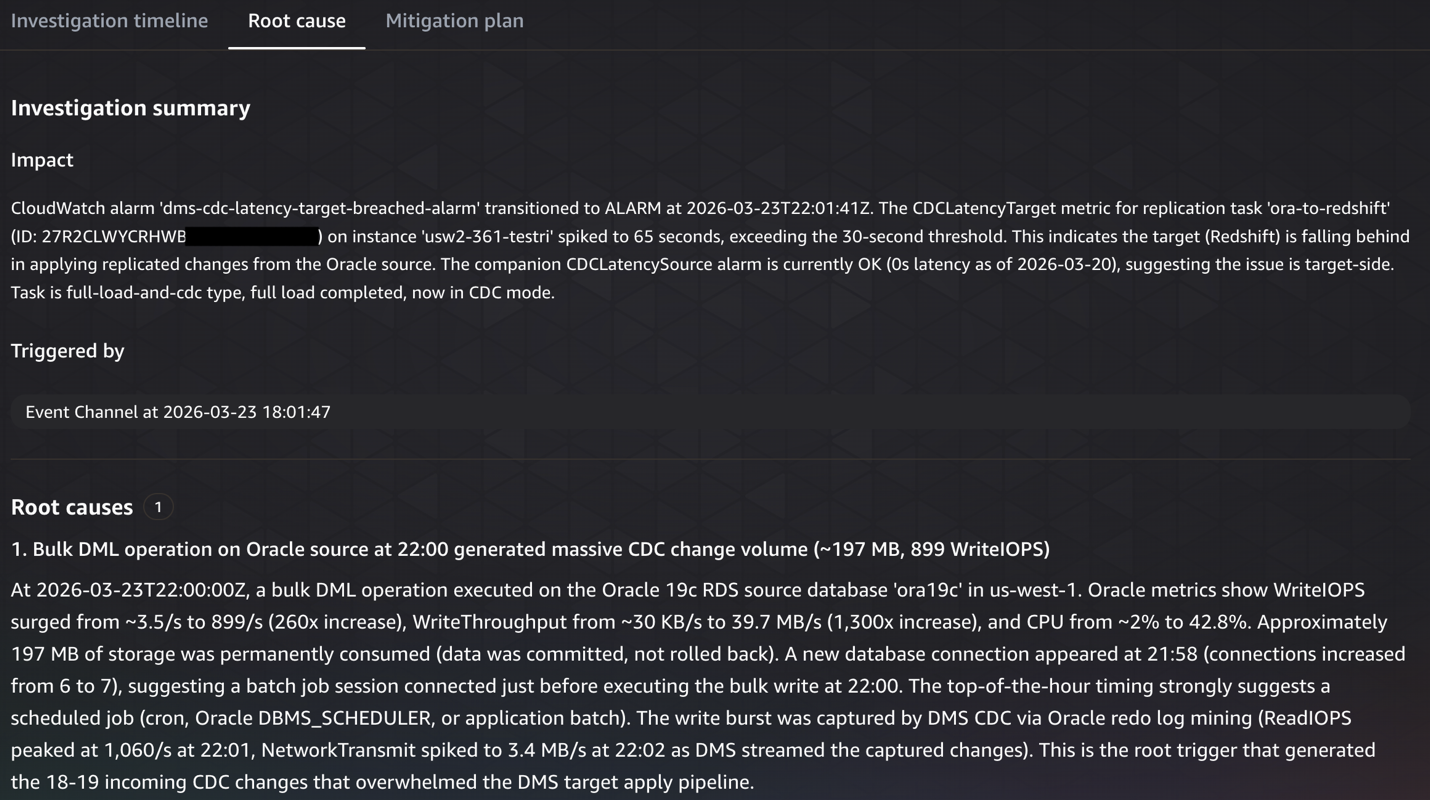
- Identified the trigger:Detected
CDCLatencyTargetspiked to 65 seconds (threshold: 30 seconds) on the ora-to-redshift DMS replication task at 22:01 UTC. - Correlated source activity: Analyzed Oracle RDS metrics and found a massive write burst at exactly 22:00 UTC:
WriteIOPSjumped 260x (3.5 → 899 IOPS),WriteThroughputincreased 1,300x, and a new database connection appeared at 21:58, indicating a scheduled batch job. - Ruled out infrastructure issues:Examined DMS instance resources (CPU <1%, 13.6 GB free memory) and Amazon Redshift cluster health, confirming neither was the bottleneck.
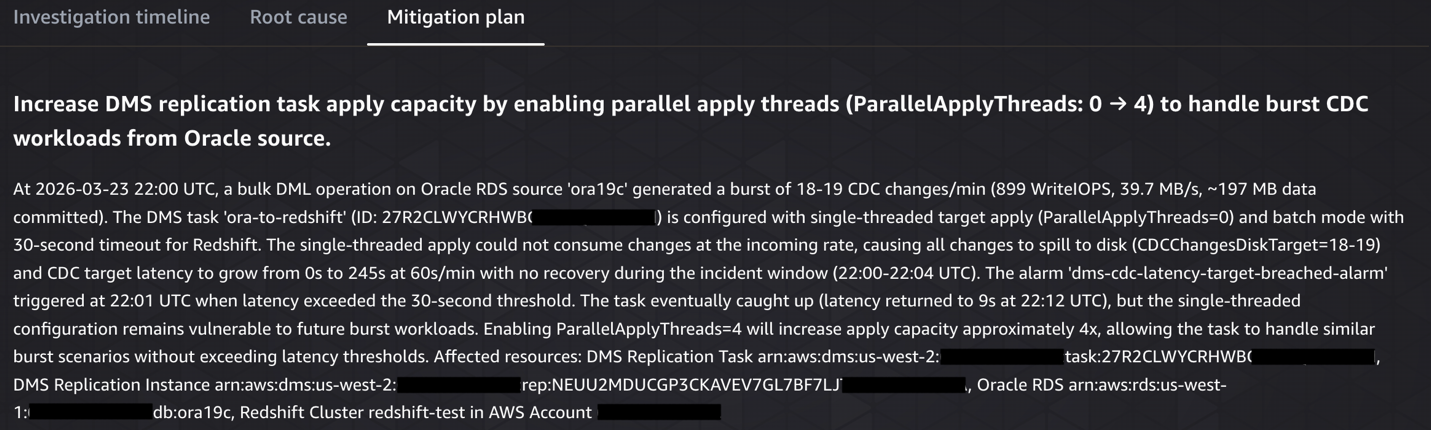
- Pinpointed configuration gap: Discovered
ParallelApplyThreads=0(single-threaded apply) couldn’t keep pace with the incoming CDC changes, causing all 18-19 changes/min to spill to disk. - Documented gaps & recommendations: Noted that DMS task logging was disabled (limiting visibility) and recommended enabling parallel apply threads, turning on logging, and investigating the scheduled batch job causing the burst.
The following screenshots show the CDC target latency investigation, from detection through root cause analysis to remediation.
Investigation starting
Symptom – DMS CDC target latency breached threshold
Root cause analysis
Mitigation plan
Proactive prevention with AWS DevOps Agent
Beyond reactive investigation, DevOps Agent analyzes patterns across your DMS incidents to provide proactive recommendations. For an Oracle to Redshift migration, these might include:
- Observability improvements – Add CloudWatch alarms for CDCIncomingChanges and CDCChangesMemoryTarget metrics to detect CDC pipeline bottlenecks before they cause latency spikes.
- Infrastructure optimization – For example, the replication instance ‘dms-instance-1’ has averaged 78% CPU utilization over the past 7 days. Consider upgrading from ‘dms.r5.xlarge’ to ‘dms.r5.2xlarge’ to provide headroom for peak workloads.
You can view these recommendations in the Prevention tab of the DevOps Agent web app and provide feedback to help the agent refine future suggestions. We recommend validating any recommendations in a test environment before applying them to production tasks.
Technical scope and limitations
Before implementing this solution, consider the following:
- DevOps Agent is currently available in 6 AWS regions. Check the DevOps Agent documentation for the latest regional availability.
- Verify CloudWatch log retention for DMS task logs is set to at least 7 days. If logs expire before an investigation, the agent may have gaps in its analysis.
Cost considerations
With AWS DevOps Agent, you pay only for the time the agent spends on operational tasks, billed per second. Check the DevOps Agent pricing page for more details. The supporting services (CloudWatch alarms, EventBridge rules, Lambda invocations) incur standard AWS charges. Remember to delete unused resources after implementing this architecture to avoid unnecessary costs.
Summary
In this post, we showed how DevOps Agent accelerates the initial investigation of AWS DMS migration issues from RDS Oracle to Amazon Redshift. By building an application topology and correlating telemetry across Oracle, AWS DMS, and Amazon Redshift, the agent identifies root causes related to infrastructure, configuration, and workload patterns, and provides actionable remediation steps. Note that the agent works with AWS service telemetry and does not have visibility into application-level code or business logic. Deeper application-specific troubleshooting may still require manual investigation.
To get started, create a DevOps Agent Space and connect it to your DMS environment using the steps in this post. After the basic setup is working, you can extend it further. Consider extending your EventBridge rules to cover additional DMS tasks, integrating with your existing incident management workflows through Slack or ServiceNow, and broadening alarm coverage with metrics like CDCIncomingChanges and FreeStorageSpace.
For more information, see the DevOps Agent documentation, the AWS DMS user guide, and the Amazon Redshift documentation. Share your feedback and questions in the comments. While this post focuses on Oracle to Amazon Redshift, you can apply the same approach to other DMS source and target combinations.