Artificial Intelligence
Optimizing production agents with Amazon Bedrock AgentCore Observability
As your AI agents move from prototype to production, the challenges shift from getting them to work to keeping them fast and efficient. In Part 1 of this series, we walked through debugging two common agent failures: infinite loops and tool invocation errors. Those scenarios dealt with agents that were broken. In this post, we tackle a different challenge: agents that work correctly but perform poorly. Slow response times and unbounded memory growth are the most common operational issues that surface after you resolve the initial debugging problems. They don’t trigger error alerts, but they erode user trust and increase costs over time.
Using AgentCore Observability, a capability of Amazon Bedrock AgentCore, and Amazon CloudWatch, you will learn how to identify performance bottlenecks across your agent’s execution path and diagnose memory issues in long-running sessions. You will also implement monitoring practices that catch degradation before users notice it. For additional information and best practices, review AgentCore Evaluations, a capability of Amazon Bedrock AgentCore, and AgentCore Insights.
Prerequisites
You need an AWS account with Amazon Bedrock AgentCore access, CloudWatch Transaction Search enabled, and a deployed agent. See Part 1 for full setup details.
Scenario 3: Performance bottlenecks
Agents experience performance bottlenecks when they work correctly but respond too slowly. You expect sub-second responses but experience multi-second delays. Agents complete tasks successfully, but the latency makes them impractical for interactive use cases. This scenario is particularly challenging because slow is subjective. What’s acceptable for a batch processing agent is unacceptable for a customer service chatbot. You must establish performance budgets for your specific use case, then systematically identify which components violate those budgets.
Symptoms to watch for
Performance degradation often manifests gradually. Agents might start with acceptable 2-second response times, but as you add features, integrate more tools, or accumulate more memory, latency creeps to 5 seconds, then 10, then becomes unusable. P95 response times exceed your thresholds, users abandon sessions, but error rates stay low. The agent works correctly but responds too slowly.
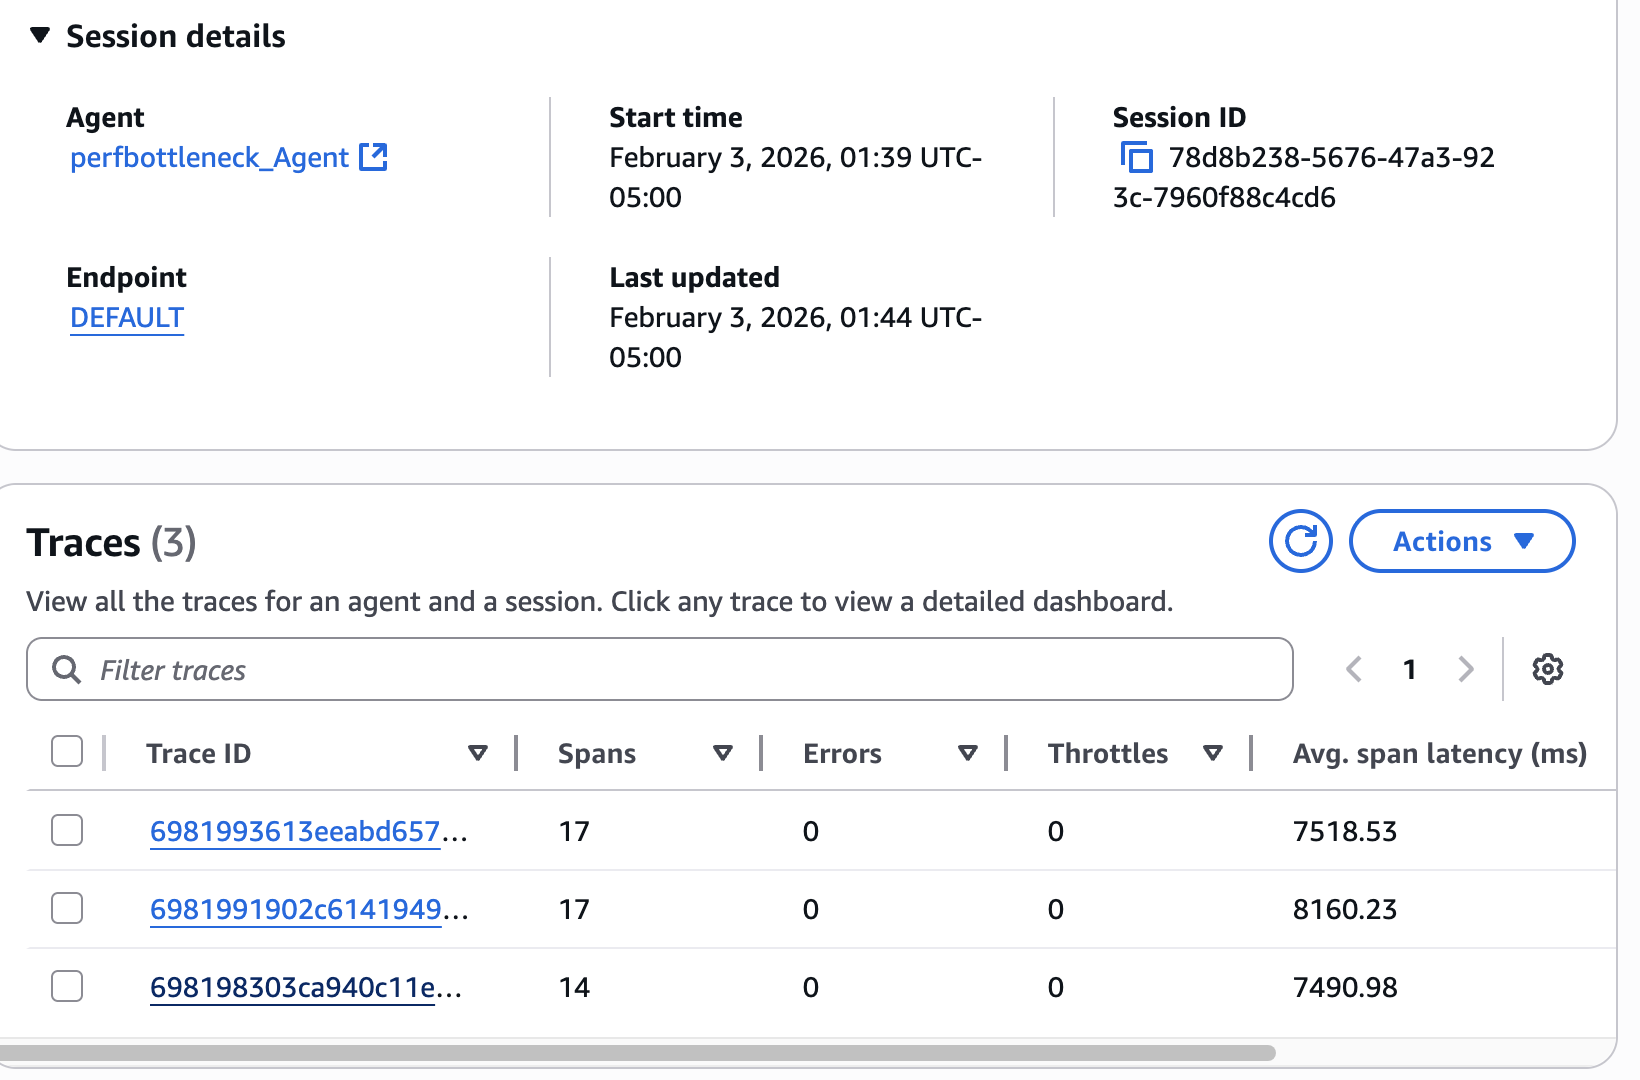
Figure 1 — Session details showing multiple traces with consistently high latency. The three invocations took 7.5-8.2 seconds (average span latency), demonstrating a systemic performance bottleneck rather than occasional slowness. This pattern indicates the agent’s architecture needs optimization.
To find bottlenecks, start by identifying high-latency requests. Query CloudWatch for agent invocations that exceed your performance budget:
This query returns agent invocations that took longer than 3 seconds (adjust the threshold based on your requirements), sorted by latency. Pick a representative high-latency request and note its RequestId.
Next, analyze the request timeline to understand where time is spent:
The query shows you the sequence of operations within the request and how long each took. Look for operations that consume disproportionate time. Common culprits include memory retrieval operations, tool invocations, token generation, and sequential operations that could run in parallel.
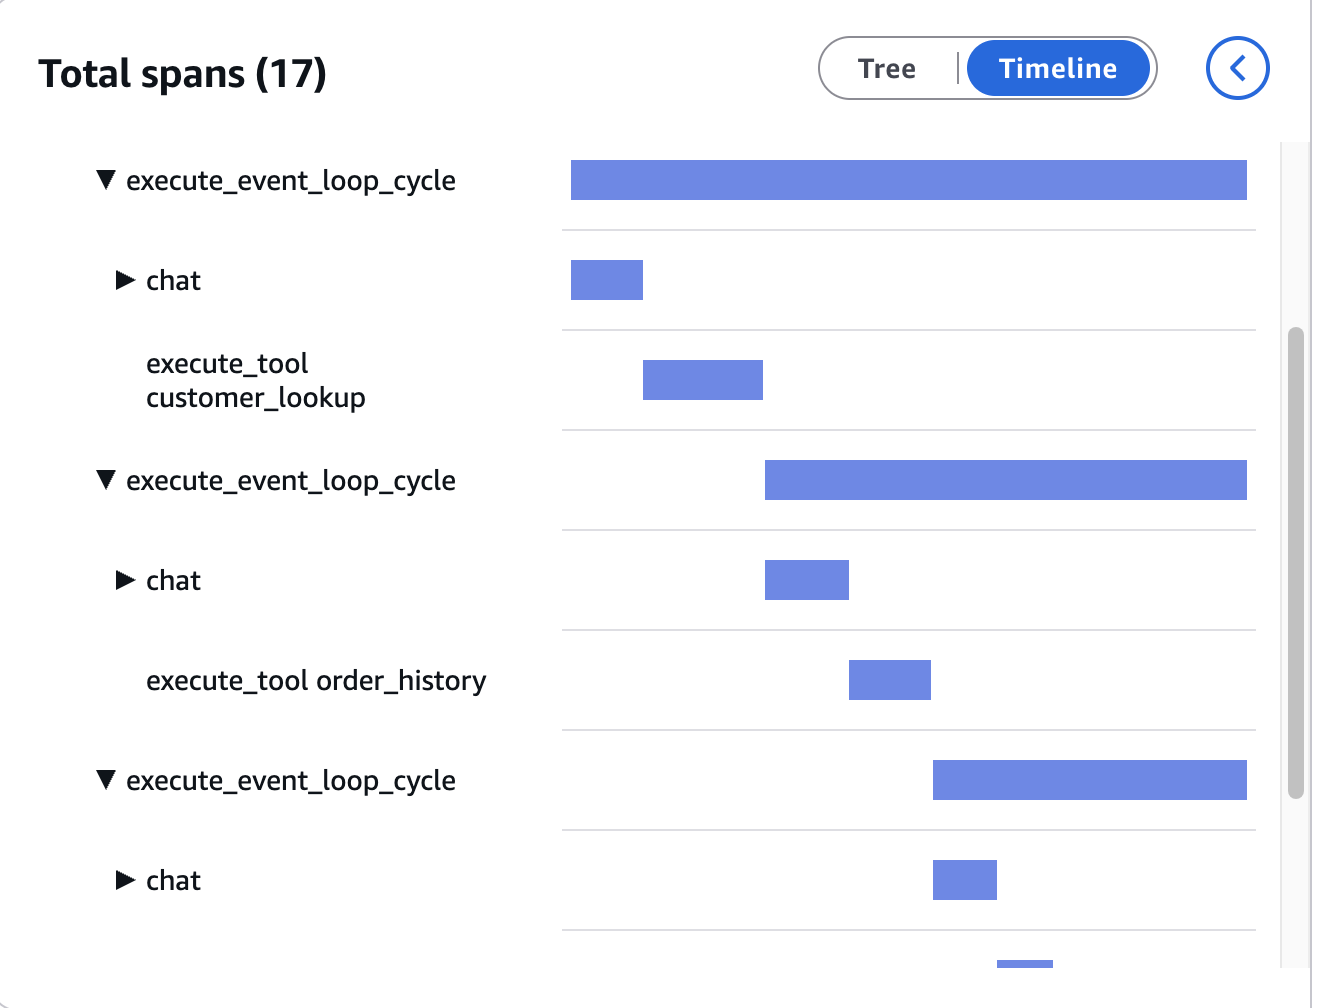
Figure 2 — OpenTelemetry trace timeline showing 17 spans across three sequential execute_event_loop_cycle operations. The tools (customer_lookup, order_history) execute one after another rather than in parallel, with each cycle waiting for the previous one to complete. This sequential pattern compounds latency across each tool invocation.
Check memory retrieval latency specifically:
Memory retrieval should complete in under 200 milliseconds, representing the point where users begin perceiving noticeable delays in interactive applications. Higher latency suggests inefficient memory organization.
Examine tool invocation latency to identify slow integrations:
The query identifies which tools contribute most to overall latency. A single slow tool can bottleneck the entire agent workflow.
Root cause analysis
Performance bottlenecks typically stem from three root causes. Slow tool execution occurs when external tools take seconds to respond because of poor optimization, overload, or network issues. Latencies compound with sequential calls, so a 2-second tool called three times becomes a 6-second bottleneck. Excessive token generation is a factor because foundation models (FMs) produce tokens sequentially, meaning a 500-token response takes 5x longer than a 100-token one, impacting both latency and cost. Finally, sequential processing, performing independent operations one at a time instead of in parallel, increases both cost and compute times.
The fix
For slow tool execution, implement caching, connection pooling, and proper database indexing to reduce response times. Set timeout limits and consider faster tool alternatives. If a tool consistently lags, profile it independently. The issue might be network latency, cold starts, or resource contention rather than the tool’s logic itself.
For memory retrieval, replace single large namespaces with topic-specific partitions, such as preferences, history, and domain knowledge, to reduce search space. Summarize old conversations into compact entries rather than storing them verbatim, and set size limits per namespace, such as 100 preferences, 50 recent messages, or 500 domain facts.
For token generation, optimize prompts to encourage brief, direct answers of 2–3 sentences unless more detail is requested. Add explicit length constraints and monitor token usage with alerts for unexpectedly long responses.
For sequential processing, run independent tool calls in parallel. Sequential calls totaling 4.5s (2s + 1.5s + 1s) drop to only 2s when parallelized, often cutting latency by 50 percent or more with minimal effort. To verify your optimizations, re-run the latency query from the identifying bottlenecks section. Confirm that P95 response times now fall within your performance budget and that the trace timeline shows parallel execution where expected.
Scenario 4: Memory issues in long-running sessions
Agents experience memory issues in long-running sessions when they maintain sessions where memory usage grows unbounded. Agents accumulate context, and eventually, agents hit token limits, lose important context, or exhaust available memory. Sessions fail unexpectedly, and you lose conversation state. This scenario is particularly problematic for agents that support extended workflows, such as customer service sessions, research assistants, or monitoring agents. Without proper memory management, these use cases become impractical.
Symptoms to watch for
When abnormally long agent sessions exist, token usage grows linearly with session duration. Memory retrieval latency increases over time as memory stores grow. Sessions terminate unexpectedly with out-of-memory errors or context window exceeded errors.
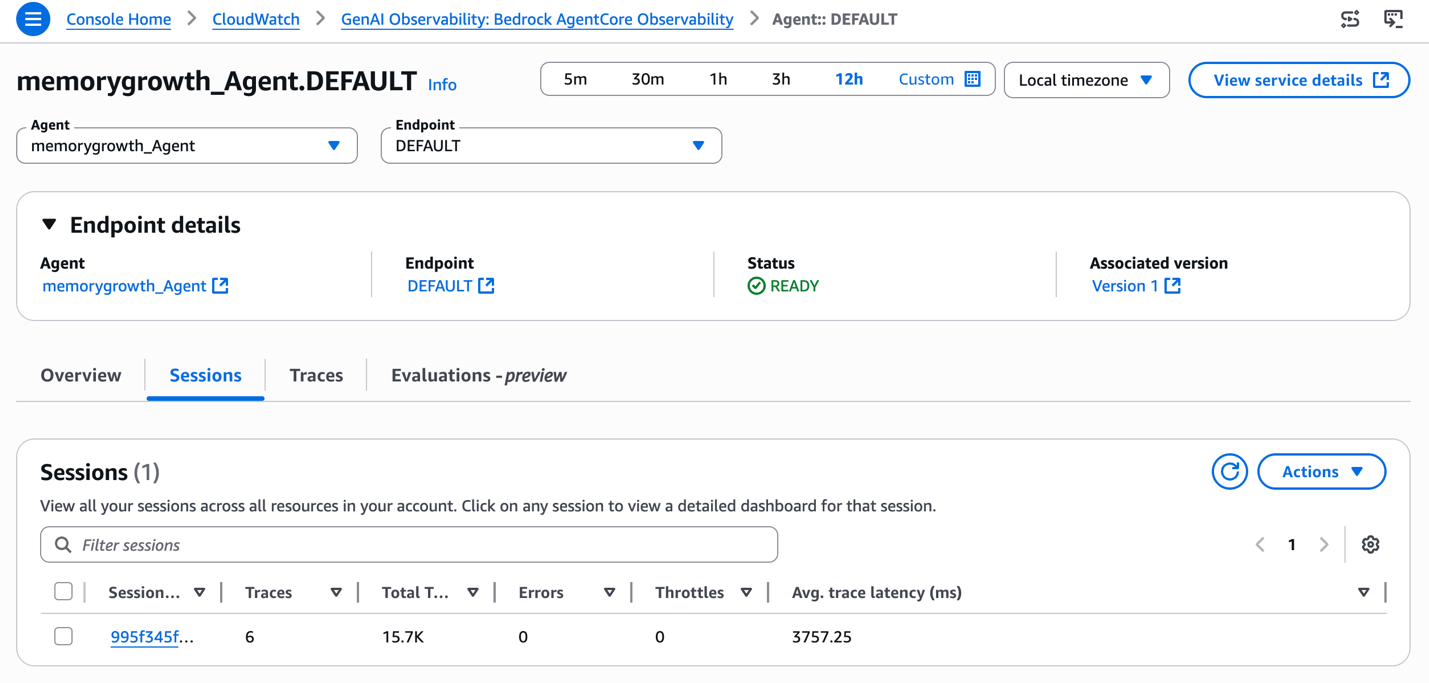
Figure 3 — Session details for the memorygrowth_Agent showing 6 traces, 15.7K total tokens consumed, and an average trace latency of 3,757 ms within a single session. Token usage grows with each successive invocation, demonstrating unbounded context accumulation. In production sessions spanning hours, this pattern leads to context window exhaustion and unexpected session failures.
To identify long-running sessions with high memory usage:
The query returns sessions lasting longer than one hour (3600 seconds), sorted by memory size. Pick a session with unusually high memory usage and note its SessionId.
Examine memory extraction patterns to verify consolidation is occurring:
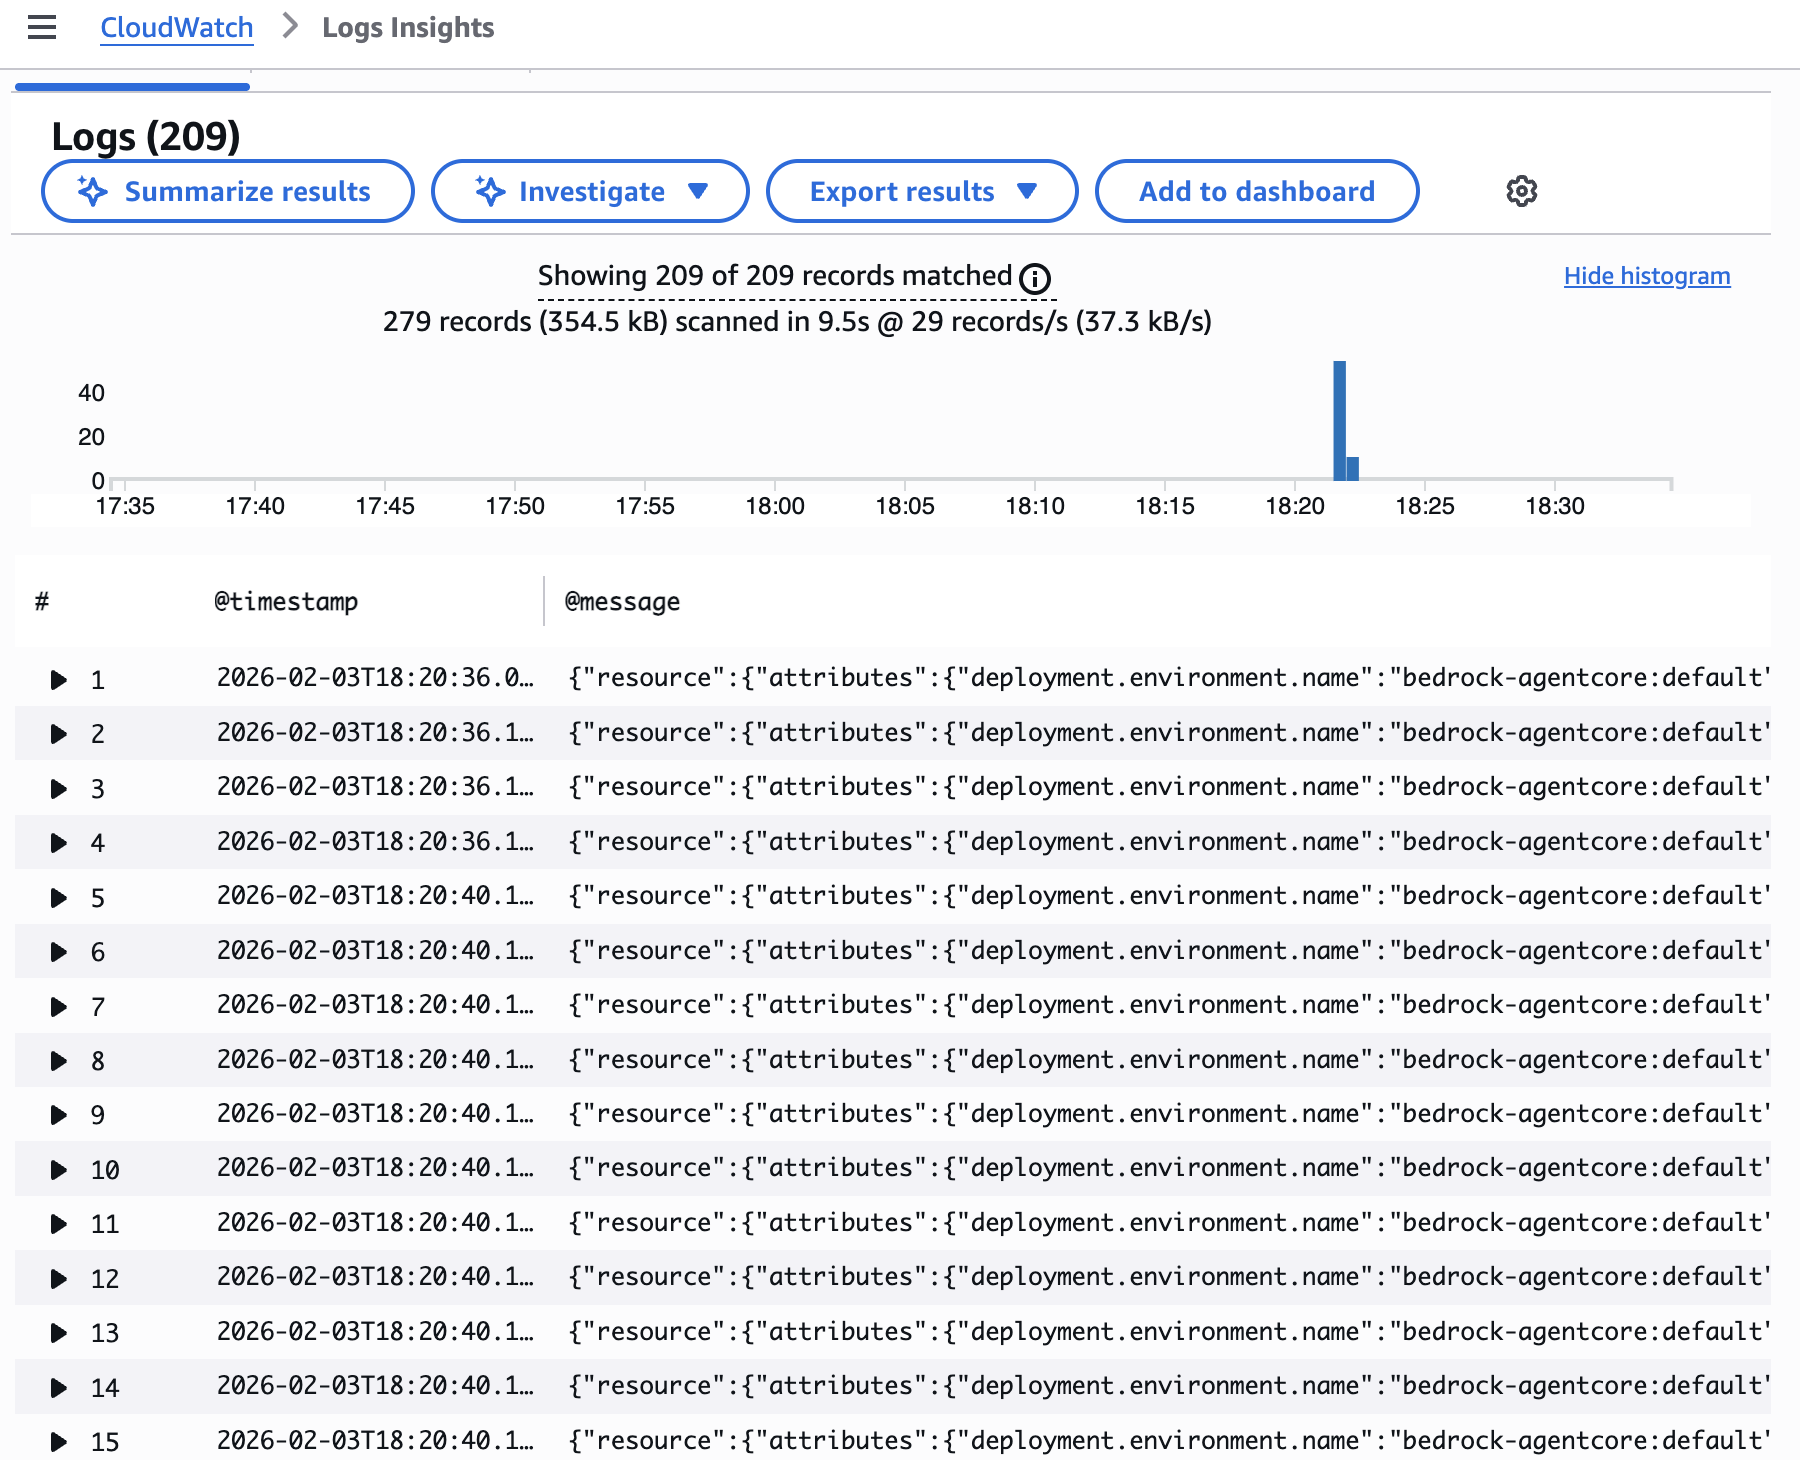
Figure 4 — CloudWatch Logs Insights showing 209 memory-related log entries concentrated around 18:20. The spike in memory operations indicates the agent storing information without consolidation. Each invocation adds new memory entries (through add_conversation_note and add_user_context tools) without pruning or summarizing old data, demonstrating the unbounded growth pattern.
Memory extraction should occur regularly throughout the session. If you see gaps where no extraction happens for extended periods, the agent isn’t consolidating memories properly.
Check for memory extraction failures:
Failed memory extraction stops agents from consolidating context, causing unbounded growth. Common failure reasons include token limits exceeded during summarization, invalid memory formats that can’t be processed, network timeouts when writing to memory storage, and permission errors that block memory updates.
Analyze memory namespace organization:
Memories are distributed across namespaces. Poor namespace organization can lead to inefficient memory retrieval and consolidation. If you see a single namespace containing thousands of memories, that’s a red flag indicating your agent needs better memory organization.
Root cause analysis
Memory issues typically stem from misconfigured settings, filter on inbuilt datetime metadata of the record. For a deeper understanding of how AgentCore memory works, see AgentCore memory.
The fix
To resolve memory issues, verify your memory strategies include a consolidation configuration so AgentCore memory merges and summarizes records over time rather than accumulating them indefinitely. Organize records using namespace templates in your strategy definitions to make sure retrieval stays scoped to relevant context. Set eventExpiryDuration to control how long raw events persist (between 7–365 days). For implementation details, see AgentCore memory implementation.
Production best practices
Having covered the four failure scenarios across both parts, we now turn to production best practices that stop these issues before they occur. The troubleshooting workflows we’ve covered help you respond when things go wrong, but a well-architected observability strategy helps you proactively catch issues. The integration of AgentCore with CloudWatch provides the foundation for this proactive approach, giving you real-time visibility into agent health and performance.
Turn on comprehensive instrumentation for production agents, memory systems, and gateways. Configure CloudWatch logs, CloudWatch metrics, and OpenTelemetry traces.
Configure CloudWatch alarms for critical metrics. Set thresholds for error rates (5 percent), 95th percentile (P95) latency (3 seconds), and token usage per session. Don’t wait for users to report problems. Let CloudWatch alert you when metrics exceed acceptable thresholds.
Create operational dashboards. Build a primary dashboard showing total invocations (last 24 hours), error rate (current compared to baseline), P50/P95/P99 latency, token usage trends, and active sessions count. Create per-agent dashboards showing agent-specific invocation patterns, tool usage breakdown, memory consumption trends, error types distribution, and cost per session. Review these dashboards daily to spot trends before they become problems.
Invest in observability infrastructure before you need it. Build monitoring into your development process from day one. Share dashboards with product managers and stakeholders so everyone understands agent performance. When someone diagnoses a tricky production issue, share the approach with the team to build institutional knowledge about common failure patterns.
To monitor tool accuracy at scale, you can use Amazon Bedrock AgentCore Evaluators to continuously and automatically assess agent behavior. Instead of manually reviewing traces after failures occur, Evaluators inspect agent sessions in real time, scoring them against predefined quality criteria. Amazon Bedrock AgentCore Insights (preview) builds off Evaluators and provides triage analysis. Insights can provide failure analysis, user intent extraction, and execution summary.
Cleaning up
After testing the optimization techniques in this post, clean up resources to avoid unnecessary charges.
For CloudWatch resources, delete test CloudWatch dashboards created during debugging, remove CloudWatch alarms set up for testing purposes, and consider archiving or deleting old CloudWatch log groups if no longer needed.
For AgentCore resources, if you created test agents specifically for this tutorial, delete them through the AgentCore console. Remove any test memory namespaces created during memory optimization testing. Delete any temporary tool integrations used for performance testing.
For cost optimization, review your Amazon CloudWatch Logs retention settings and adjust based on your compliance requirements. Consider using CloudWatch Logs data protection to cut storage costs for older logs.
To delete CloudWatch log groups:
To remove CloudWatch alarms:
Conclusion
Performance bottlenecks and memory issues represent the most common operational challenges for production agents beyond the debugging scenarios covered in Part 1. With systematic diagnosis using CloudWatch traces and metrics, you can identify whether latency stems from slow tools, inefficient memory retrieval, excessive token generation, or sequential processing. For long-running sessions, monitoring memory growth patterns and implementing consolidation strategies keeps agents stable over extended interactions.
Next steps
Ready to put these techniques into practice? Start by turning on AgentCore Observability for your production agents if you haven’t already. This one-time setup provides the foundation for everything we’ve covered. Set up CloudWatch alarms for critical metrics. Create troubleshooting runbooks for your specific agents and workflows, documenting the queries you run, the thresholds that indicate problems, and the fixes you implement.
Practice debugging in non-production environments. Deliberately introduce failures and practice diagnosing them using the workflows we’ve covered. Build muscle memory for troubleshooting before you need it in production. Share this knowledge with your team to help confirm everyone who operates your agents understands these debugging techniques and knows how to use the observability features of AgentCore.
Production agents often fail for preventable reasons. With the right observability tools, systematic troubleshooting approaches, and a culture that treats every issue as a chance to improve, you can catch problems early, resolve them quickly, and build agents that earn lasting trust.
Learn more
For more information about AgentCore and observability features, visit the AgentCore documentation. To get started with AgentCore, visit the AgentCore console. For additional CloudWatch monitoring best practices, see the CloudWatch User Guide.