Artificial Intelligence
Simplify dashboard drill-down with the Amazon Quick Sight hierarchy filter
Amazon Quick Sight is a fully managed, cloud-native business intelligence (BI) capability for building and publishing interactive dashboards. You can access these dashboards from any device and embed them into your applications, portals, and websites. When building a dashboard, authors add filters so readers can narrow the data to what they want to analyze. But authors must strike a balance: they need enough options for readers to explore data freely, without cluttering the interface or requiring too many steps to apply filters.
The following screenshot shows a common dashboard filter layout. There are six filters in total: four geographical filters (Region, Sub-Region, Country, and City) and two more that cover the Segment and Product dimensions. In many real-world dashboards, readers encounter even more filters, which can significantly affect the overall user experience.
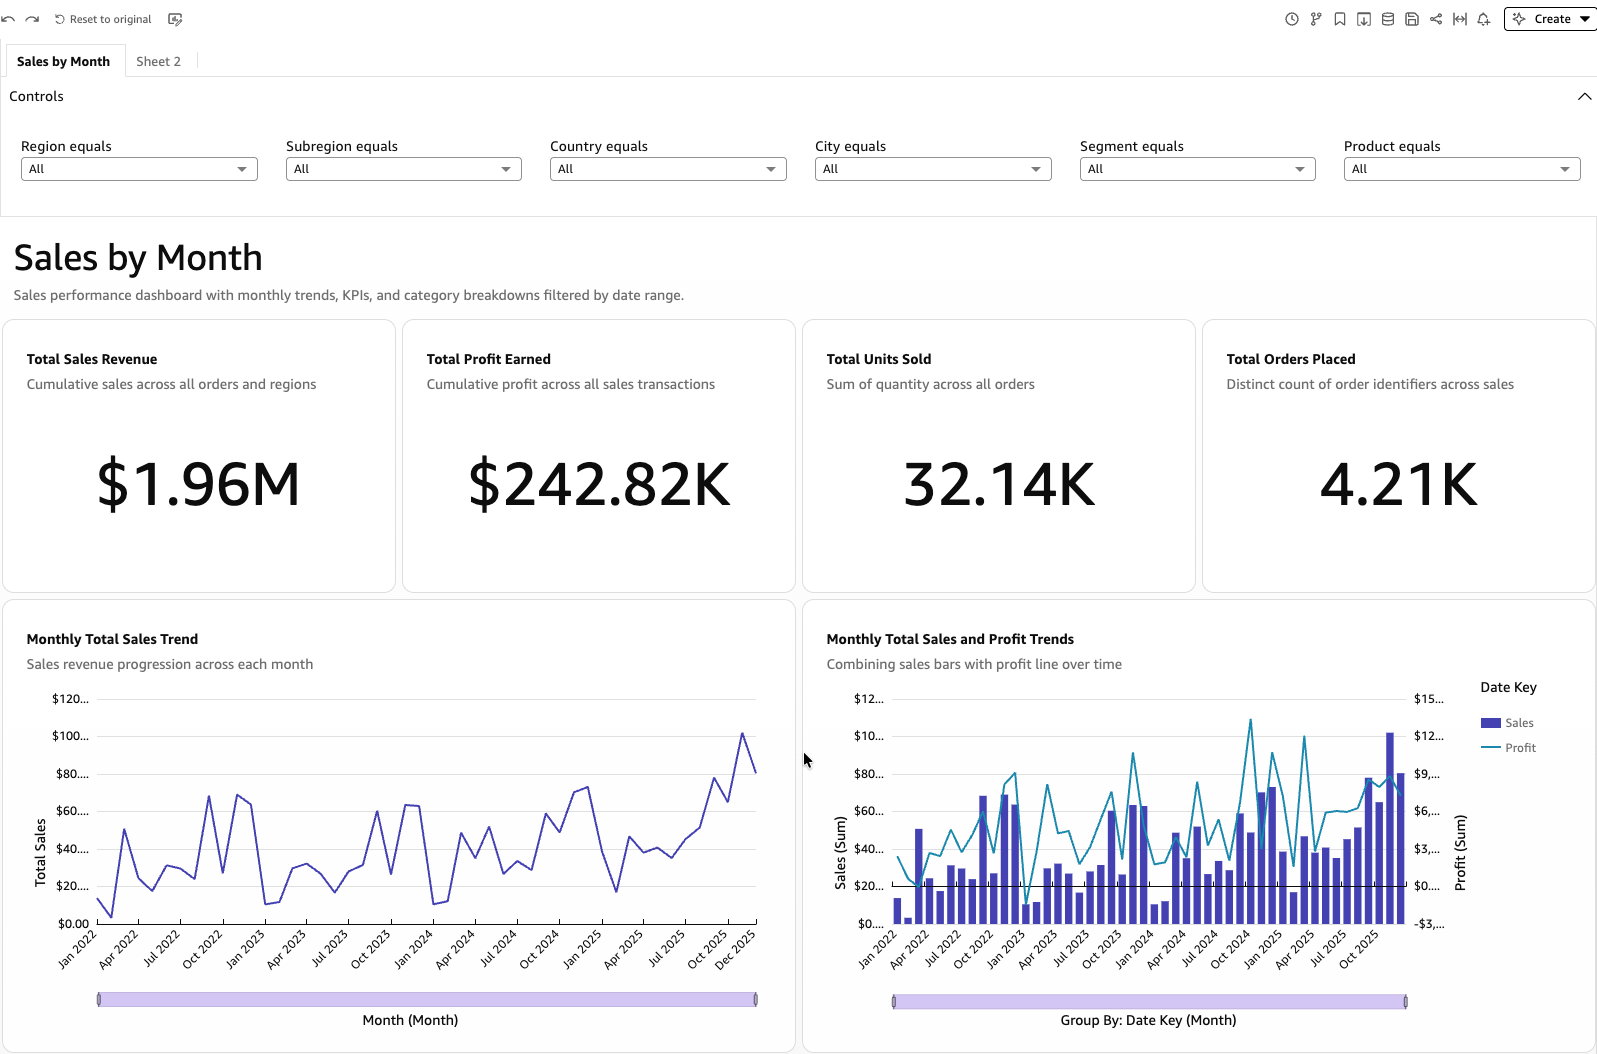
Figure 1: A common dashboard layout with six separate filter controls
Introducing the hierarchy filter
Today, we’re announcing the hierarchy filter in Quick Sight. With it, authors can offer rich, multi-level filtering in a single compact control, reducing clutter and guiding readers to the data they need in fewer steps.
The hierarchy filter offers the following benefits:
- Reduces visual clutter: Instead of showing hundreds of cities upfront, readers see a short list of Regions first. The interface stays clean at every step, with fewer options visible at once.
- Fewer steps and more guided exploration: Readers drill down a logical path (Region → Sub-Region → Country → City) rather than scanning a flat list of dozens of filters. Each selection narrows the next, so readers reach their target faster.
- Mix-and-match hierarchy selection: Readers can combine levels of the hierarchy in one filter control, selecting an entire country such as Japan alongside a single city such as New York.
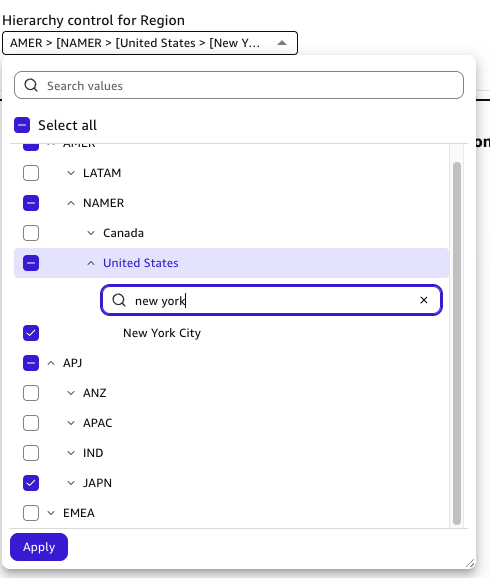
Figure 2: Selecting an entire country and a single city in the same hierarchy control
- Scales without overwhelming: You can support deep hierarchies (up to five levels) without adding five independent filter controls that crowd the toolbar. One compact control handles the full drill path.
- Prevents reader confusion: Readers don’t need to know which country belongs to which Region. The hierarchy encodes that knowledge for them, making the dashboard self-guiding.
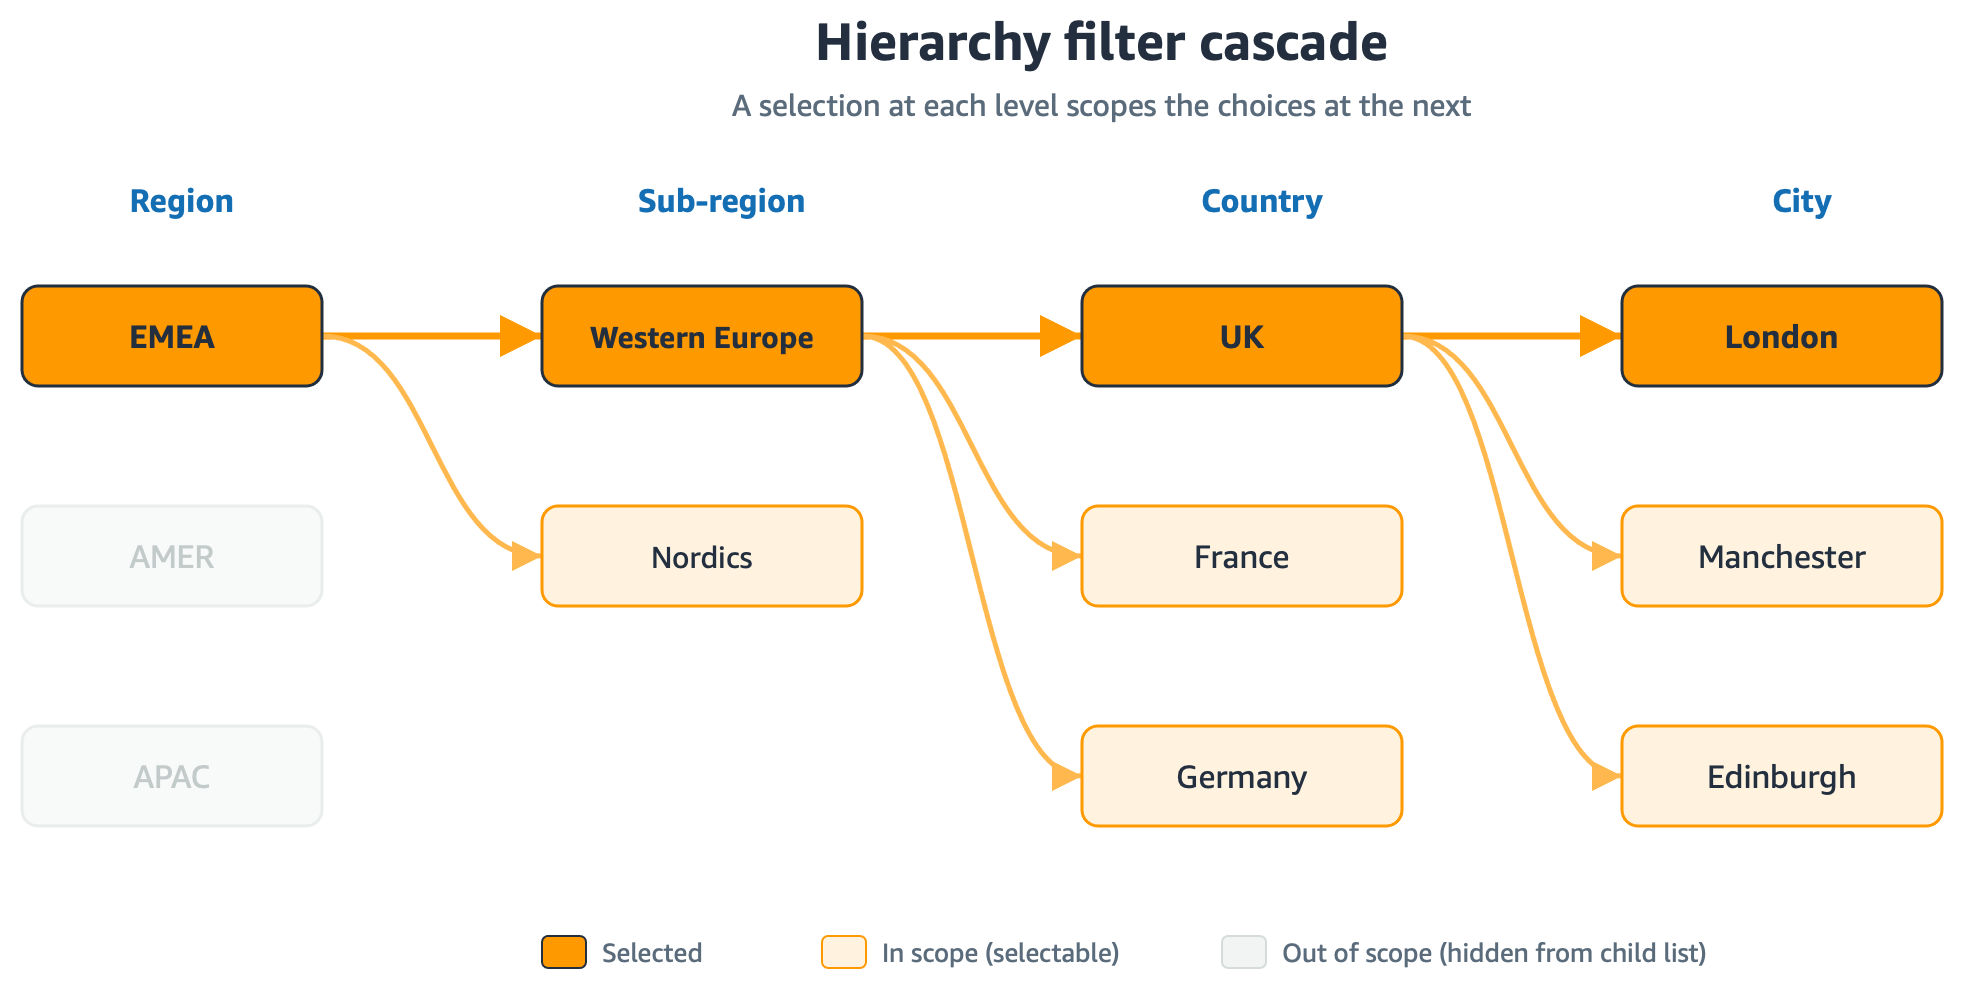
Figure 3: A selection at each level scopes the choices available at the next
In this post, we explain how the hierarchy filter works and when to reach for it instead of standard independent filters, walk through configuring one, and build a worked example on a sample retail sales dataset that shows the end-to-end author and reader experience.
Overview of the sample dataset
For this walkthrough we use a retail sales dataset with a three-level geographic hierarchy plus a couple of metrics. Each row includes one transaction order with the following columns:
| Column | Example | Role |
| Order_ID | 1001 | Row ID |
| Order_Date | 2026-01-12 | Date dimension (for trend visuals) |
| Region | EMEA | Hierarchy level 1 (parent) |
| Country | UK | Hierarchy level 2 |
| City | London | Hierarchy level 3 (child) |
| Product_Category | Electronics | Independent dimension (breakdown) |
| Sales | 4200 | Metric |
| Quantity | 14 | Metric |
The dataset covers three Regions (EMEA, AMER, APAC), eight countries, and fourteen cities, so the cascade has enough depth to be meaningful. A sample of the raw data:
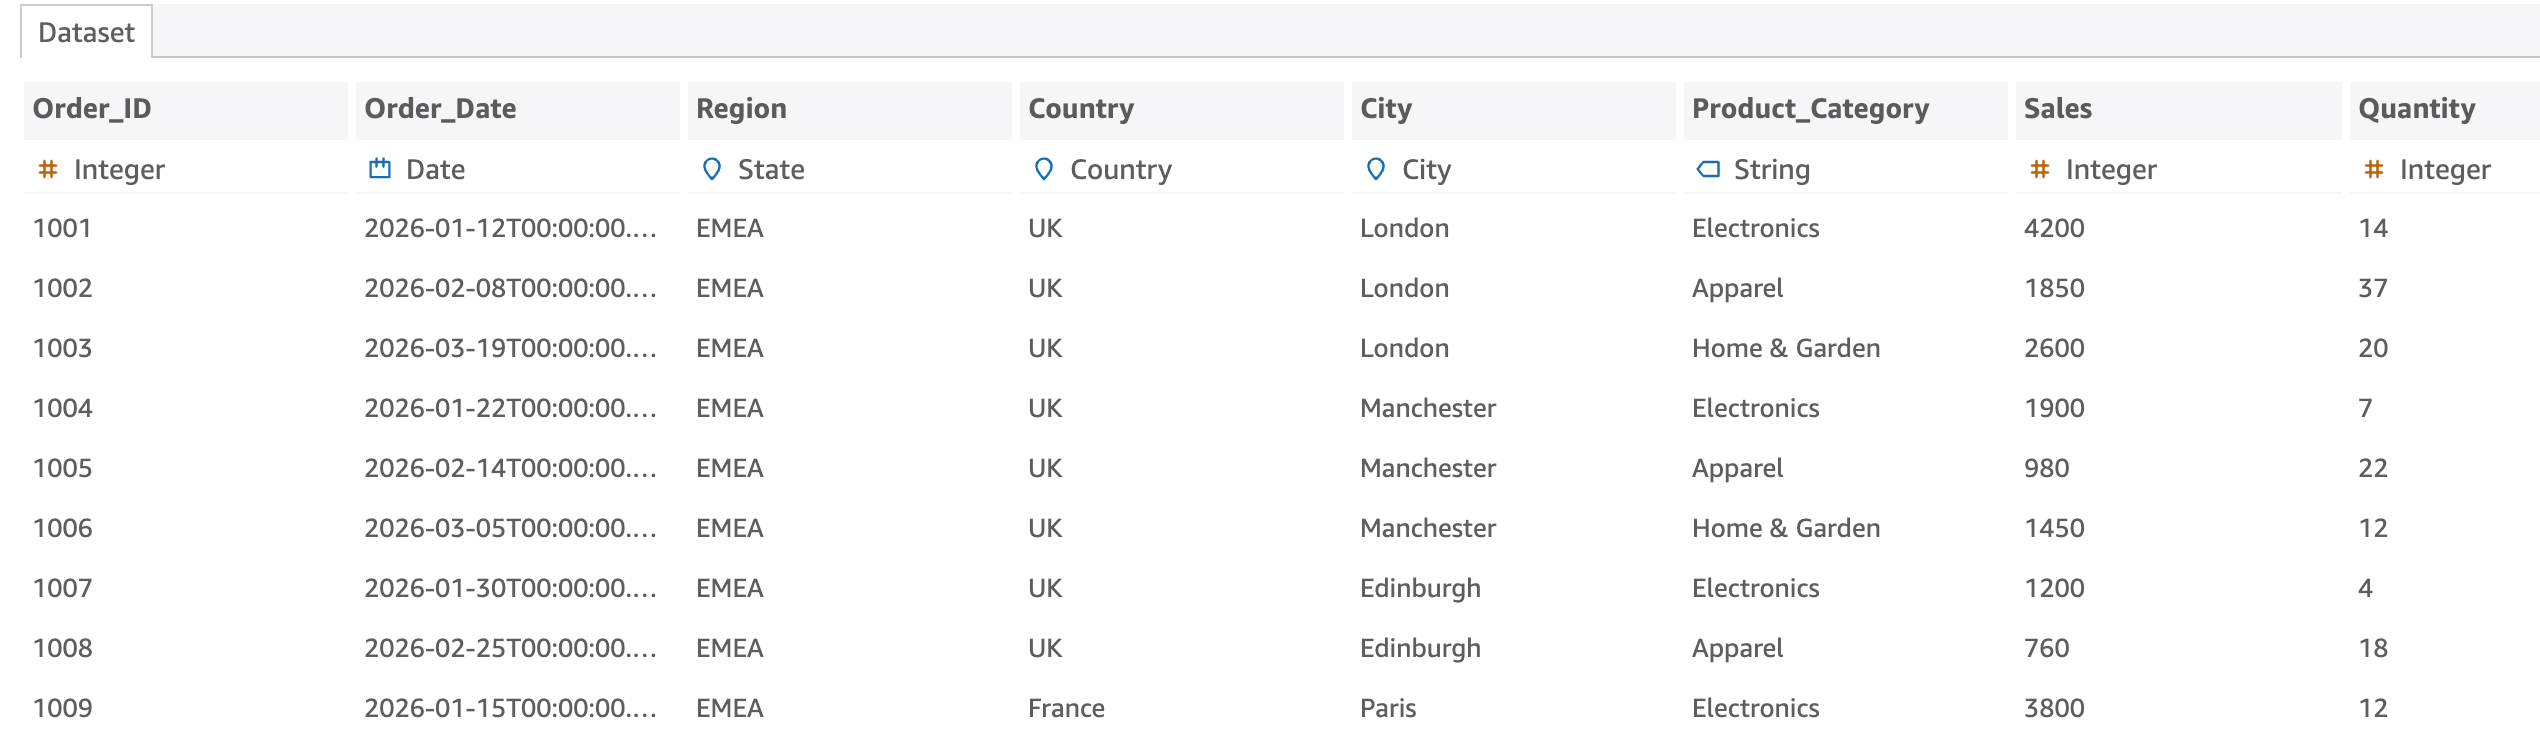
Figure 4: A sample of the retail sales dataset
Building the dashboard
We will build a single-sheet dashboard so the reader can see the whole cascade at a glance. It contains:
- A key performance indicator (KPI) showing Total Sales, Total Units, and Order Count (each with a month-over-month comparison), to prove the whole sheet reacts to the cascade.
- A filled map of Sales by Country, shaded by revenue.
- A treemap of Sales by Region → Country → City, whose nested rectangles visually echo the filter hierarchy.
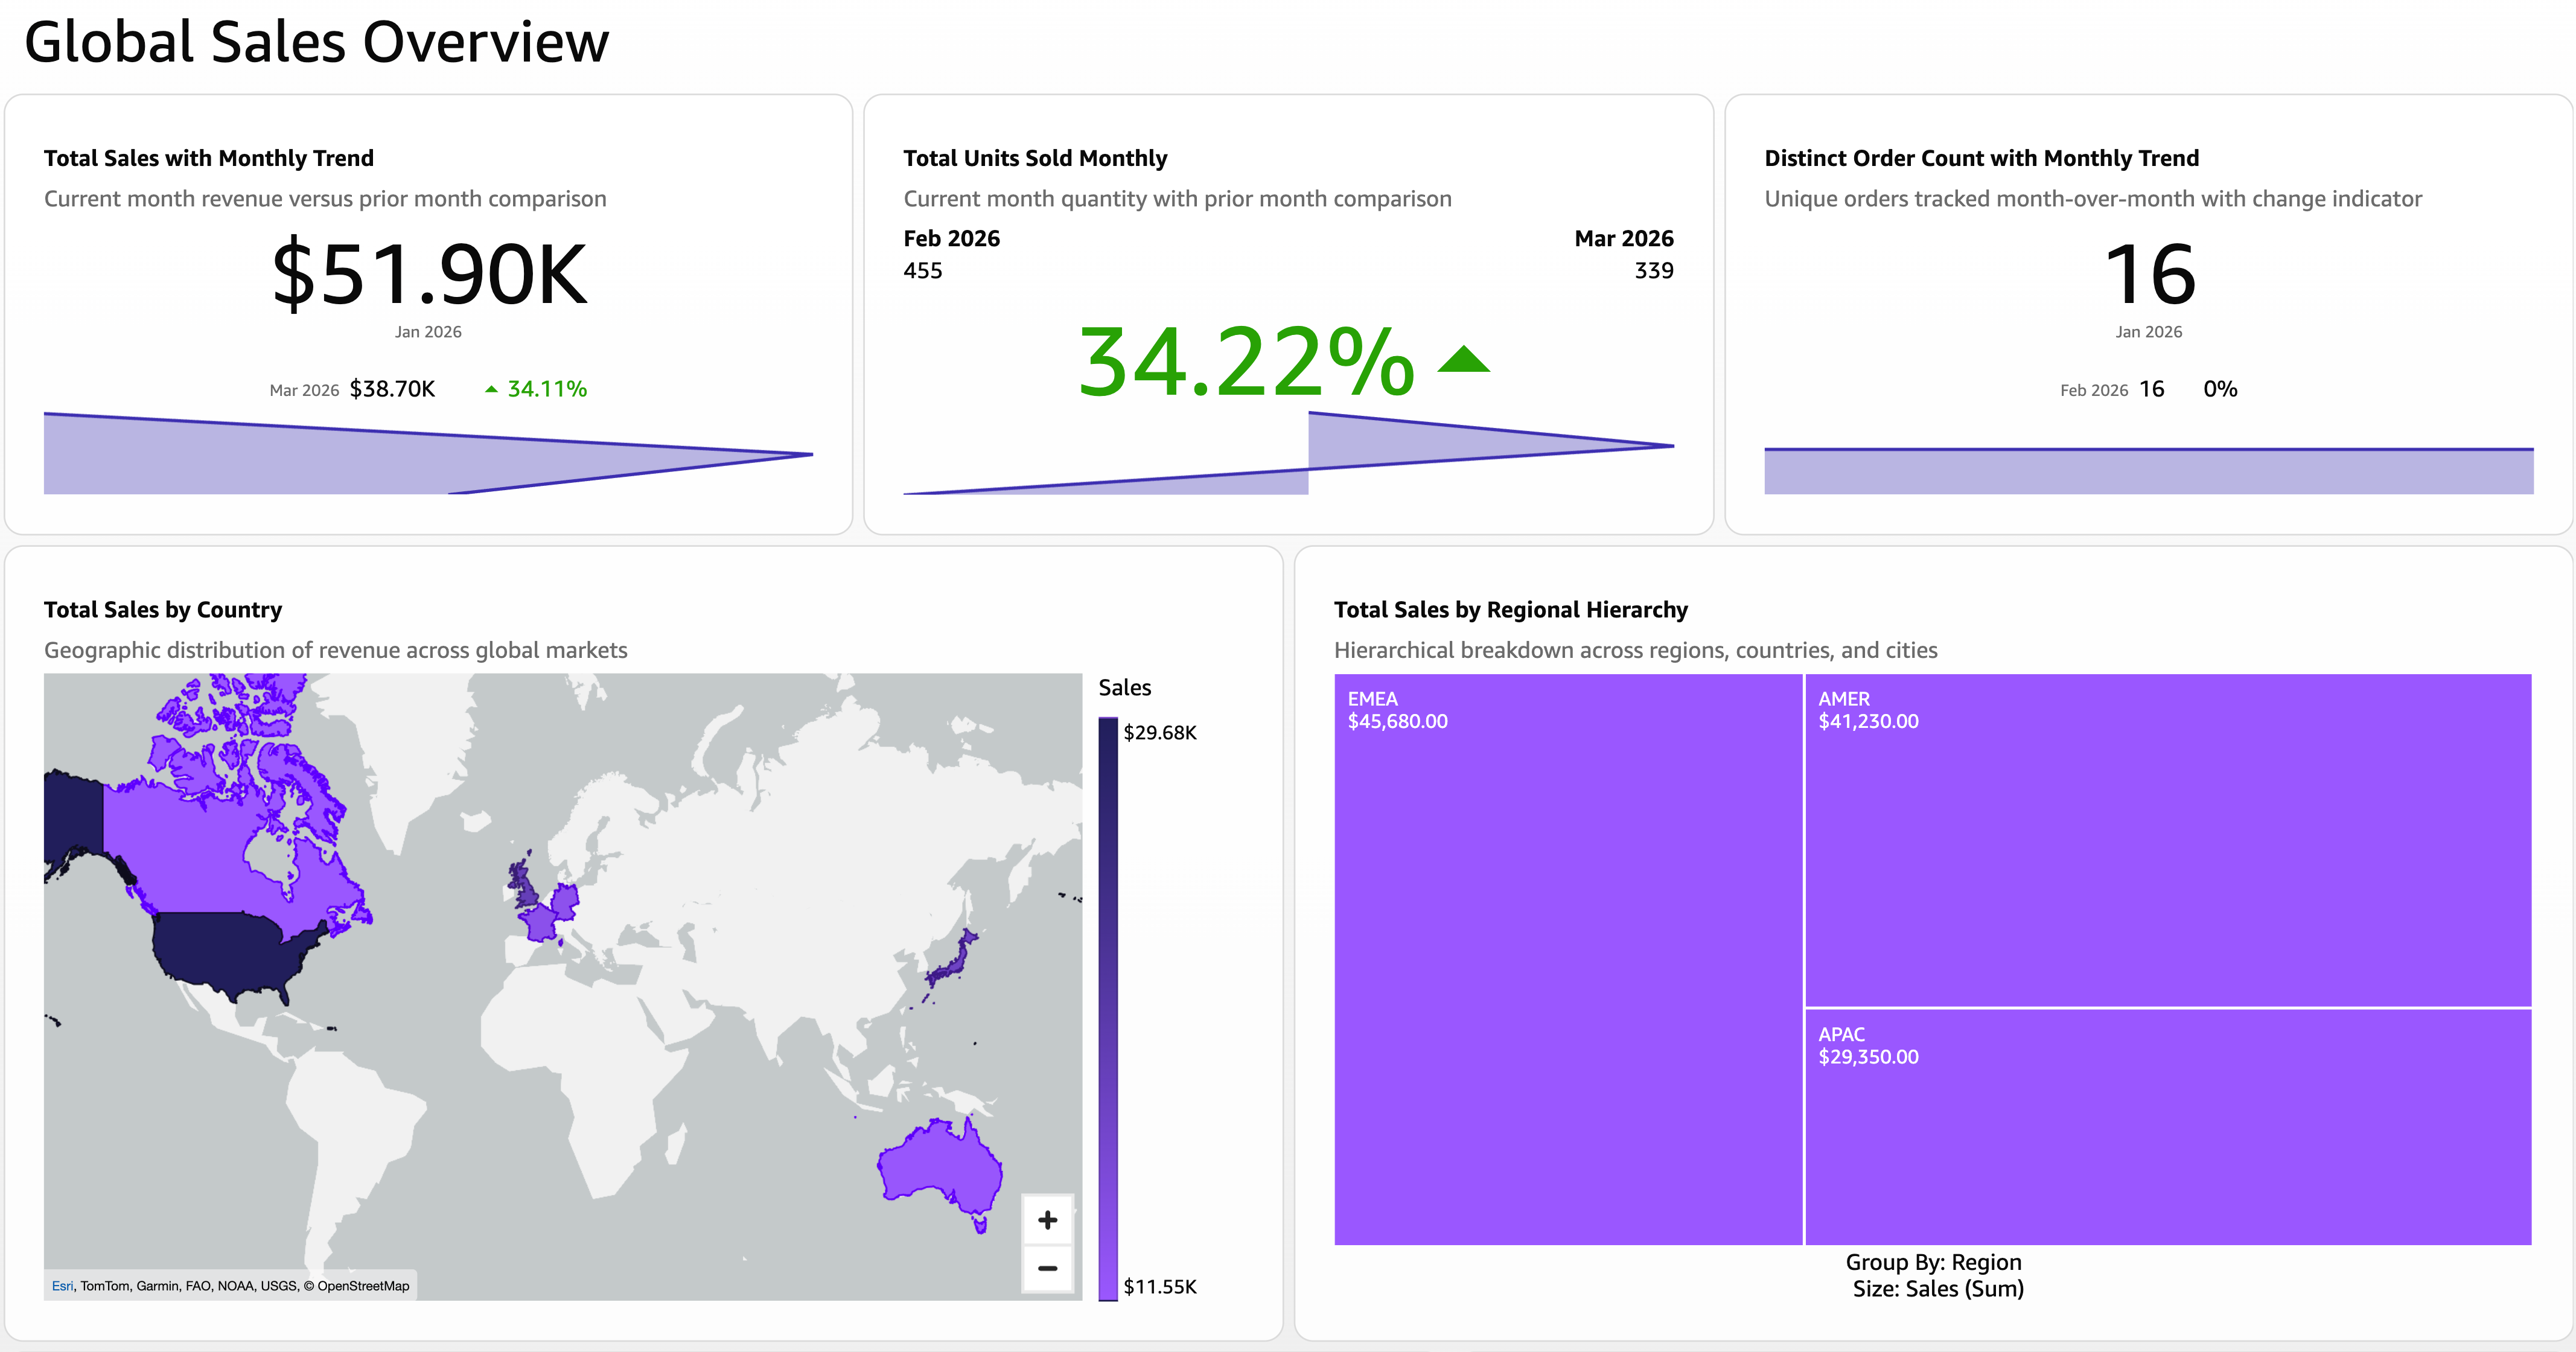
Figure 5: The single-sheet dashboard before the hierarchy filter is added
Prerequisites
You need author access to create and manage analyses and dashboards.
Step 1: Add a filter and set its type to hierarchy filter
- In the Filters pane, choose Add and select the field to filter on (for example, Region).
- Choose the filter to open Edit filter, open the Filter type menu, and under ADVANCED FILTER choose Hierarchy filter. Quick Sight describes it as “Organize and present filter values in a hierarchical tree control.”
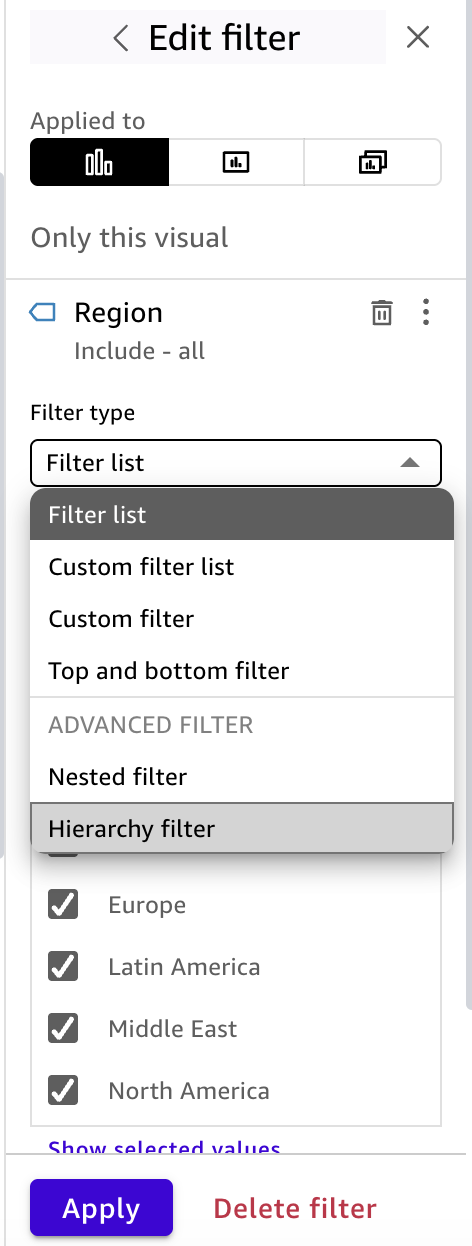
Figure 6: Choosing the hierarchy filter type in the Edit filter pane
Step 2: Add and arrange the fields
A hierarchy filter is a single filter that holds several related fields: up to five levels (for example, Region → Subregion → Country → City → Town). The fields don’t need to be geographic. Any parent-child dimensions work, such as Product Category → Product.
- Under FIELD HIERARCHY, choose Add field to add Region, Country, and City.
- Arrange the fields from broadest to most detailed: Region, then Country, then City. Use each field’s move up and move down control to reorder them. The order sets the reader’s drill-down path. Reordering it later clears any selections already saved on the filter.
- Set Filter condition to Include and choose your Null options.
- Set the scope with the Applied to icons at the top of the pane. The default is Only this visual. Switch it to Cross-sheet (All sheets and visuals) so the control filters the whole dashboard.
- Choose Apply.
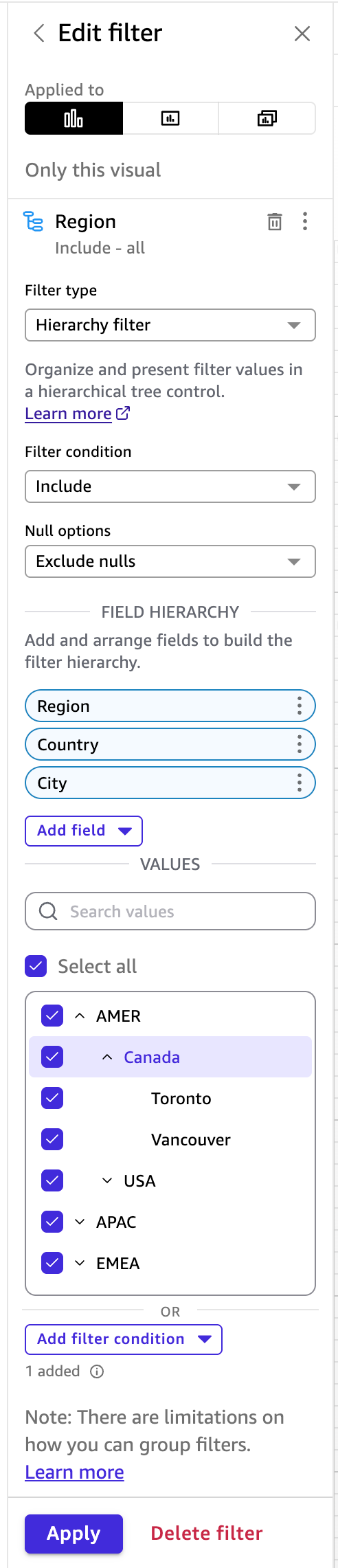
Figure 7: Adding and arranging the Region, Country, and City fields
Step 3: Add the control to the sheet and publish
- From the filter’s options menu (⋮), choose Add to sheet. It appears as a single control, labeled by default something like Hierarchy control for Region, that you can pin to the top of the sheet.
- Remove any older standalone Region, Country, or City controls. The one hierarchy control replaces all three.
- Publish the analysis as a dashboard.
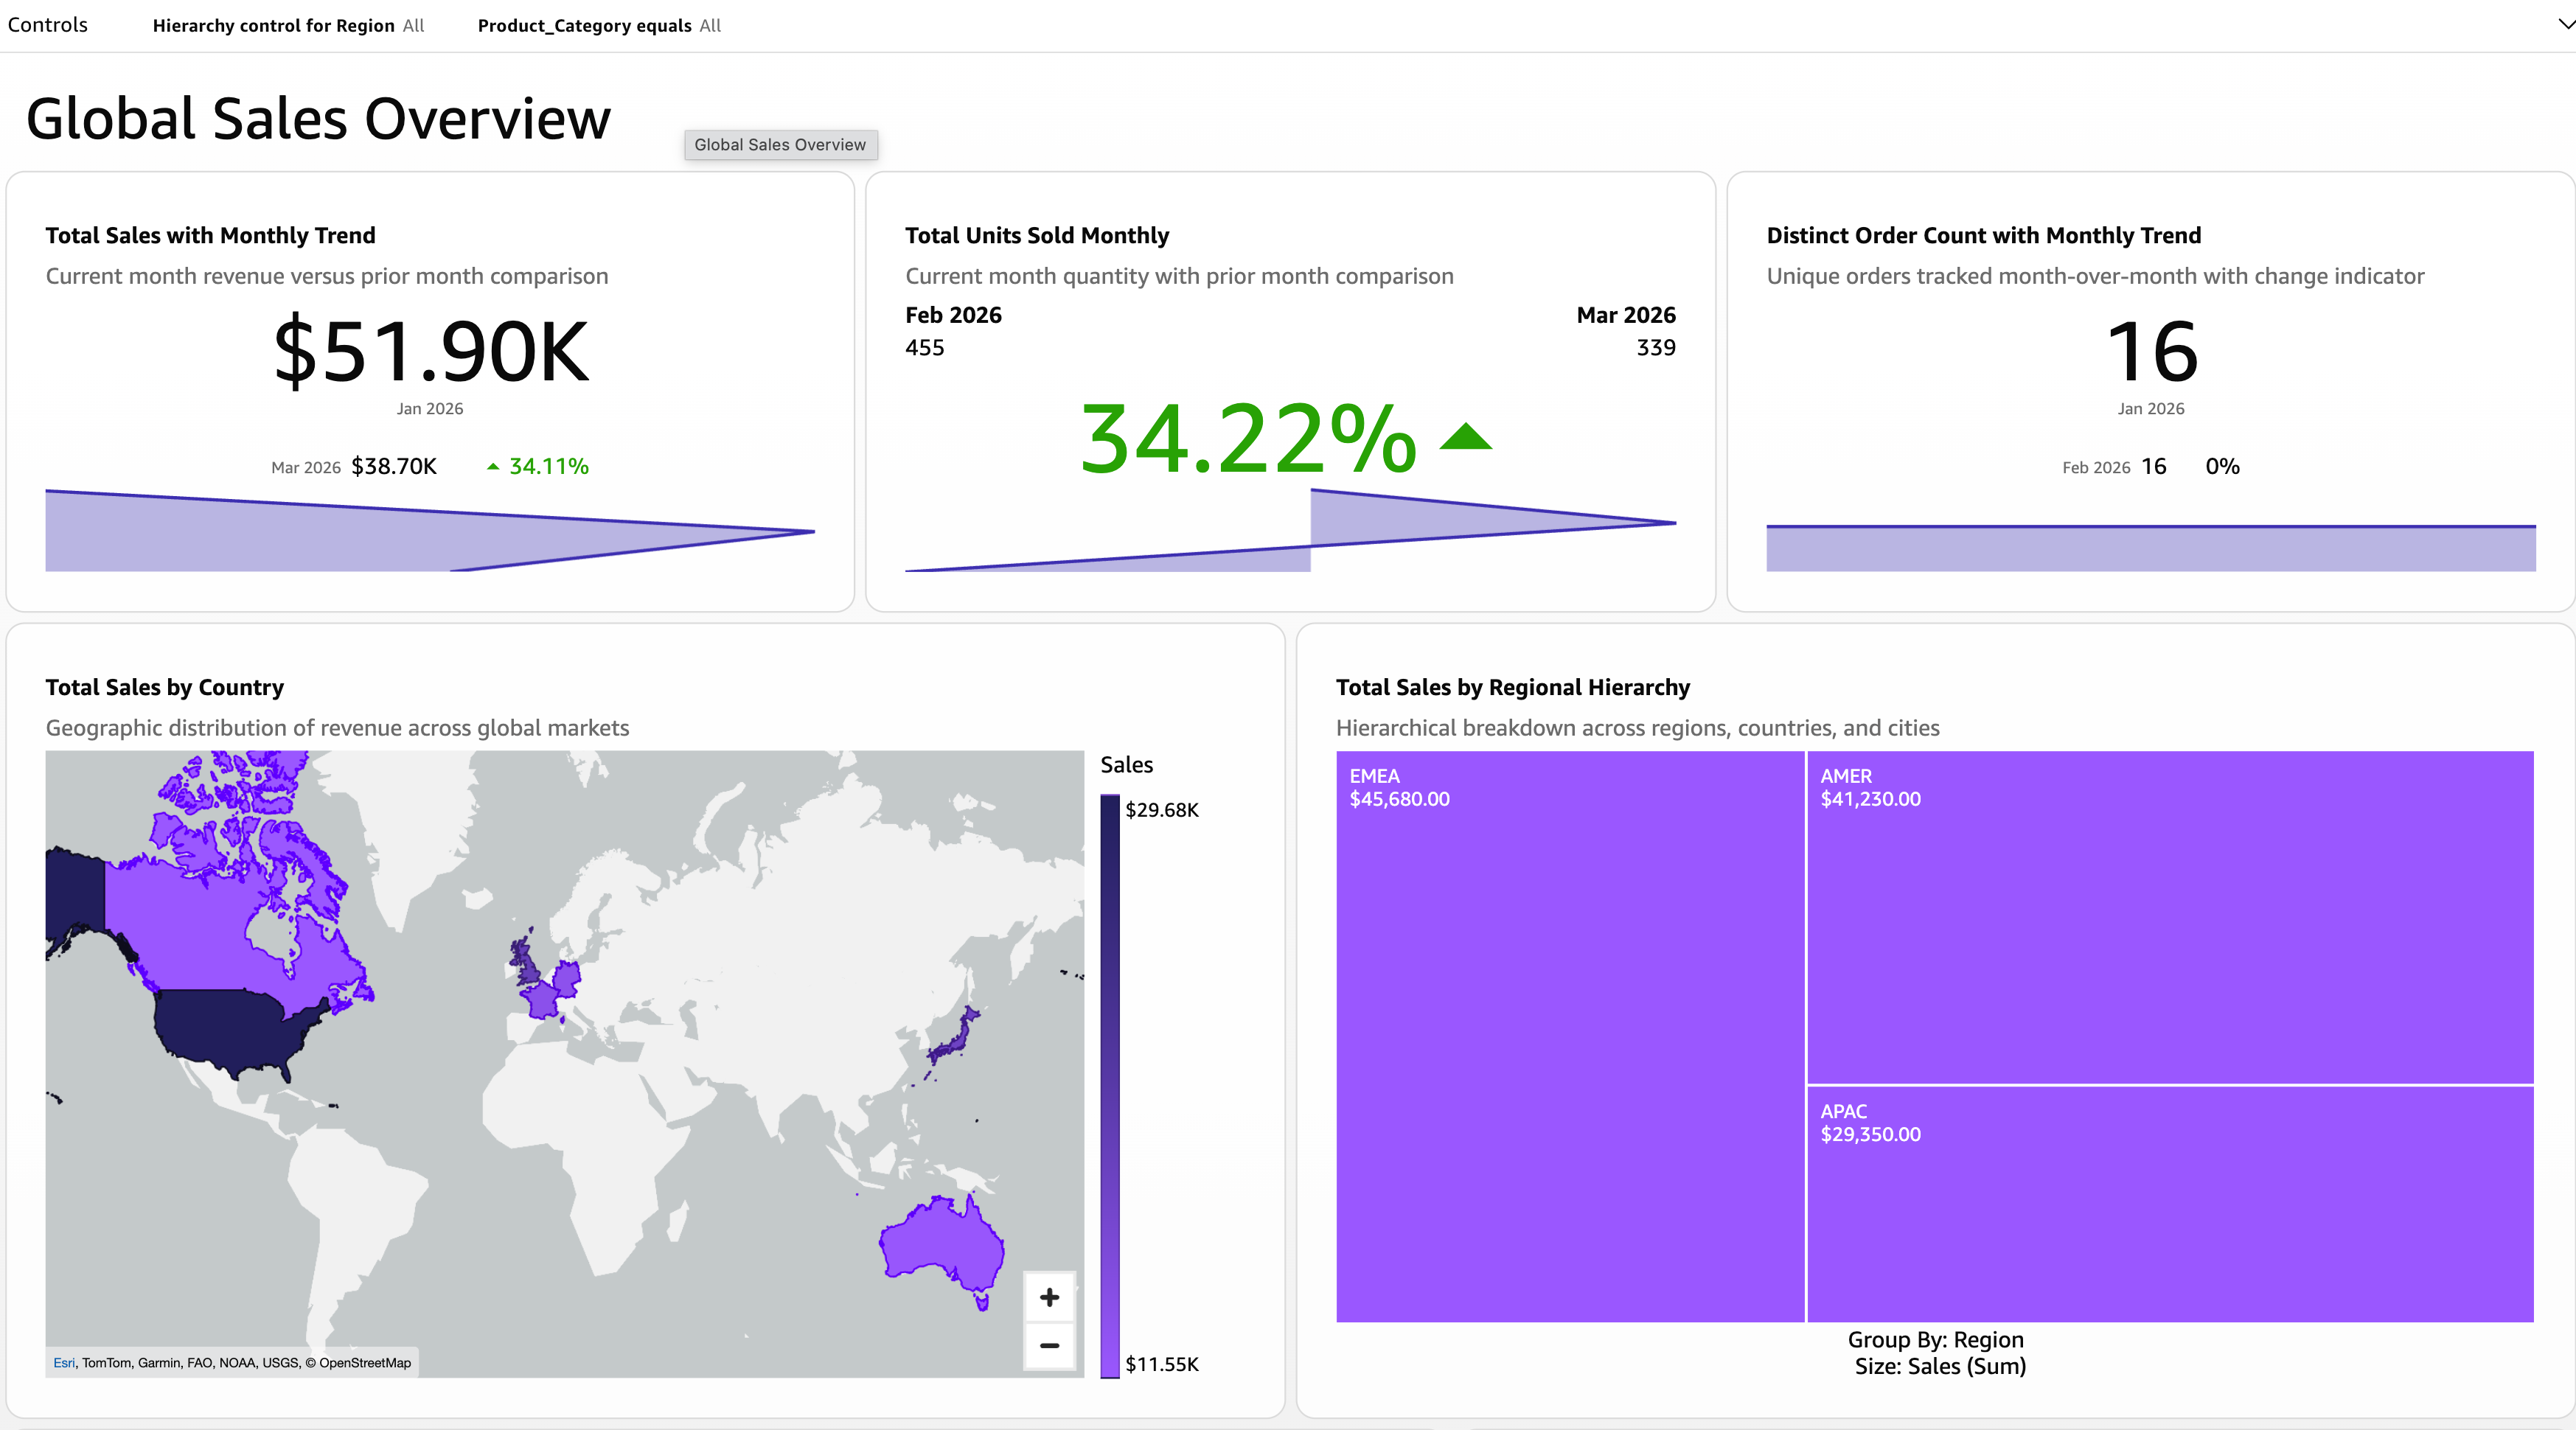
Figure 8: The published dashboard with a single hierarchy control replacing the separate Region, Country, and City filters
The reader experience
Now let’s see it from the reader’s side. The hierarchy filter appears as a single menu control. Opening it reveals a hierarchy: a Select all option, then each region as an expandable node.
Collapsed – The control shows the top level only (AMER, APAC, EMEA), each with an expand arrow. The dashboard shows all data.
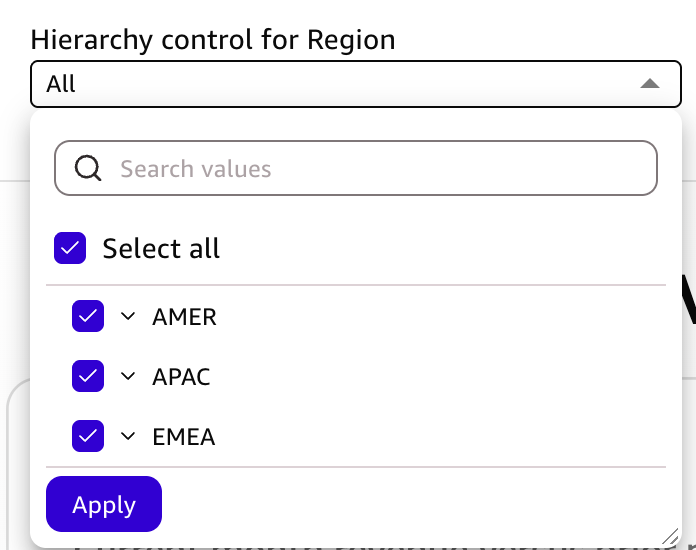
Figure 9: The collapsed hierarchy control showing only the top-level regions
Expand EMEA – The reader selects the arrow next to EMEA, and its countries appear nested beneath it (France, Germany, UK). Expanding UK in turn reveals its cities (London, Manchester, Edinburgh). The relationships are visible directly in the hierarchy, so there’s no need to know the geography in advance.
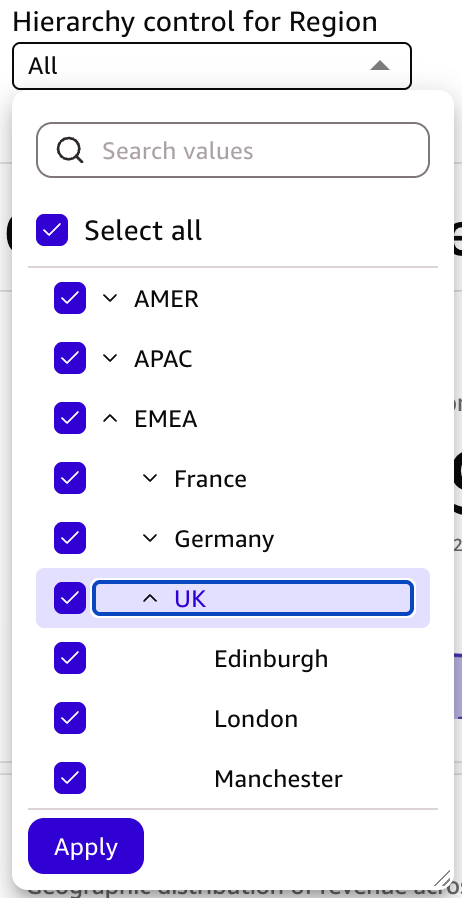
Figure 10: Expanding EMEA and then UK to reveal nested countries and cities
Constraints and considerations
A few things to keep in mind when building a hierarchy filter:
- Number of levels. A hierarchy filter holds up to five data fields (levels).
- Supported field types. Only dimension fields can be added as levels. Text, numeric dimensions, and Boolean fields all qualify. Measures (for example, Sales or Quantity) aren’t offered.
- Reordering. Fields are reordered with move up and move down (one position at a time), not drag-and-drop. Order defines the parent-to-child path.
- Selection behavior. Selecting a value at a lower level auto-selects its parent chain. Selecting a city marks its country and region as partially selected, so the reader always sees the full path of their choice.
- Null handling. A Null options setting (for example, Exclude nulls) controls whether rows with a blank value in a hierarchy field are included. This setting applies only to the values shown in your visuals. It does not affect how null values appear in the hierarchy filter control itself.
- Search behavior. The search bar at the top of the filter searches values in the highest hierarchy level only (for example, Region). It doesn’t search across the whole hierarchy (such as Subregion or Country).
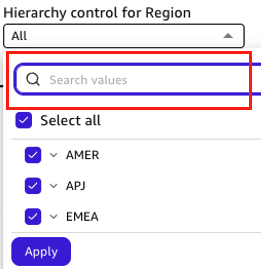
Figure 11: The top-level search bar searches only the highest hierarchy level
Lower levels have their own search boxes, so you can still search values at those levels too. A separate search box appears at a lower level whenever that level contains more than 10 unique values.
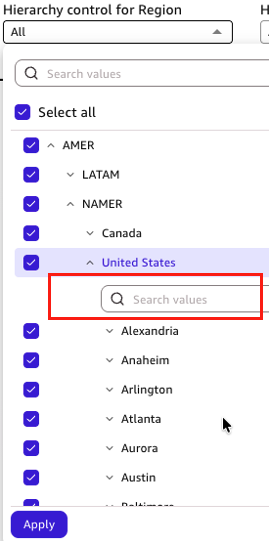
Figure 12: A lower-level search box appears when a level has more than 10 unique values
If a hierarchy level contains more than 1,000 unique values, only a search box appears and no values are displayed. You can use it to find and select the specific values you want to filter on.
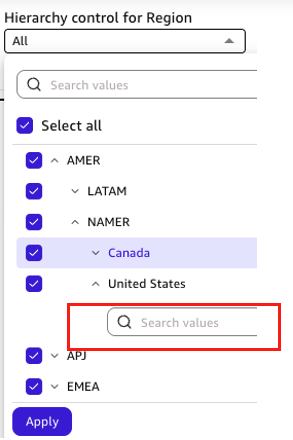
Figure 13: When a level has more than 1,000 unique values, only a search box appears
Conclusion
In this post, we showed how the hierarchy filter helps Amazon Quick Sight authors turn a set of independent controls into a single, guided drill-down. Readers get short, relevant lists, avoid contradictory selections, and explore related dimensions more efficiently, without writing code or changing the underlying data.
To try the hierarchy filter, open the Amazon Quick Sight console and add a filter to one of your analyses. To learn more about filtering, see Filtering data in Amazon Quick Sight in the Amazon Quick Sight User Guide. Have a question, or want to share how you use hierarchy filters? Let us know in the comments.