AWS Cloud Operations Blog
Use CloudWatch syslog and Log Alarms to give AWS DevOps Agent on-premises visibility
Your on-premises firewalls, routers, and switches emit syslog that record device events such as denied connections, tunnel state changes, and routing changes. Network devices send their logs over syslog rather than the Amazon CloudWatch Logs API, so bringing that data into AWS takes extra components. A common approach has been to run a collection tier on an Amazon Elastic Compute Cloud (Amazon EC2) instance. A syslog daemon on that instance receives device messages and writes them to a log file. The CloudWatch agent then tails that file and sends it to CloudWatch Logs.
That collection tier sits in the delivery path, so now you are running a highly available fleet and scaling it as your log volume grows. Syslog also comes in more than one format, so the collector must parse those formats into searchable fields. That is the infrastructure you build and maintain before any log reaches CloudWatch.
Amazon CloudWatch now accepts syslog from these devices without that collection tier, and it can raise an alarm straight from a log query. In this post, we send device syslog into CloudWatch, then query the extracted fields and alarm on the messages that matter. At the end, you route those alarms to the AWS DevOps Agent so it investigates the event using the device logs.
Amazon CloudWatch managed syslog ingestion
The first capability is how device syslog gets into CloudWatch. CloudWatch managed syslog ingestion accepts messages from firewalls, routers, switches, and Linux servers. It reads the common formats, including RFC 5424, RFC 3164, and the Cisco FTD and ASA formats. Your devices send messages over TCP, TCP with TLS, or UDP to a syslog Amazon Virtual Private Cloud (Amazon VPC) endpoint in your account, and the traffic travels through AWS PrivateLink to the CloudWatch Logs syslog service. You do not install anything on the device or run a collector.
Devices reach the endpoint on one of three ports. TCP with TLS on port 6514 is the recommended choice, and it encrypts the traffic with an AWS-managed certificate from Amazon Trust Services, which most operating systems and syslog daemons already trust. If a device does not, add the Amazon Trust Services root certificates to its trust store. For details, see Configuring syslog devices. The endpoint also accepts plaintext. Port 1514 is plaintext TCP that still travels over AWS PrivateLink, so it stays on the private network even without TLS. Port 514 is UDP, the traditional syslog default, best effort and fine for networks where occasional loss is acceptable.
The service parses each message and extracts fields such as facility, severity, hostname, and appName, and it stores the raw message in your log group. You query these fields without building a parsing pipeline, which is the part that usually takes the most effort with network logs. For the full list of formats, ports, and extracted fields, see the syslog ingestion documentation.
Syslog message formats
Every syslog message carries a priority value, a timestamp, a host, and the message text. The exact layout depends on the format the device uses. CloudWatch parses the common formats for you, so it helps to know what each one looks like.
RFC 3164 is the original BSD syslog format. It is compact, and its timestamp carries no year and no time zone. A message in this format looks like this.
<34>Jul 1 22:14:15 mymachine su: 'su root' failed for lonvick on /dev/pts/8
RFC 5424 is the modern replacement. It adds a version number, an ISO 8601 timestamp with a time zone, an application name, a process ID, a message ID, and optional structured data. A message in this format looks like this.
Many firewalls and routers send a vendor variant such as the Cisco FTD and ASA formats, which CloudWatch also parses into structured fields. RFC 5424 and RFC 3164 share the same field names, so one query works across both. The Cisco formats expose their own fields, such as deviceId and messageId, which you query the same way once you know the names.
CloudWatch Log Alarms
Once the logs are in CloudWatch, you need to know when one of them needs attention. A Log Alarm raises an alarm from the result of a scheduled Amazon CloudWatch Logs Analytics query. You give it a query and an aggregation, and it moves to the ALARM state when the aggregated value crosses your threshold. Alarming on log content used to require a metric filter, but CloudWatch now supports alarms directly on log queries, so the query itself is the detector. This matters for syslog because the events you care about appear as text in the message body, and you alarm on that text directly. For the query and evaluation model, see the Log Alarms documentation.
Solution overview
With managed syslog ingestion and Log Alarms covered, here is how they fit together end to end. A branch office reaches AWS over AWS Site-to-Site VPN or AWS Direct Connect, whichever path already connects your network. Either one gives your on-premises network a route to a syslog VPC endpoint that you create in a subnet of an Amazon Virtual Private Cloud (Amazon VPC). Once the route exists, the firewalls, routers, switches, and servers behind it can each send syslog to the endpoint when your network team routes them to it. Logs from many devices land in the same log group. This walkthrough demonstrates with a single branch firewall, but in production many on-premises devices can send logs through the same path to the VPC endpoint. In this solution, two Log Alarms watch the log group, one for firewall deny messages and one for a VPN tunnel that goes down. Each alarm enters ALARM state when its query finds a matching message, then publishes to an Amazon Simple Notification Service (Amazon SNS) topic. An AWS Lambda function subscribed to the topic signs the event and posts it to the AWS DevOps Agent webhook.
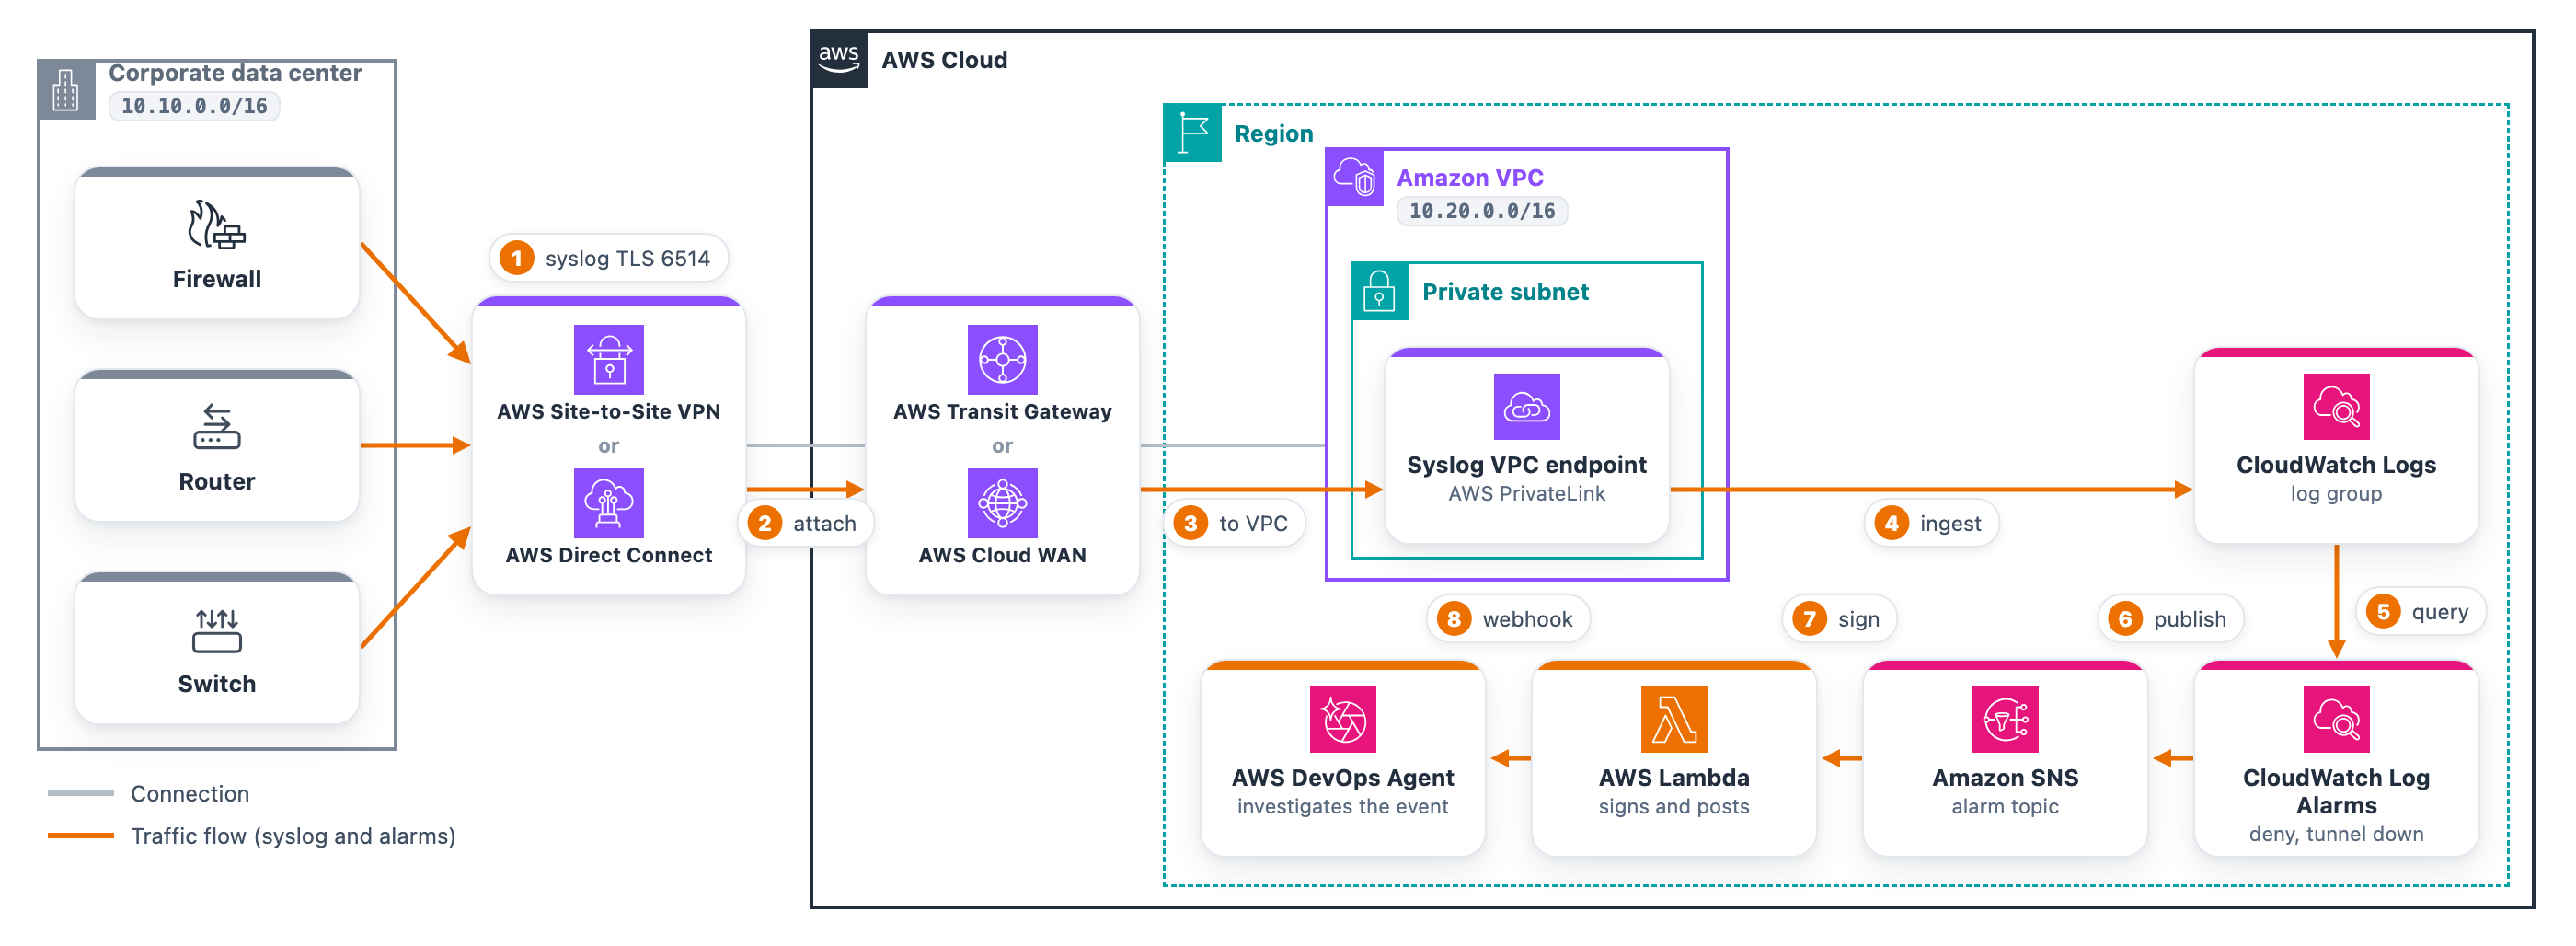
Figure 1. End-to-end architecture.
Plan for resilient connectivity to AWS
This design depends on the connection between your network and AWS, so make that connection highly available before you rely on it for logs.
This design depends on the connection between your network and AWS, so make that path highly available before you rely on it for logs. With AWS Site-to-Site VPN, configure both tunnels on your customer gateway and consider a second gateway for full redundancy. For details, see Resilience in AWS Site-to-Site VPN. With AWS Direct Connect, use the AWS Direct Connect Resiliency Toolkit to select a connection model that meets your target SLA. You can also run a Site-to-Site VPN as a backup path.
When the whole path is unavailable, devices cannot reach the endpoint. Configure your syslog daemon (for example, rsyslog) with disk-assisted queuing so messages persist across restarts and are forwarded once the link returns. Choose TCP with TLS over UDP, because TCP lets the client detect delivery failures and buffer retries, whereas UDP silently drops undelivered messages. For delivery behavior details, see the syslog ingestion documentation.
Prerequisites
- An AWS account with permission to create VPC endpoints, log groups, alarms, and SNS topics.
- An Amazon VPC that your on-premises network reaches over AWS Site-to-Site VPN or AWS Direct Connect.
- A network device or Linux host that sends syslog in RFC 5424 or RFC 3164 format.
- Access to the AWS DevOps Agent, with an inbound webhook URL and signing secret. For setup instructions, see Getting started with AWS DevOps Agent and Invoking DevOps Agent through Webhook.
Walkthrough
A. Set up managed syslog ingestion
We work in the AWS account that receives the logs. We create the syslog resources there and place the endpoint in a subnet that our on-premises devices can reach.
- A log group named
/syslog/edge-demothat receives the messages. - A security group that allows inbound TCP 6514 from our on-premises source range.
- A syslog VPC endpoint in that subnet, using the security group.
- A VPC endpoint policy that allows the syslog write actions and scopes them to our account and VPC. Syslog arrives with no IAM identity, so the policy uses a wildcard principal and scopes by condition keys. Replace the
ACCOUNTandVPC_IDvalues with your own. - A resource policy on the log group that lets the syslog service principal write to it, scoped to our VPC endpoint by the source ARN. Replace the
REGION,ACCOUNT, andENDPOINT_IDvalues with your own. - A syslog configuration that routes the endpoint to the log group.
For the detailed steps to create these in your own account, see Setting up syslog ingestion.
With those resources created, the next two screenshots show the endpoint and the configuration that links it to the log group.
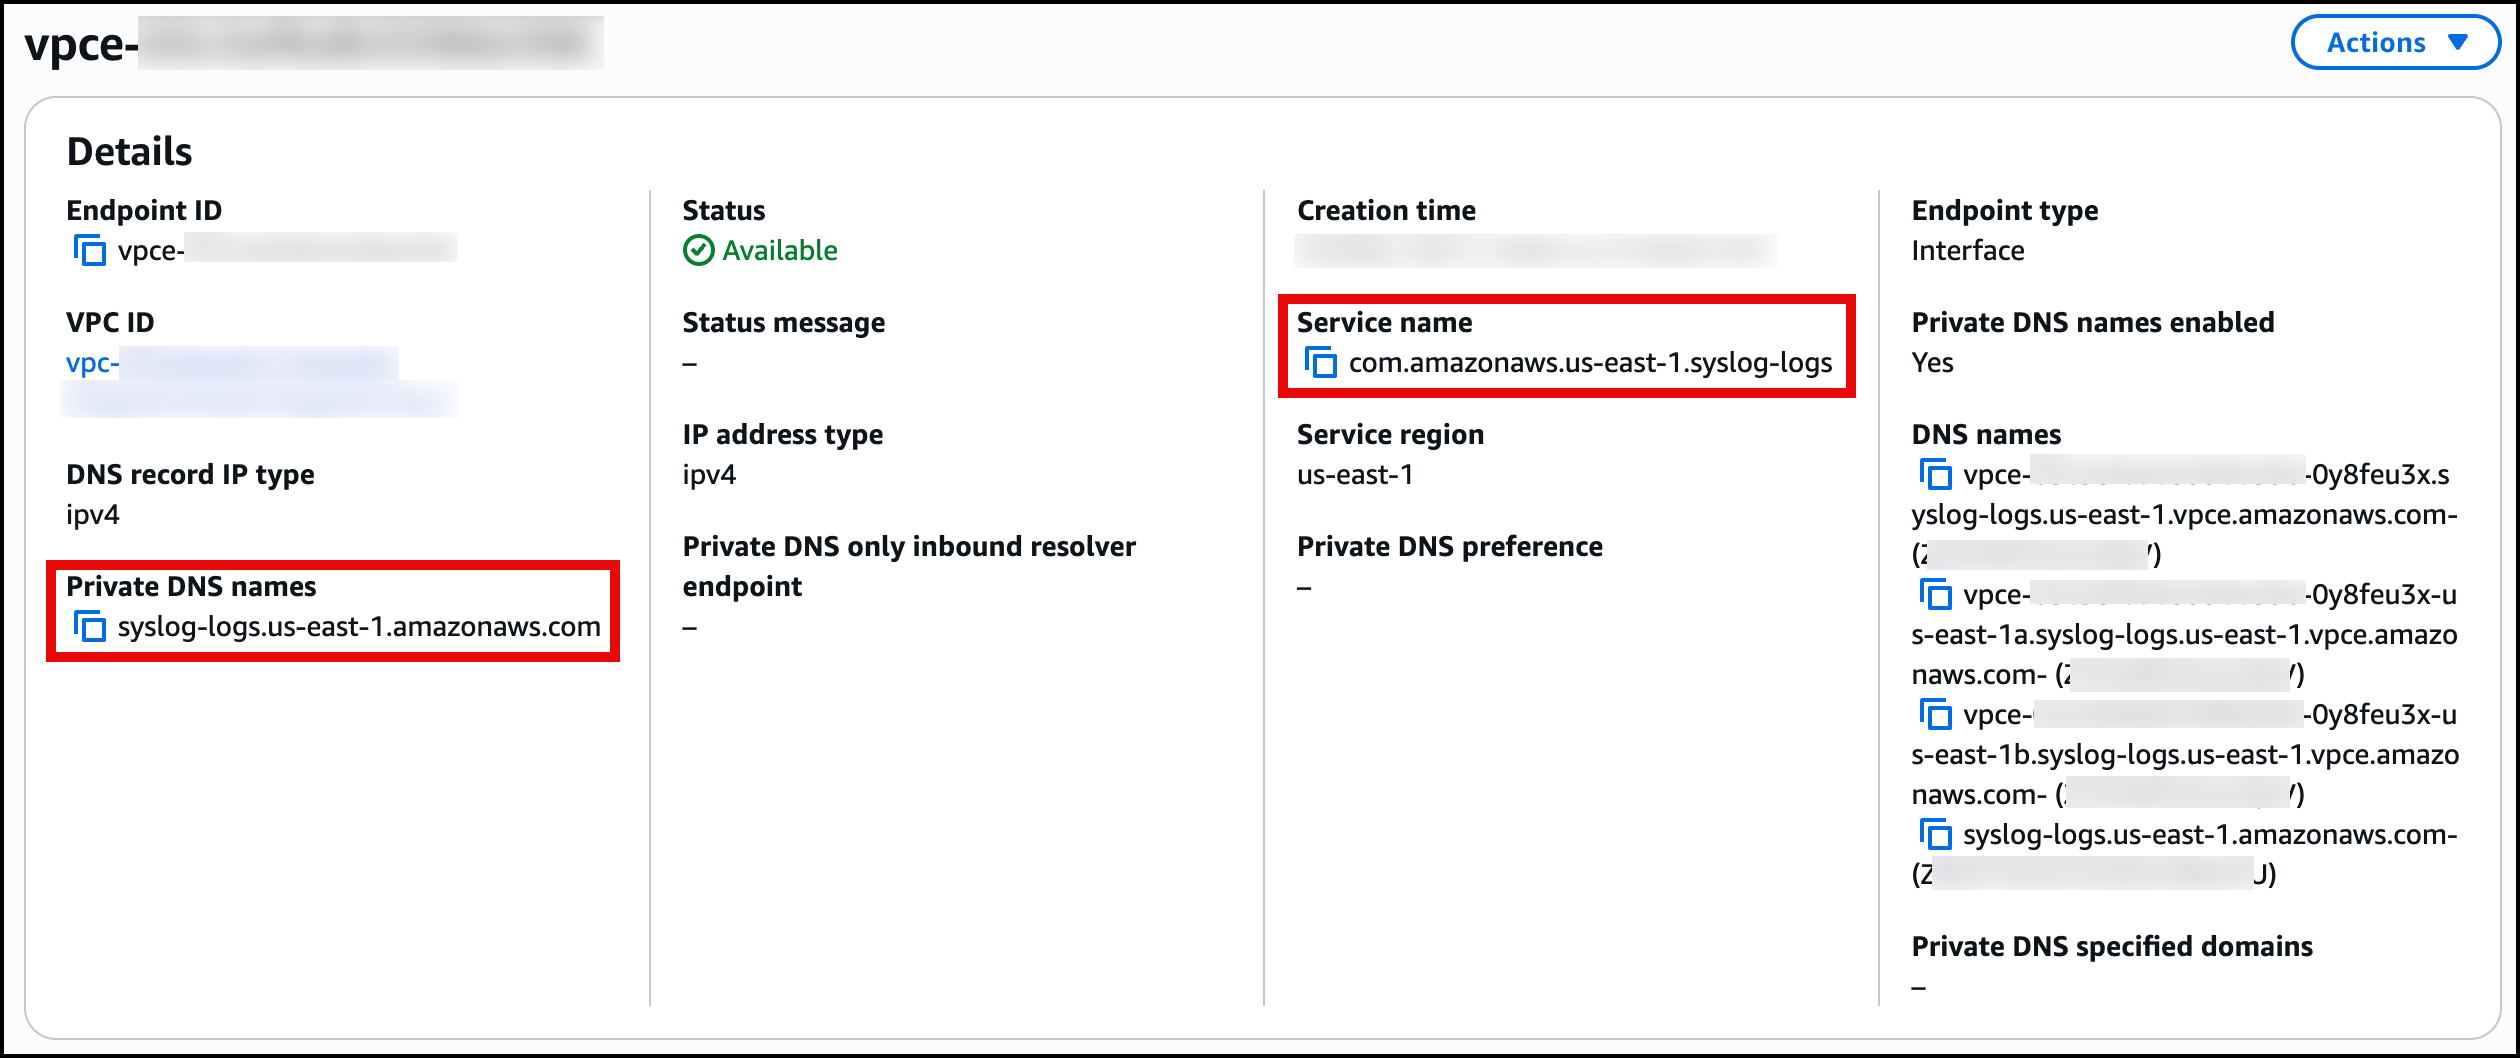
Figure 2. Syslog VPC endpoint DNS name.
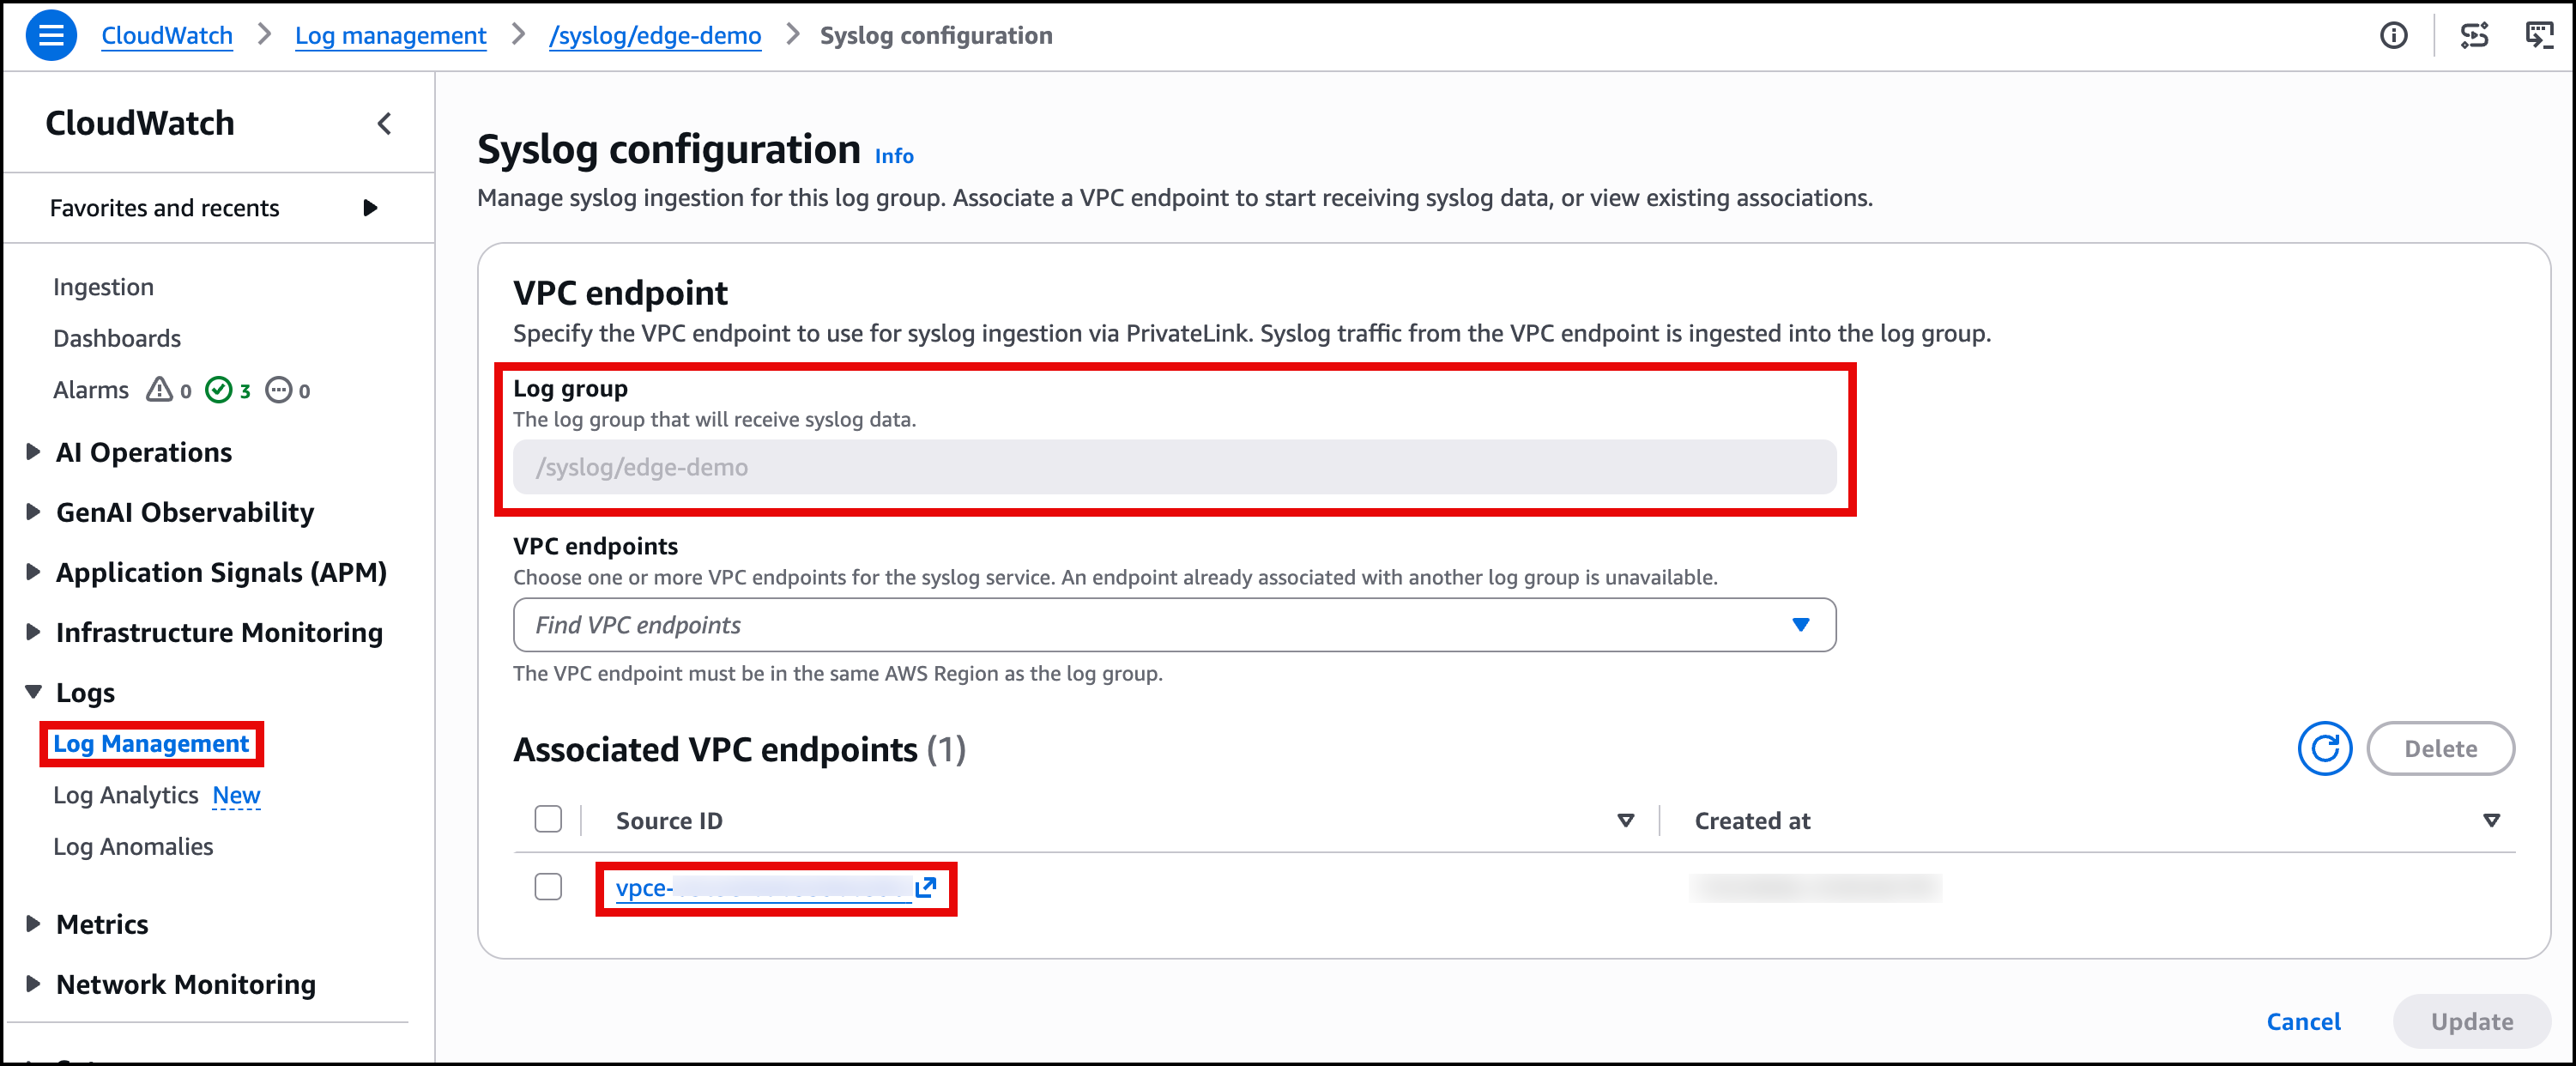
Figure 3. Syslog configuration on the log group.
B. Send device syslog to the endpoint
Our edge device is a Linux host running rsyslog, standing in for a branch firewall. Ours run Amazon Linux 2 to replicate an on-premises device inside AWS, and any Linux with rsyslog follows the same steps. It also uses nftables for packet filtering, strongSwan for the IPsec VPN tunnels, and Quagga for BGP routing over those tunnels, which together produce the deny and tunnel-down events. It forwards to the endpoint’s private IP over TCP with TLS on port 6514, in both RFC 5424 and RFC 3164 formats. We configure the device with the following steps. Replace ENDPOINT_IP with the private address of your VPC endpoint.
- Set the device hostname to
edge-fw-01so every message carries a source you can filter on.sudo hostnamectl set-hostname edge-fw-01 - Create the rsyslog drop-in. The following command uses tee to write the forwarding configuration to
/etc/rsyslog.d/10-edge-forward.conf. It forwards the firewall deny and tunnel-down events, plus test messages on the local0 facility, to the endpoint’s private IP on port 6514. It sends in both RFC 5424 and RFC 3164 formats. The configuration validates the endpoint certificate against the system CA bundle (on Amazon Linux,/etc/pki/tls/certs/ca-bundle.crt; the path varies by distribution). That bundle already trusts the Amazon Trust Services roots, so no custom trust store is needed. - Check the configuration for syntax errors.
sudo rsyslogd -N1 - Reload rsyslog to apply the change.
sudo systemctl restart rsyslog - Send a test message with logger to verify the path end to end.
logger -t edgetest -p local0.info "test message from edge-fw-01"
For the exact syntax on rsyslog, syslog-ng, or a network appliance, see Configuring syslog devices.
Within a few seconds it lands in /syslog/edge-demo. CloudWatch shows the fields it extracted, hostname, appName, severity, and facility, next to @message, which holds the full original syslog line. You see the message twice because the configuration forwards it in both RFC 5424 and RFC 3164, so CloudWatch parses each format. The later figures show both formats for the same reason. In production you would typically send a single format.
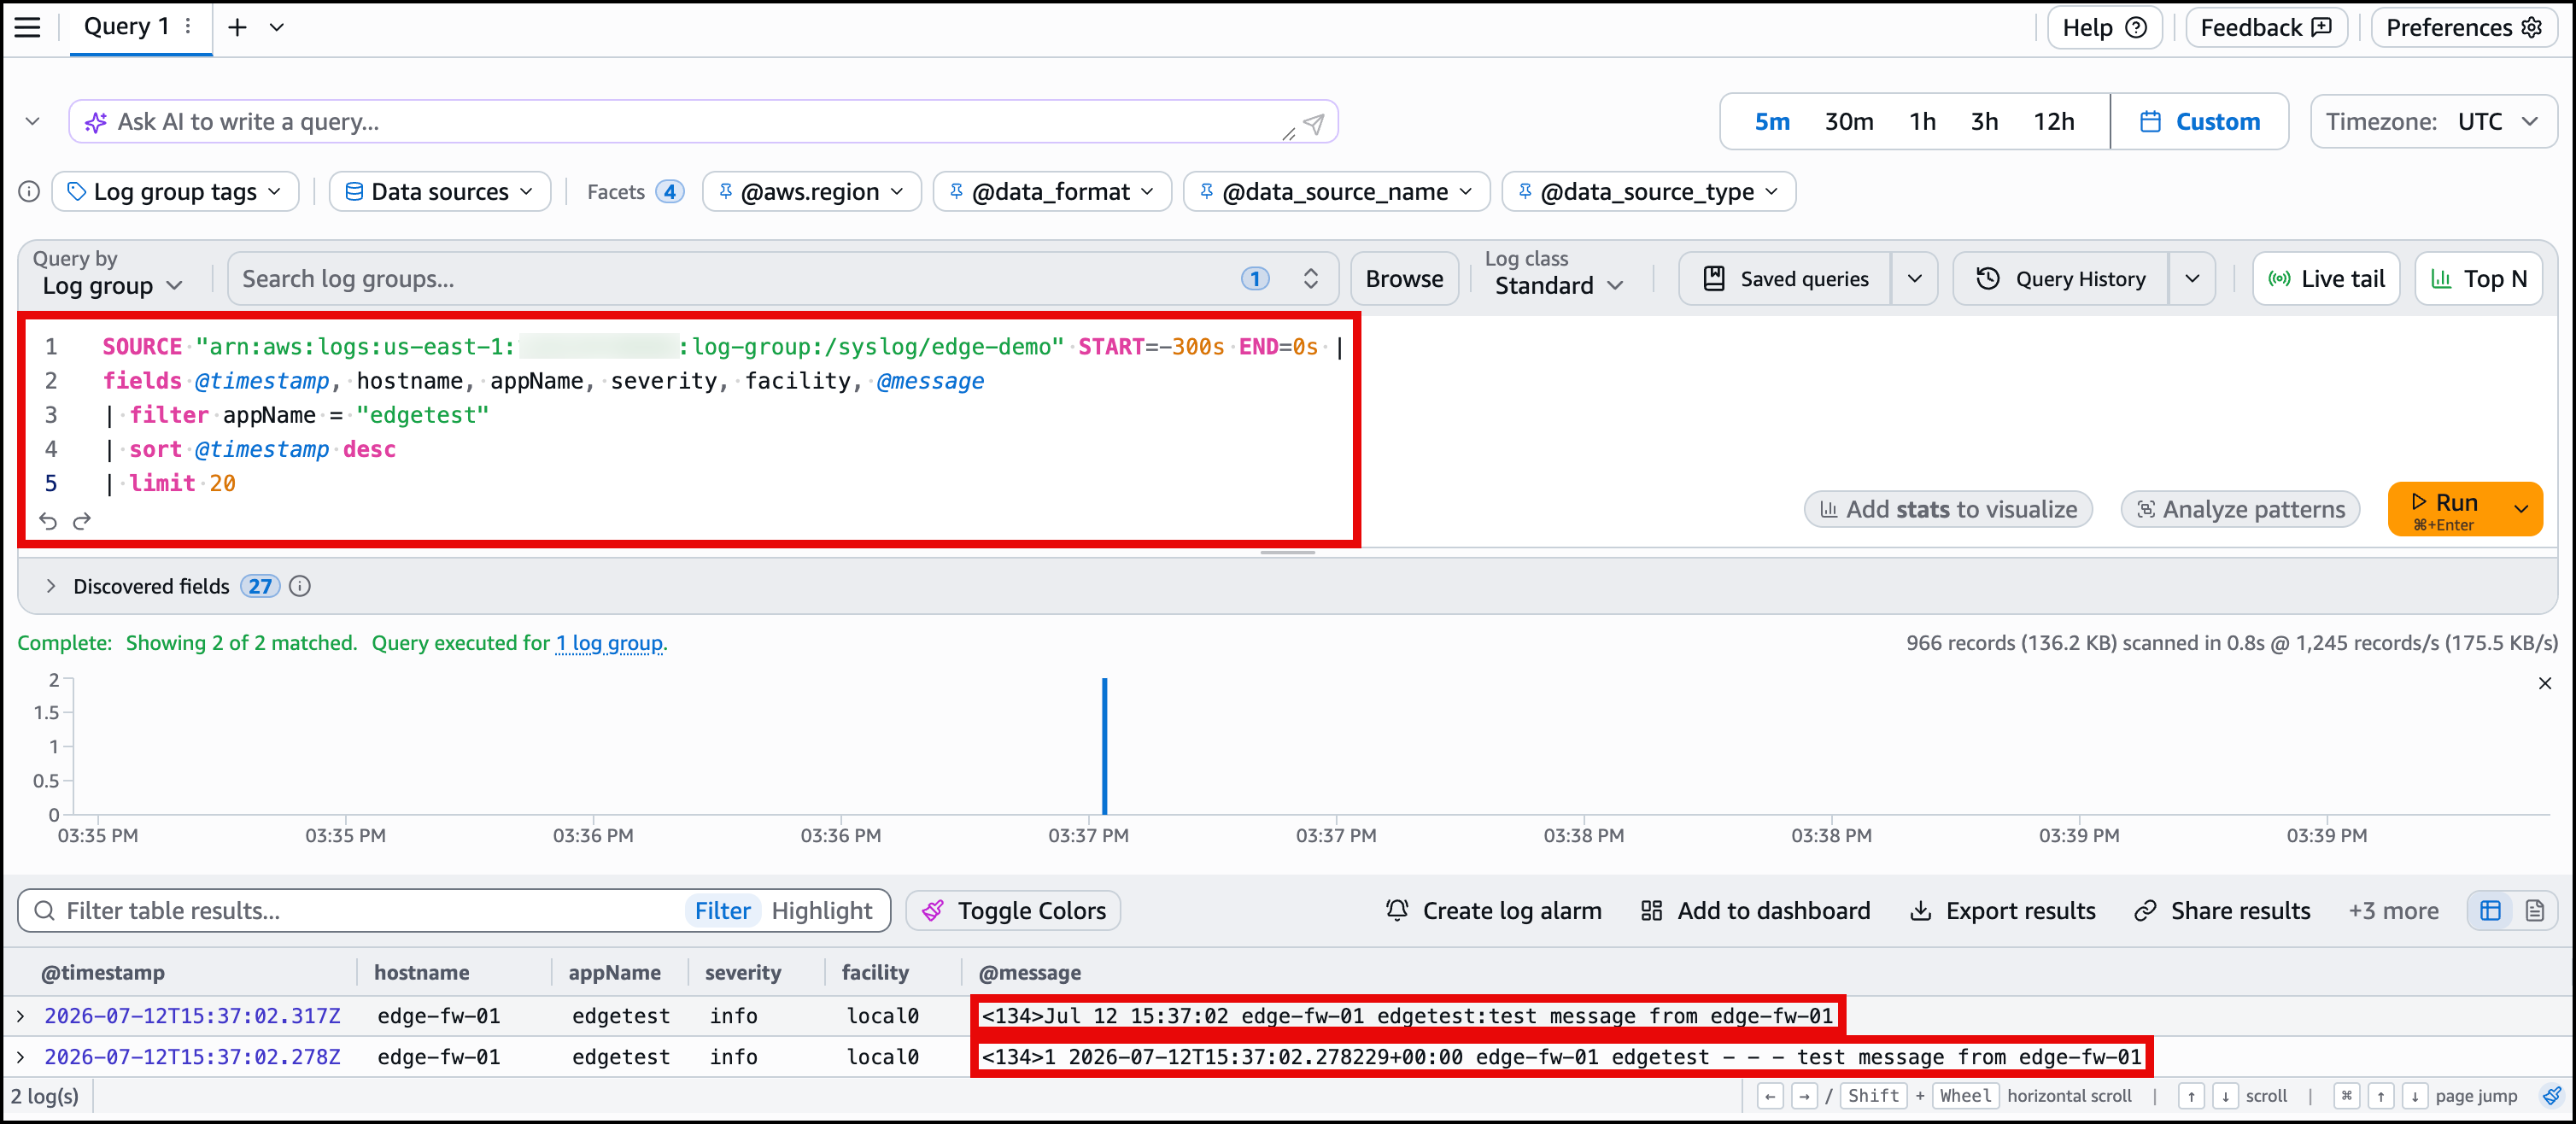
Figure 4. Test message with extracted fields.
With the path is confirmed, we trigger the two failures we care about from the on-premises side and watch them arrive in the same log group.
The first is a denied connection. When the firewall drops traffic, it is set to block, it logs the drop with an EDGE-DENY marker, shown in Figure 5.
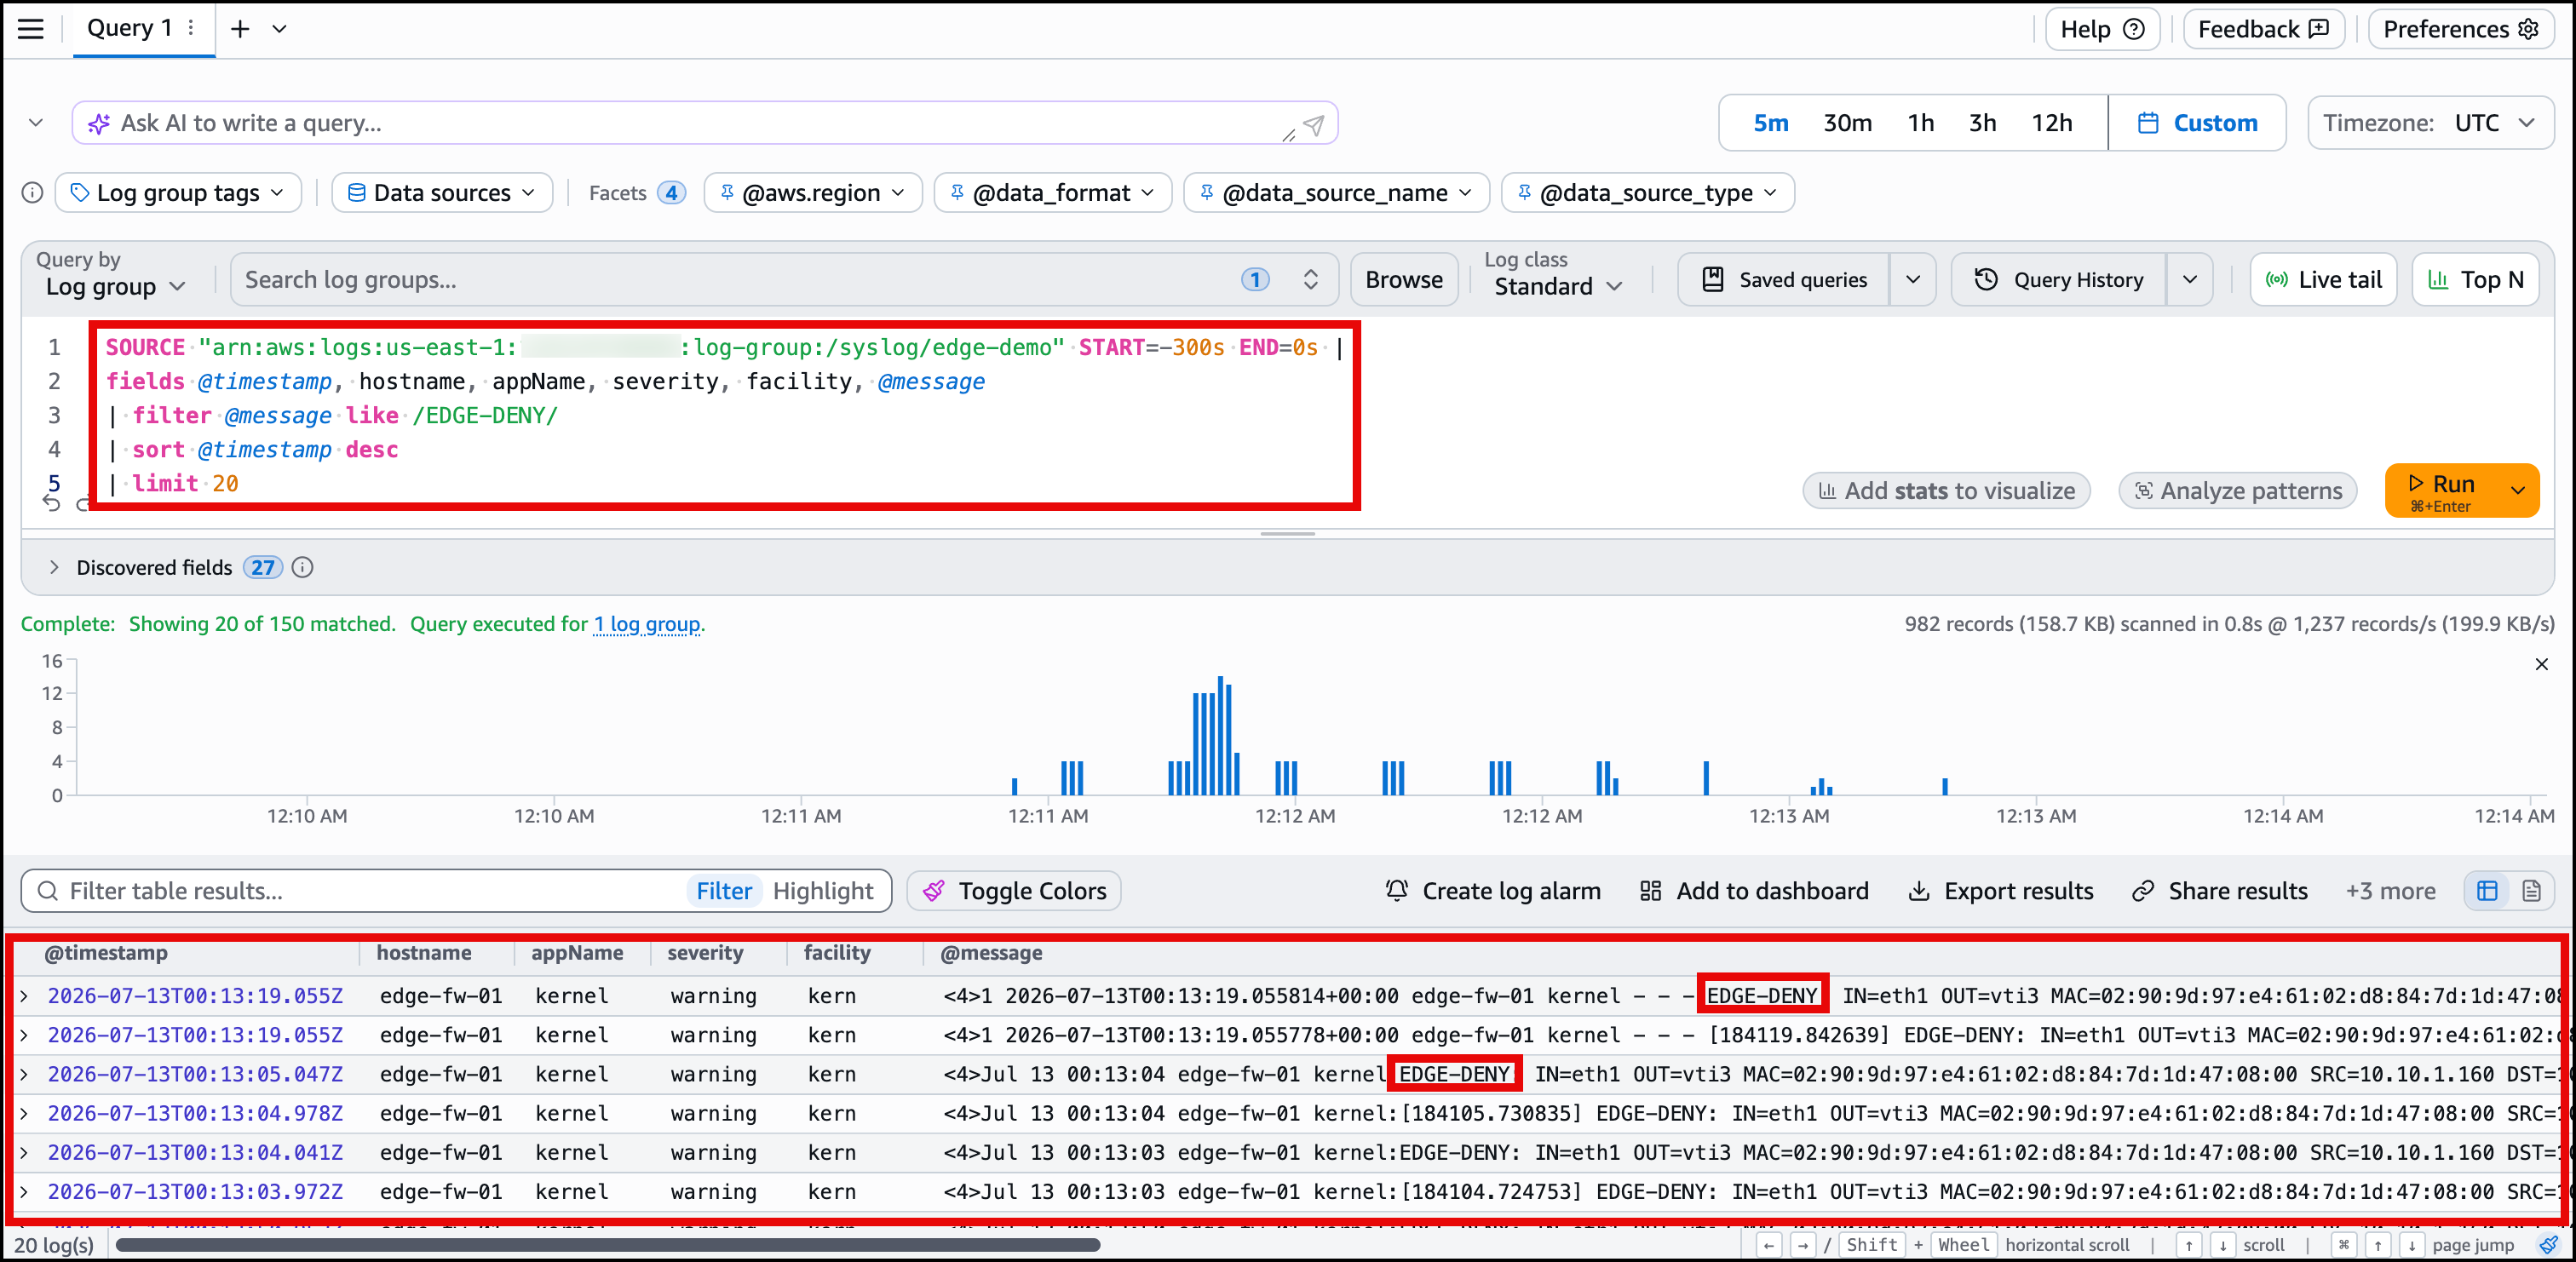
Figure 5. Denied connection event with extracted fields.
The second is a tunnel going down. When a VPN tunnel drops, the router logs a BGP neighbor down event marked %ADJCHANGE, shown in Figure 6.
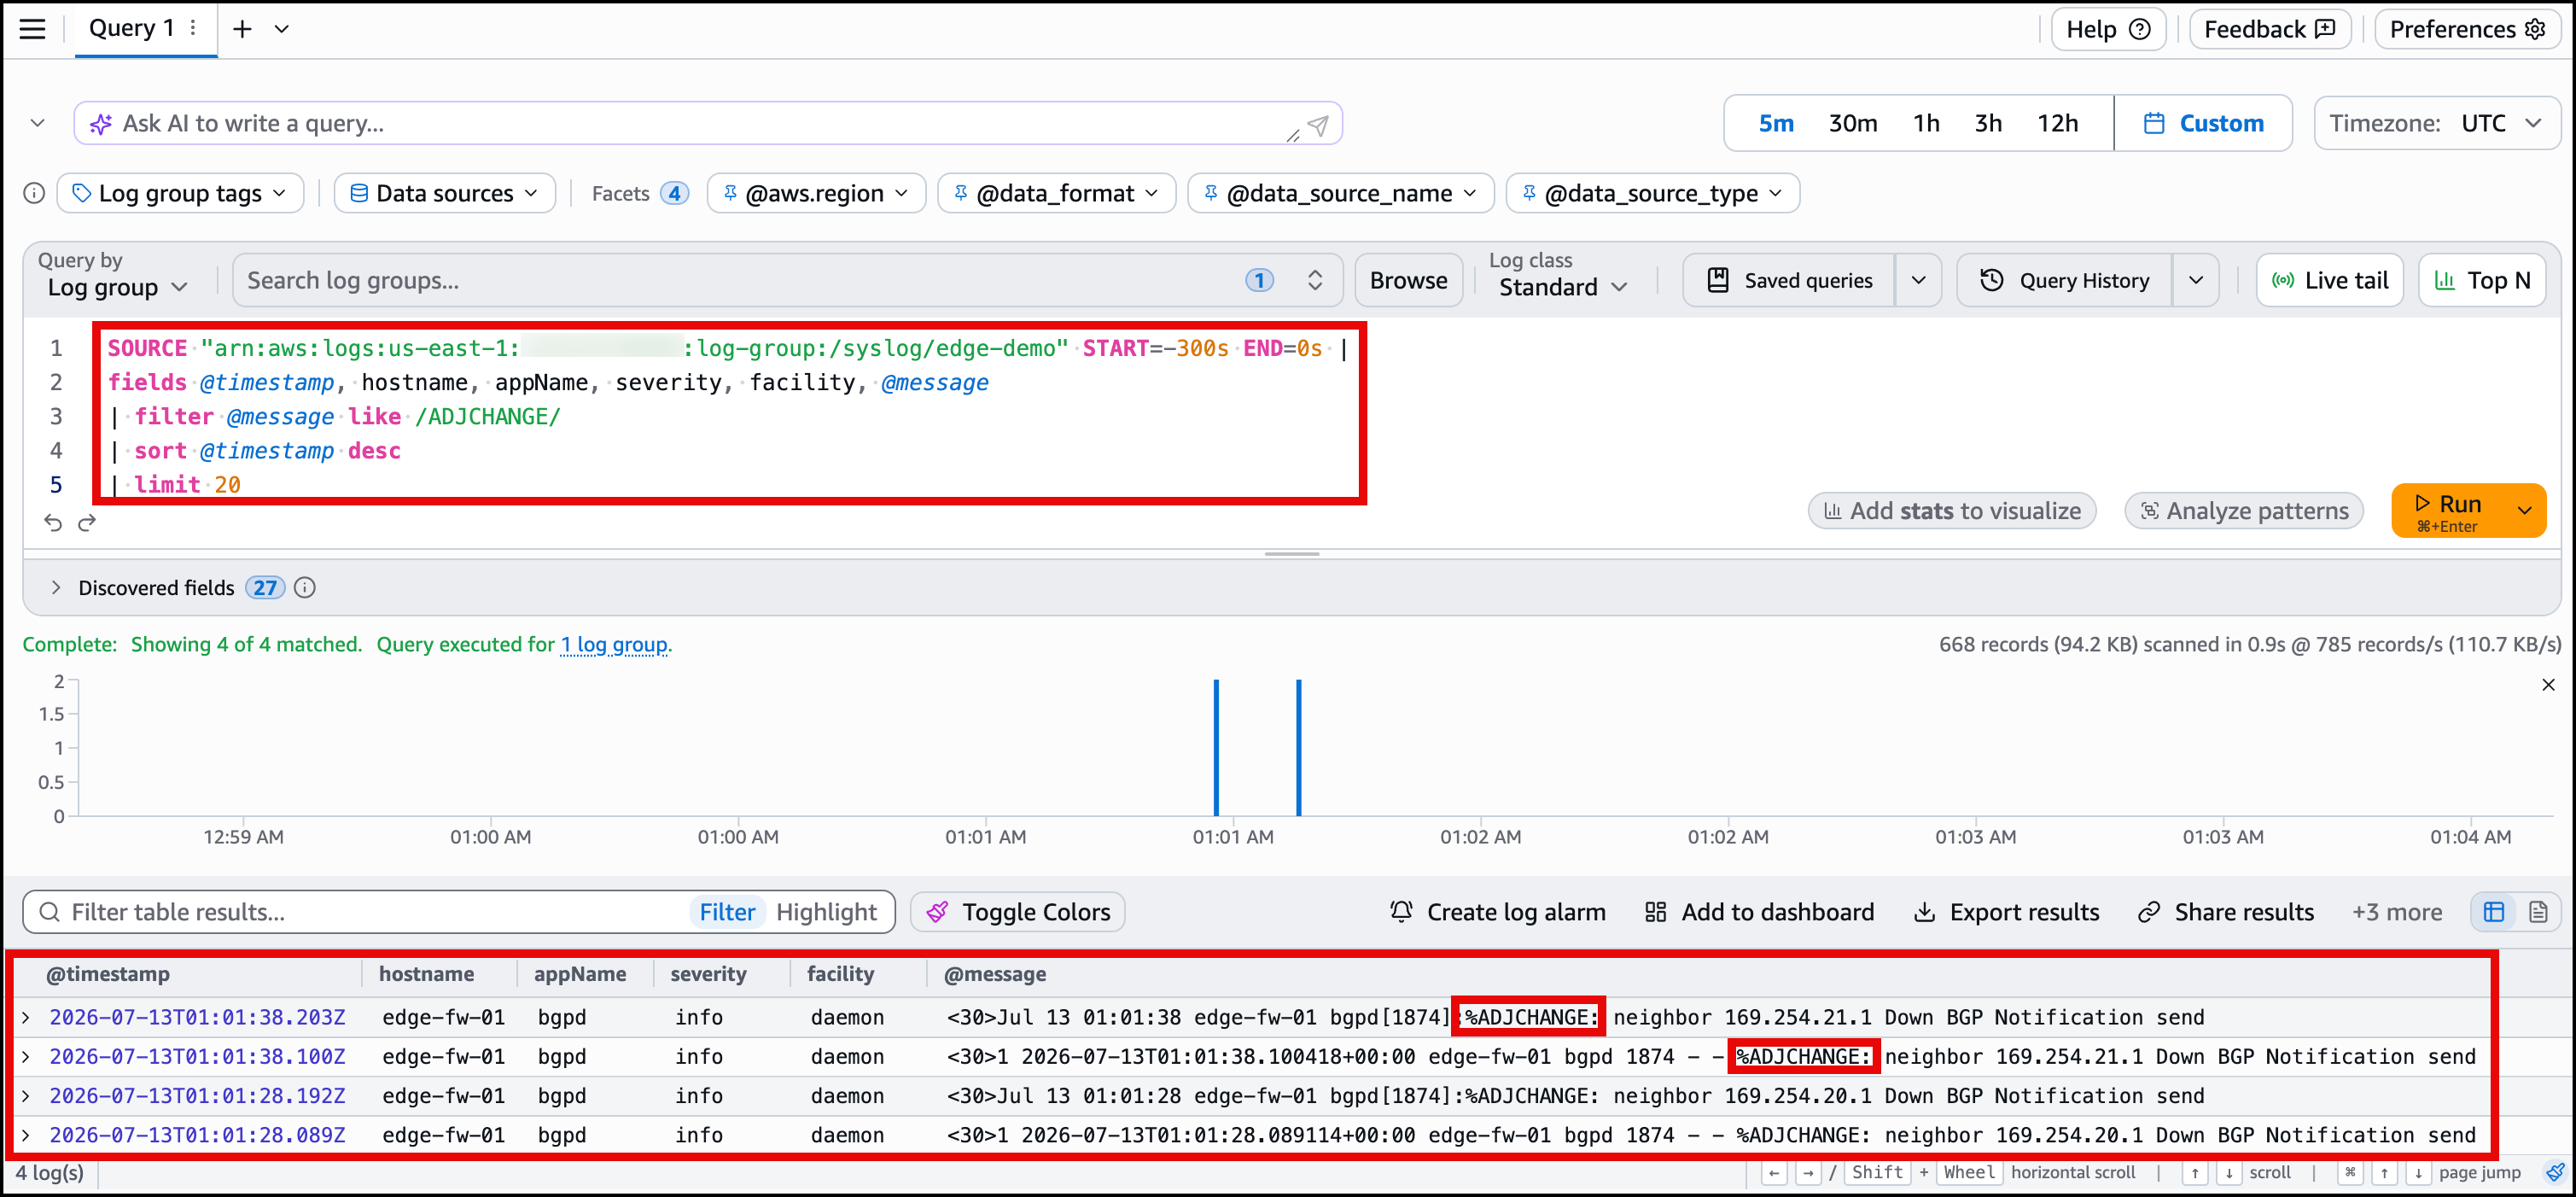
Figure 6. Tunnel-down event with extracted fields.
The service parsed each message on the way in, so these events are already searchable and centralized in CloudWatch. You can filter on fields like severity, hostname, and appName with no collector to run and no parser to write. Next you turn the events that matter into alarms.
C. Alarm on the logs with CloudWatch Log Alarms
We set alarm on the two events with a pair of CloudWatch Log Alarms. Each runs a scheduled Logs Analytics query on /syslog/edge-demo and moves to ALARM when its count crosses a threshold. We create the following two alarms.
- A deny alarm named
EdgeSyslog-DenyLogAlarm. Its scheduled query lists the firewall deny messages, and the alarm counts the matches, entering ALARM when it sees at least one in a five-minute period.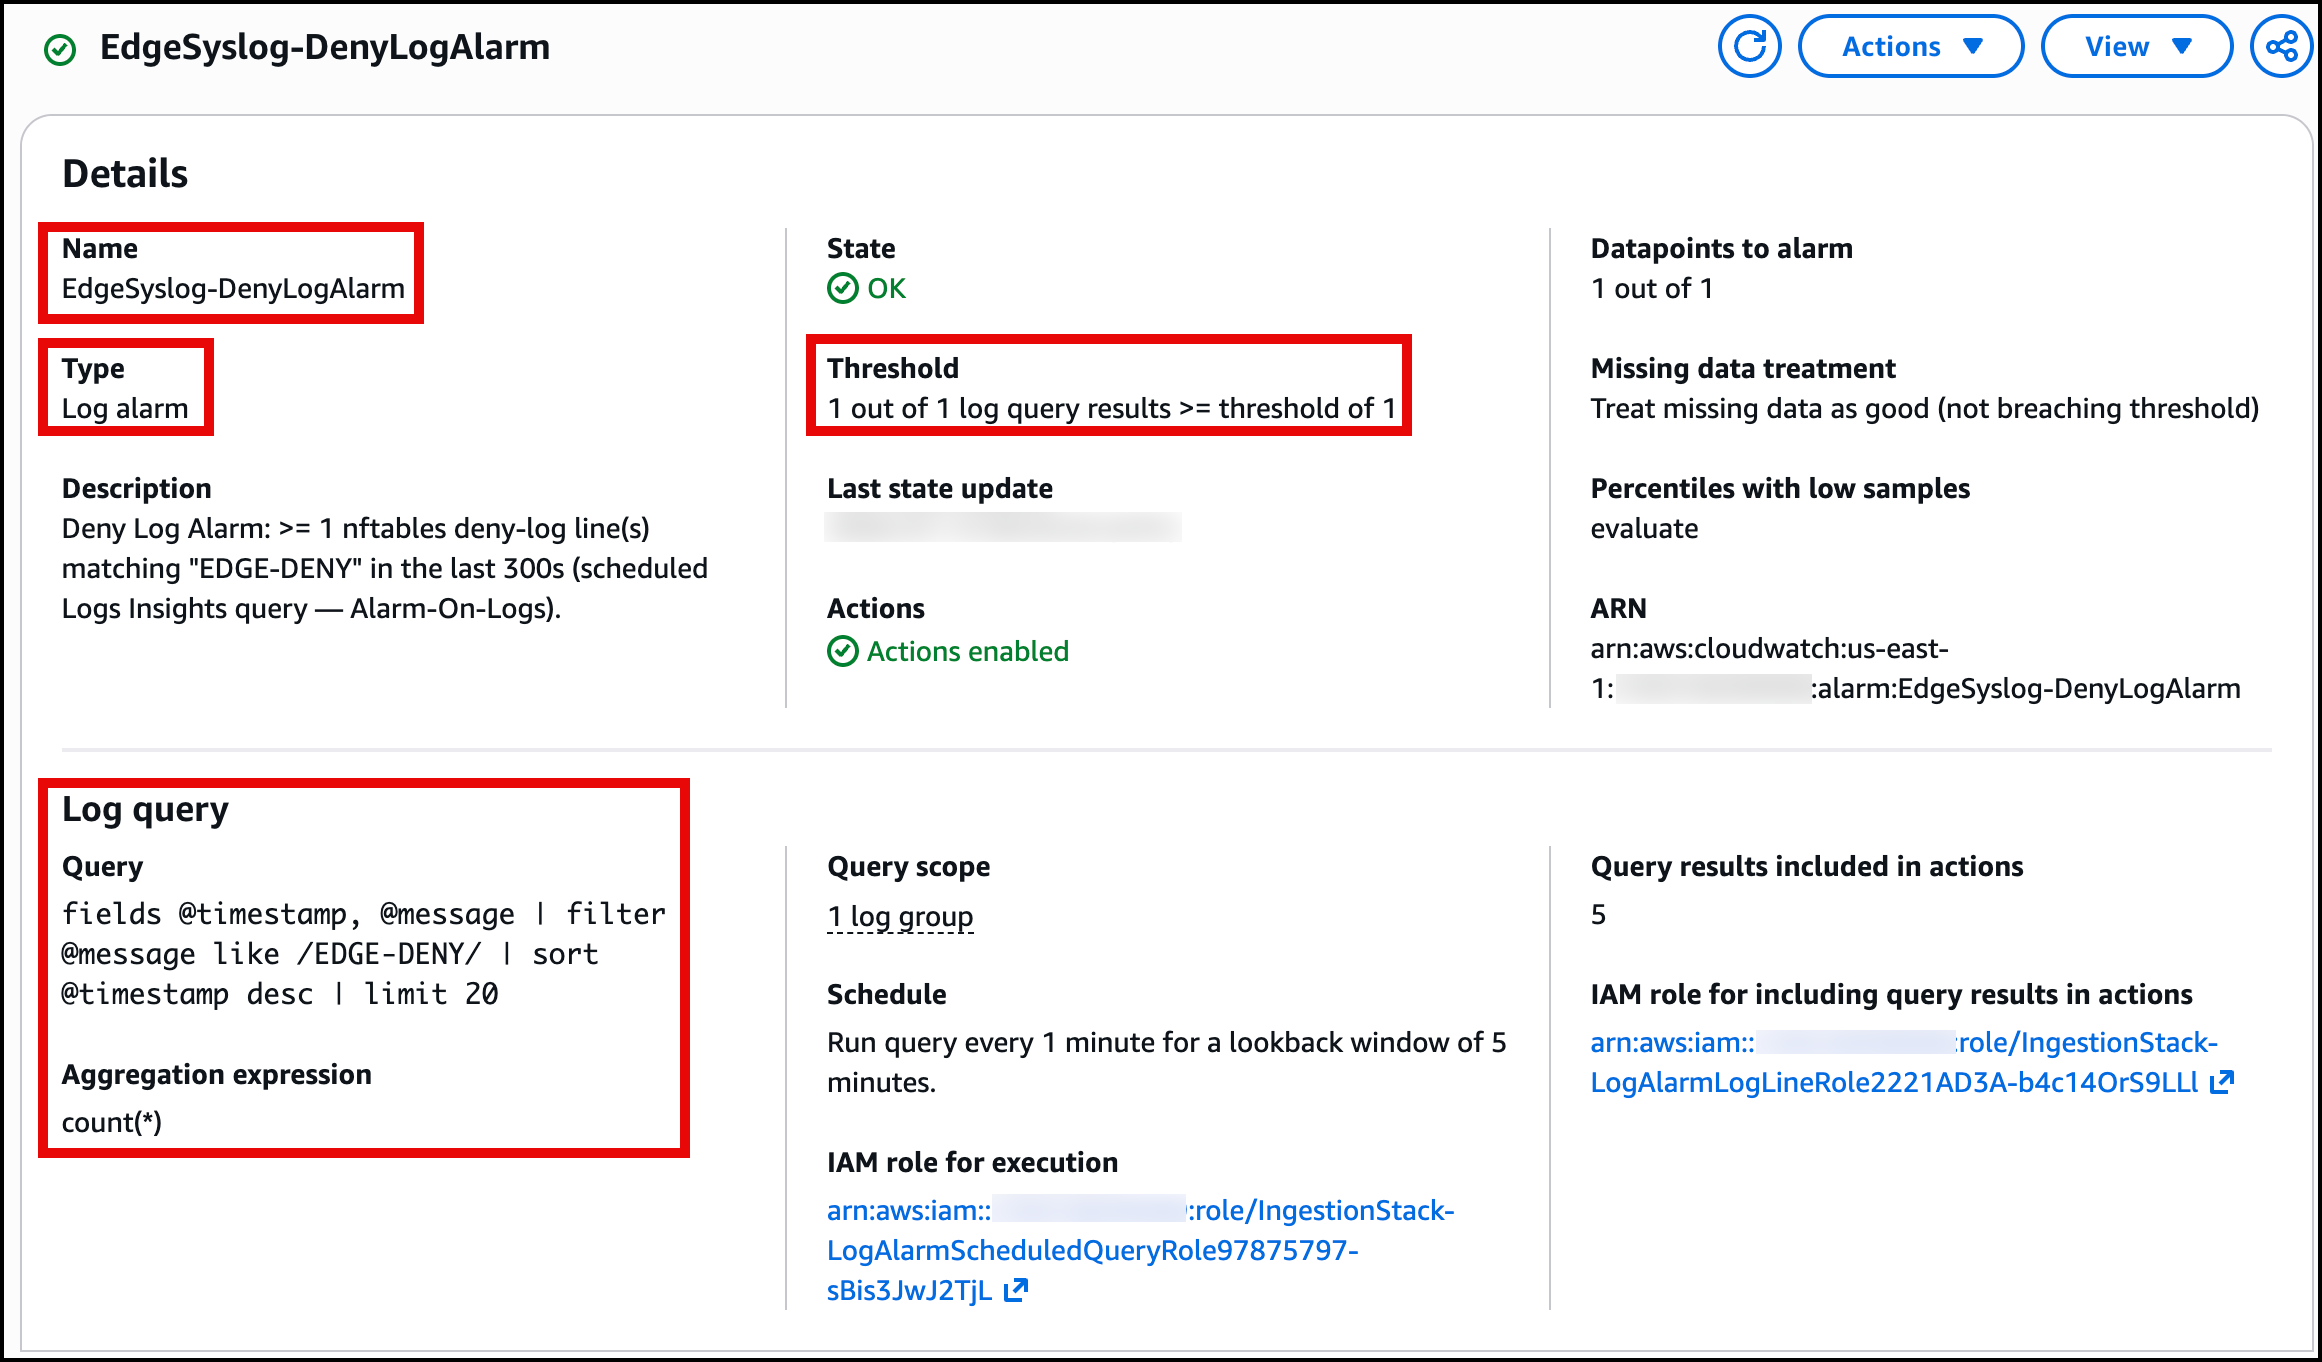
Figure 7. EdgeSyslog-DenyLogAlarm in ALARM state. - A tunnel-down alarm named
EdgeSyslog-VpnDownLogAlarm. Its query lists the%ADJCHANGElines the router logs when a BGP neighbor changes state, which happens on a real tunnel loss rather than a routine IPsec rekey. The alarm counts these matches with the same one in five minutes threshold.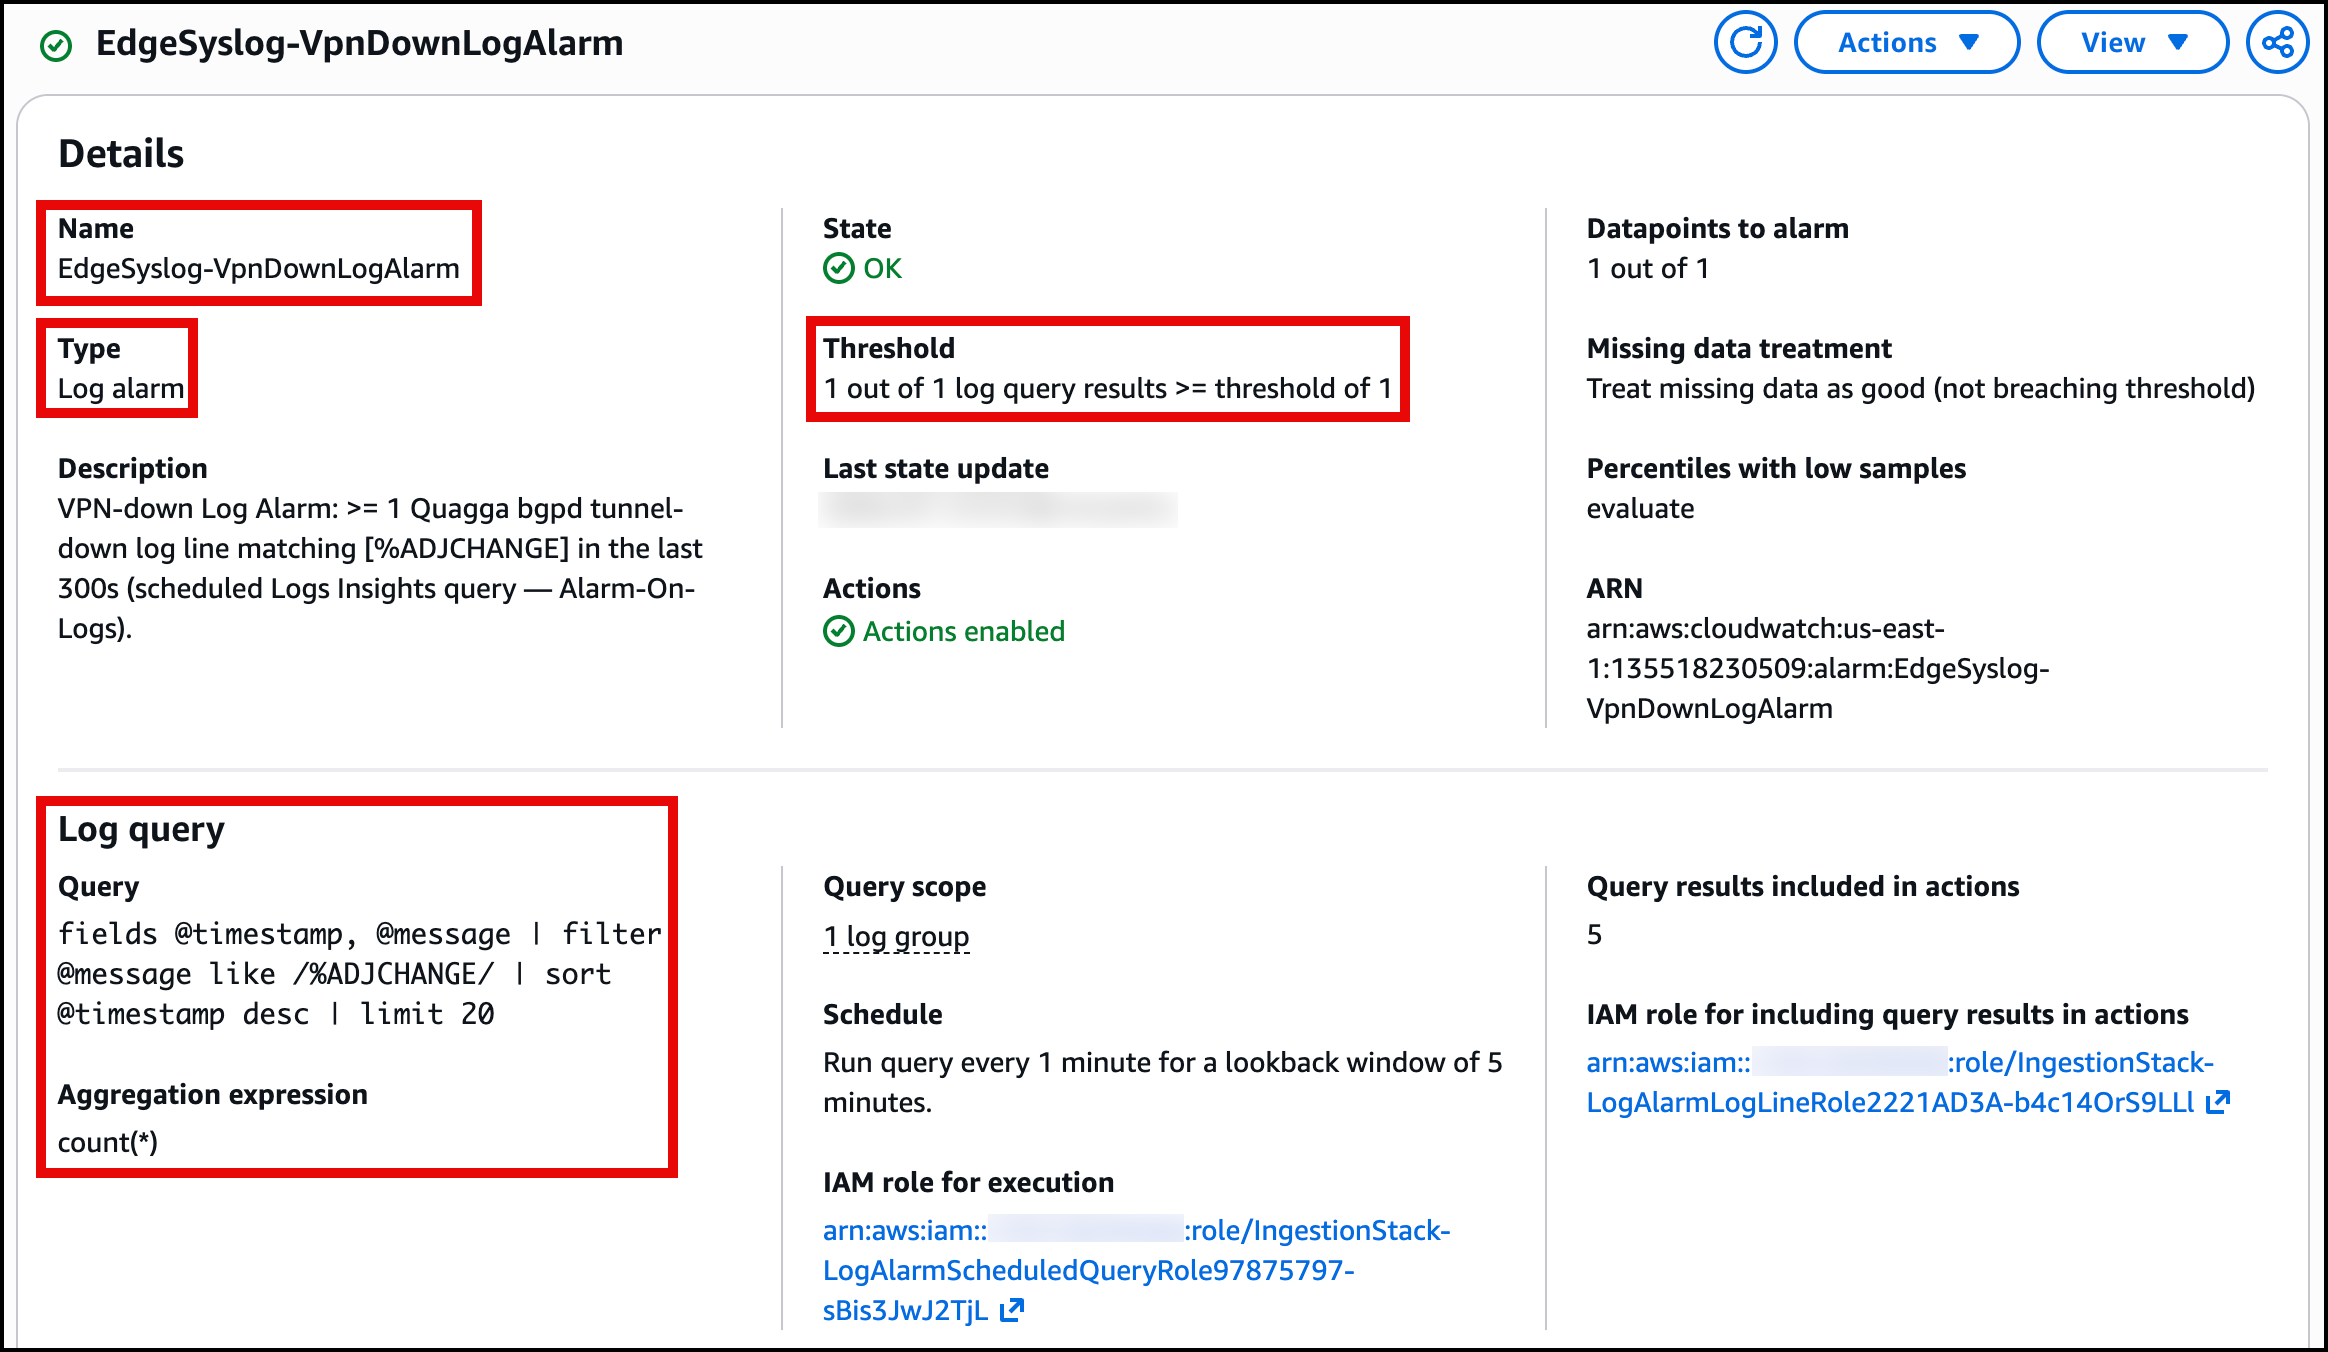
Figure 8. EdgeSyslog-VpnDownLogAlarm in ALARM state.
Neither alarm uses a metric filter. Each one reads the log text directly through its query. For the detailed steps to create a Log Alarm, see Alarming on logs.
D. Route the alarms to the AWS DevOps Agent
This post does not cover setting up the AWS DevOps Agent. Create an Agent Space by following Getting started with AWS DevOps Agent, then add an inbound webhook and note its URL and HMAC signing secret, as described in Invoking DevOps Agent through Webhook. A Log Alarm cannot call that webhook on its own, so we connect the two with the following.
- An Amazon SNS topic named
edge-network-alarms, with both Log Alarms set to publish to it when they enter theALARMstate. A Log Alarm can publish to SNS, which fans the notification out to its subscribers. - A Lambda function subscribed to the topic. The webhook authenticates each request with an HMAC signature over the timestamp and payload, which a raw SNS notification does not carry. The function reads the webhook URL and signing secret from AWS Secrets Manager, signs the event, and posts it to the webhook.
When an alarm enters ALARM state, it publishes to the topic. SNS invokes the function, which posts a signed request to the agent’s webhook.
The AWS DevOps Agent already acts on CloudWatch signals and on third-party observability sources. These Log Alarms are CloudWatch alarms like any other, so a firewall deny or a tunnel down triggers the investigation alongside your existing CloudWatch telemetry. When an alarm fires, the agent reads the log group behind it and correlates the device messages with the affected application, then returns a likely root cause and mitigation steps. It does this from the logs the device pushed, with no access to the device.
The deny alarm starts the first investigation, shown in Figure 9. The agent reads the log group behind the alarm and traces the EDGE-DENY messages to an nftables drop rule that an operator added on edge-fw-01. It reports that rule as the root cause and notes it was a deliberate change rather than a fault or attack.
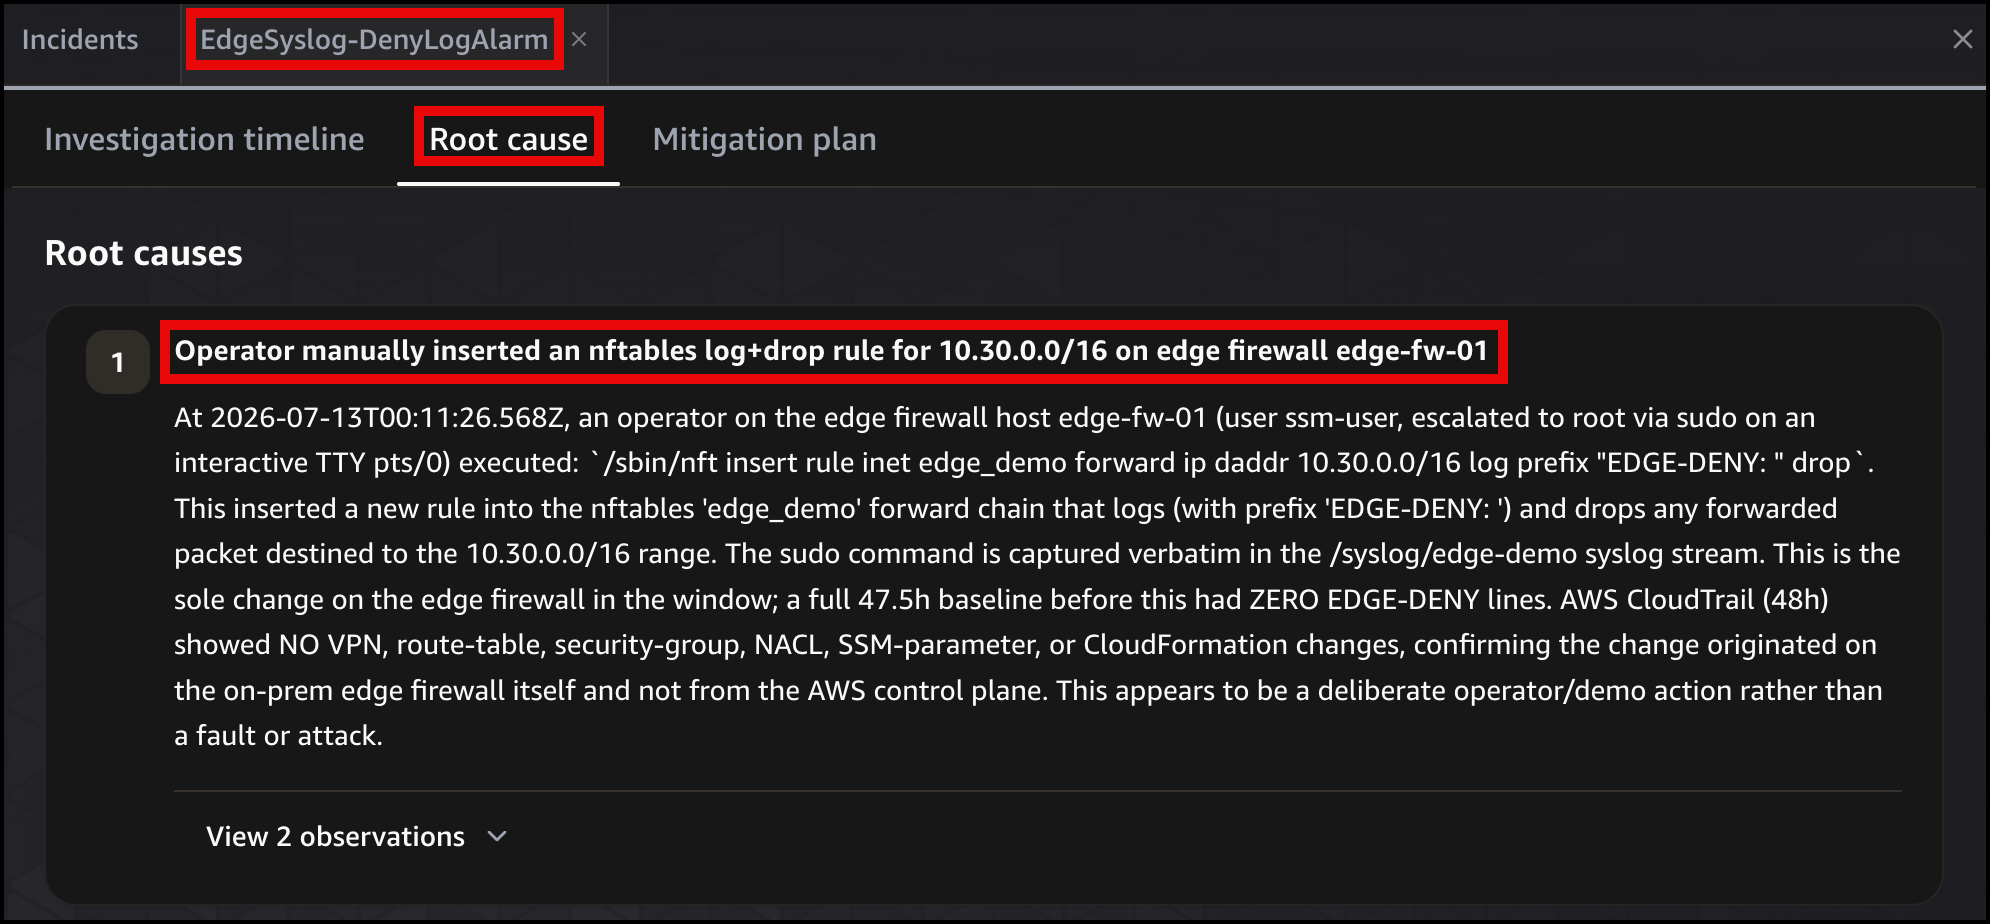
Figure 9. DevOps Agent investigation of firewall deny alarm.
The tunnel-down alarm starts the second investigation, shown in Figure 10. The %ADJCHANGE messages fire the alarm. The agent reads the log group behind it and traces the drop to a strongSwan command on edge-fw-01 that tore down both tunnels of the second VPN connection, vpn2. It reports that teardown as the root cause and rules out a network fault, since the first connection, vpn1, stayed up and it found no AWS-side change.
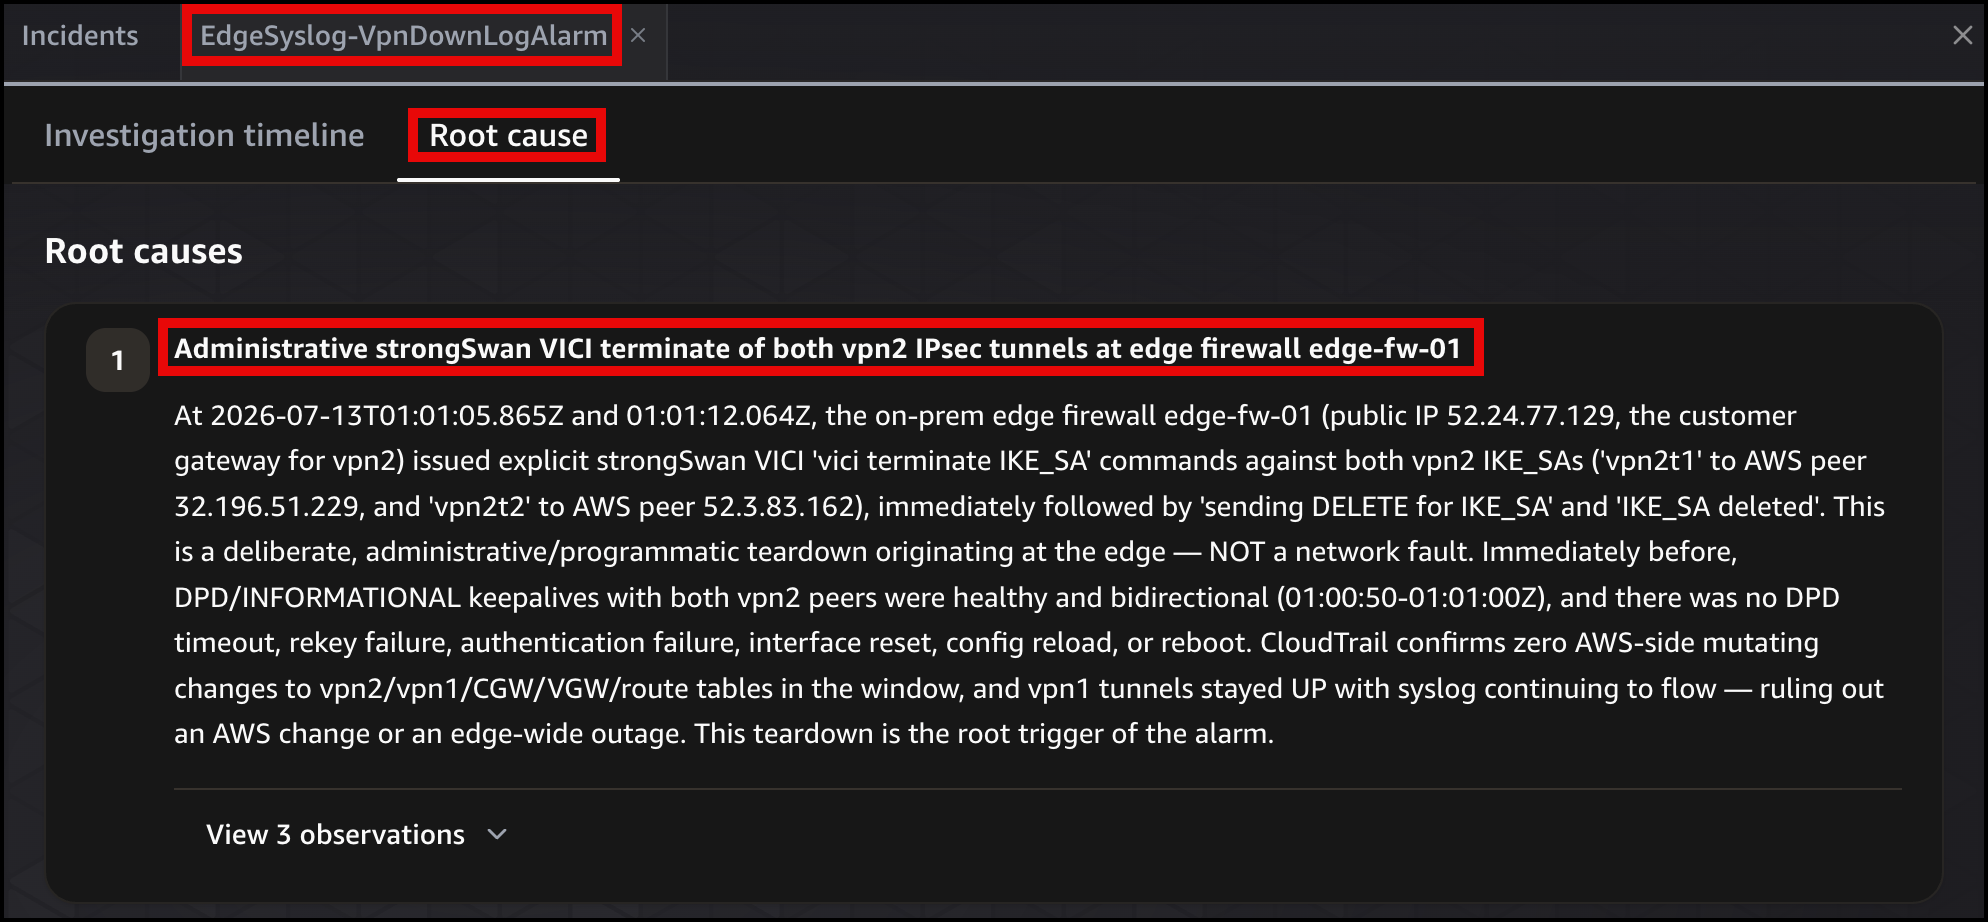
Figure 10. DevOps Agent investigation of tunnel-down alarm.
Operate and troubleshoot
Once the pipeline is running, you confirm delivery with the metrics the service publishes and reach for the troubleshooting guide when messages go missing. Watch the SyslogMessagesReceived and SyslogMessagesDropped metrics to see what arrived and what did not. The Reason dimension on SyslogMessagesDropped shows why messages were dropped so you can act on it. If messages do not arrive, see Troubleshooting syslog ingestion for the full list of checks.
Clean up
To avoid ongoing charges, remove the resources you created, working back from the device to the log group.
- Remove the syslog forwarding rule from the device so it stops sending messages.
- Delete the two Log Alarms.
- Delete the Lambda function and its subscription to the topic.
- Delete the Amazon SNS topic and its subscription.
- Delete the secret you stored in AWS Secrets Manager.
- Delete the syslog configuration on the log group.
- Delete the syslog VPC endpoint.
- Delete the log group.
Conclusion
You brought on-premises firewall syslog into Amazon CloudWatch with managed syslog ingestion. From there you queried the extracted fields in CloudWatch Logs Analytics and turned the events that matter into CloudWatch Log Alarms, with no metric filter in between. Routing the alarms to the AWS DevOps Agent then lets it investigate a device failure from the logs the device pushed. The searchable logs and the alarms stand on their own even before you add the agent. You can apply the same pattern to any syslog source and add more Log Alarms as you learn which messages predict real incidents.
Getting started
Try it in your own account. Set up managed syslog ingestion, point a device at the endpoint, and route the alarms to the AWS DevOps Agent so it investigates a failure from the logs your devices are already sending. To learn more, see: