Networking & Content Delivery
Improving video observability with CMCD and CloudFront
Observability is critical for operating any system. It should tell whether the system is functioning correctly, provide insights in user experience, notify when issues occur, and help to locate the root cause. However, building an observable video streaming system can be a challenge for customers as it requires collecting, correlating, and analyzing data from several independent architectural components, such as media player, CDN, Origin, and network. Typically, these components are managed separately and produce their own set of data (i.e., logs and metrics) to be used for observability purposes. CDN represents the server-side of the request flow. It doesn’t have a notion of a session because HTTP is a stateless protocol and even if multiple requests represent the same user session, they don’t carry any kind of identity that can be used to reliably group them together. In the non-video world, content owners use an HTTP cookie for request sessionization. However, video providers hesitate to rely on it for video streaming due to its poor support on some media clients. This makes it difficult to build some content analytics reports out of CDN logs, such as the number of concurrent video sessions and video assets’ popularity, as well as perform troubleshooting on the session level. Similarly, CDN’s metrics, such as its servers’ operational health and their locations, request processing logic, and its results are missed on the client side.
Correlating these independent data sets to get the full visibility of request processing isn’t an easy task as it requires significant compute resources to perform logs correlation from both sides using indirect indications, for example viewer IP address and the request time. You might end up using multiple logs collection and storage systems, dashboards, and alerting mechanisms. This makes it cumbersome to pinpoint problems and identify the root cause of the issue and requires a high level of expertise to do so effectively. What could make it easier is having the data from both server and client-side merged in the same log record, stored in the same place, and used by the same dashboard for visualization, alerting, and data analytics purposes. In this post, we’ll discuss how this can be achieved for video streaming by using Common Media Client Data (CMCD) specification and Amazon CloudFront.
What is CMCD?
CMCD has been developed by Web Application Video Ecosystem (WAVE) project hosted by the Consumer Technology Association (CTA). It specifies how media players can convey Quality of Experience (QoE) client-side metrics with each request, as a custom HTTP request header, as an HTTP query argument, or as a JSON object. The CMCD specification containing the full list of metrics can be found here.
CMCD metrics enable customers to achieve various tasks, for example:
- Session ID (sid) identifies the current playback session and allows thousands of individual server log lines to be interpreted as a single user session and to build reports on a session level. It can also be used for troubleshooting purposes. If there is a video session suffering from rebuffering, then Session ID helps quickly find individual requests belonging to that session and provide them to Support for investigation.
- Buffer starvation (bs) signals that the player is in the rebuffering state and the video or audio playback were stalled right before sending the request. It indicates an issue to be addressed. By checking the corresponding server-side metrics, we can verify the operational health of the CDN server and see whether the issue is related to the server, or if the root cause resides elsewhere, for example, in specific network segment or Origin.
- Buffer length (bl), Measured throughput (mtp), Encoded bitrate (br), and Top bitrate (tb) allow monitoring of the quality of user experience and tell us how happy the viewers are. For example, you can monitor which throughput is available for your viewers in different Geo locations and plan your content encoding profile accordingly. Top bitrate flags the best quality bitrate available for viewers, while Encoded bitrate is the actual used bitrate. In an ideal scenario they should be the same and, if not, then the QoE isn’t at its best. You can even work out a formula for an overall QoE score out of these metrics and use it for benchmarking CDNs.
- Content ID (cid), Object duration (d), Playback rate (pr), Streaming format (sf), and Stream type (st) can be used in content analytics to measure its popularity and engagement time, as well as view it by various dimensions including Geo location, client device type, and time of the day.
Once CDN served the request, the full query string and all headers containing these metrics are written into a CDN log record where they become available for data analytics purposes all together with corresponding Quality of Service (QoS) server-side metrics. CMCD must be implemented by media players, most of which already support client-side metrics sending by an API to a video analytics system so that they don’t need to develop CMCD support from scratch. Instead, they extend existing functionality to the metrics being included in the HTTP request as well. You can check if your player vendor already implemented or planned to implement CMCD. To examine how requests with CMCD look, in this post we use an open-source HLS.js player that has already added CMCD support. However, any CMCD-based solution should be player-agnostic, and using another or adding a new player into it should be seamless as long as players adhere to CMCD specifications.
To enable CMCD on HLS.js, we must add the cmcd: true parameter in its config. We can also specify contentId to allow for content-specific statistics and sessionId, or let HLS.js generate the latter one automatically. By default, the player will convey CMCD in the query string. Alternatively, it can use headers, but since any custom header triggers the preflight OPTIONS request, it increases the request rate and consequently the CloudFront cost, as well as latency. Therefore, this approach isn’t recommended, unless there are specific requirements for doing it this way.
Once CMCD is enabled, the full URL looks like the following:
https://drgt2mhriu0nm.cloudfront.net/video/hls/ocean/ocean_Ott_Hls_Ts_Avc_Aac_16x9_1920x1080p_30Hz_8500Kbps_00012.ts?CMCD=bl%3D29900%2Cbr%3D8934%2Cd%3D3000%2Cmtp%3D108400%2Cot%3Dav%2Csf%3Dh%2Csid%3D%221a8cf818-9855-4446-928f-19d47212edac%22%2Ctb%3D8934
As seen in the example, the CMCD query argument starts with the CMCD keyword and contains the URL encoded concatenation of key-value pairs. If we decode it, then we can see CMCD parameters as per the specification:
bl=29900,br=8934,d=3000,mtp=108400,ot=av,sf=h,sid=”1a8cf818-9855-4446-928f-19d47212edac”,tb=8934
The query string goes to the field cs-uri-query in CloudFront logs, so the next step is a matter of extracting CMCD from there and using it.
Two CloudFront logging options
CloudFront provides two different kinds of logging:
- Standard logs are delivered to the Amazon Simple Storage Service (Amazon S3) bucket of your choice within minutes of request completion.
- Real-time logs are delivered to the data stream of your choice in Amazon Kinesis Data Streams within seconds of request completion.
Let’s review these option differences in more detail.
Cost
CloudFront doesn’t charge you for standard logs, though you incur Amazon S3 charges for storing and accessing the log files.
Real-time logs are charged based on the number of generated log lines, in addition to the charges you incur for using Kinesis Data Streams. Although real-time logs look like a more expensive feature, it’s configurable, which can help optimize its cost. You can choose:
- The sampling rate for your real-time logs—the percentage of requests for which you want to receive real-time log records.
- The specific fields that you want to receive in the log records.
- The specific cache behaviors (path patterns) for which you want to receive real-time logs. This lets you use real-time logs only for cache behavior created for video delivery, thereby reducing the amount of logs for processing and storing.
Standard logs aren’t configurable, and they’re enabled on the entire distribution.
CMCD in CloudFront Real-time logs
Real-time logs now support each CMCD metric as a distinct log field. You can select to include all CMCD fields in your Real-time logs or only specific fields needed for your client-side performance analysis. When your media clients send the CMCD metrics in the request, CloudFront automatically extracts the key-value pairs from the headers or the query string, and deliver the parameters to your Real-time logs. This integration significantly optimizes data processing, eliminating the need for searching and extraction of CMCD key-value pairs from headers or query strings, thereby reducing compute resources.
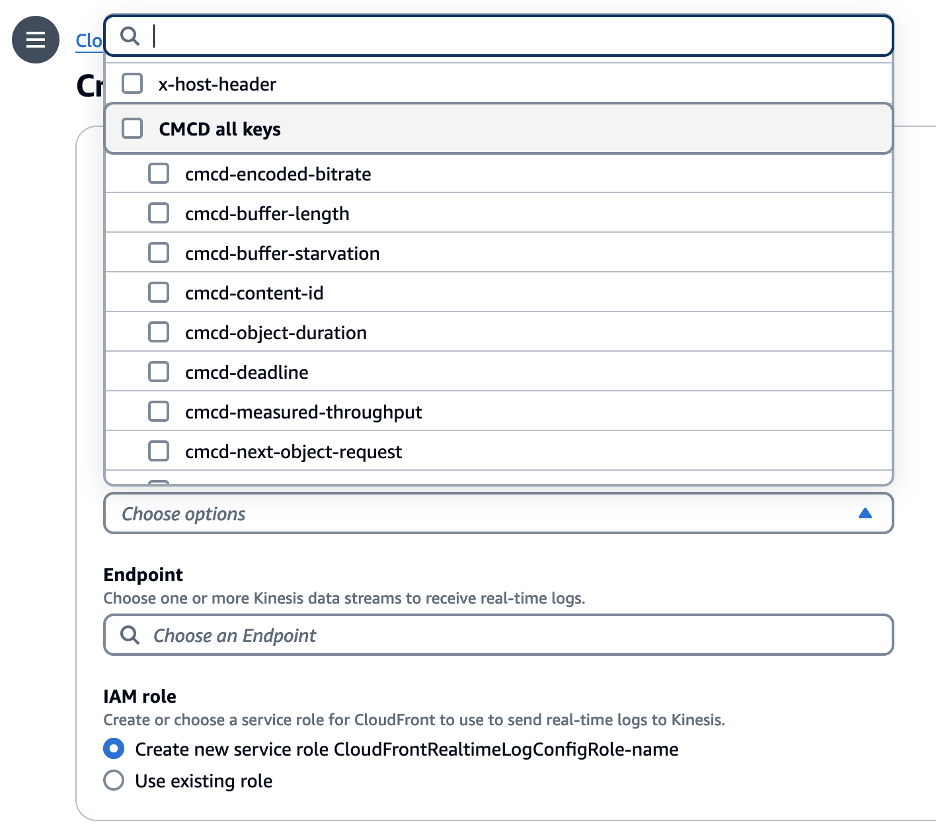
Figure 1 – CloudFront CMCD Real Time Log
Other log fields
Real-time logs encompass all fields from standard logs, along with additional ones. In addition to CMCD fields, real-time logs have c-ip-version (IPv4 or IPv6), c-ip-version (IPv4 or IPv6), cache-behavior-path-pattern (the path pattern that identifies the cache behavior), cs-accept-encoding (the value of the Accept-Encoding header), and cs-accept (the value of the Accept header). Recently, three new log fields have been added in real-time logs: Origin first-byte latency, Origin last-byte latency, and autonomous system number (ASN), which increases performance visibility of both Origin and network. Additionally, real-time logs contain cs-headers (HTTP headers (names and values) in the viewer request) field that is missing in standard logs. This means that if you intend to use CMCD in headers, then real-time logs is the only option. The presence of headers in the logs also enables you to log CloudFront headers. These headers can enrich the logs with the information about the viewer’s device type and geographic location, and serve as additional dimensions in data analysis.
Logs destinations
Customers can download standard logs from Amazon S3 and use their analytics tools to process them. Another way to analyze standard logs is to use Amazon Athena.
To analyze real-time logs, customers can setup their applications to consume data from Kinesis Data Stream output. An application can be an AWS Lambda function, Amazon Kinesis Data Firehose, Amazon Kinesis Data Analytics, or a custom application using Kinesis Client Library. Alternatively, you may use another service from Kinesis family – Kinesis Firehose, a fully-managed service that can deliver data to several pre-integrated destinations, including OpenSearch, Datadog, Splunk, New Relic, and Sumo Logic. If you already use a data analytics system, then you can check if it’s already supported by Kinesis Firehose and use that option. Kinesis Data Firehose can invoke your Lambda function to transform incoming CloudFront logs and deliver the transformed data to the destination. It enables you to parse and extract CMCD metrics from the cs-uri-query field on the fly and create a new field for each parameter, thereby making it easier for the analytics system to build reports.
The following diagram summarizes the CloudFront logging options:
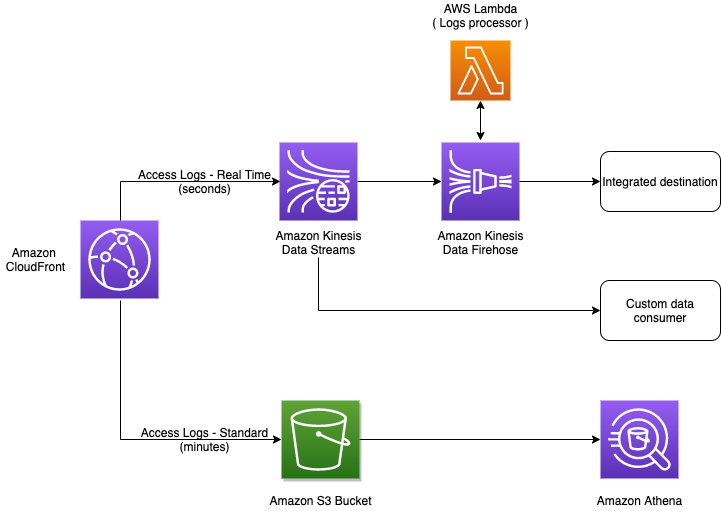
Figure 2 – CloudFront logging options
After you choose and implement your logs delivery pipeline, you can start implementing observability, i.e., creating dashboards, reports, and alarms.
We have published a post of how to configure the delivery of CloudFront real-time logs to Amazon OpenSearch Service, which can help you learn how to enable logging and setup Kinesis Data Stream. It also includes a Lambda function that can serve as a baseline to create your own logs transformation and enrichment. In this post, we provide another solution based on managed and serverless services – Amazon Managed Grafana and Amazon Timestream.
Real-time dashboard for CloudFront logs enriched by CMCD
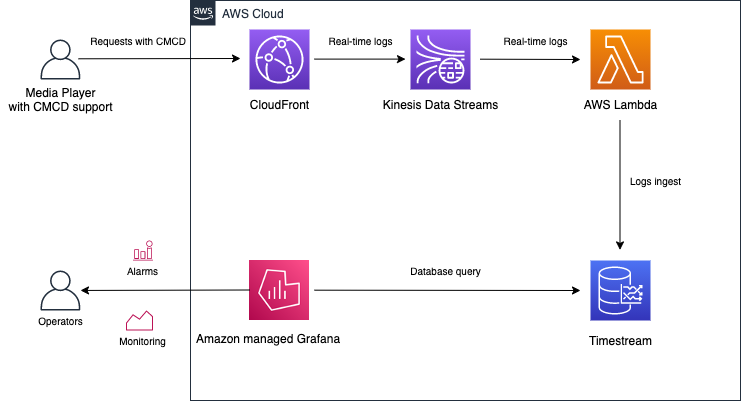
Figure 3 – Grafana dashboard for CloudFront logs
In the solution, we use CloudFront real-time logs enriched by CMCD metrics carried in the query string. The AWS Lambda function is attached to the output of Kinesis Data Stream. It parses the logs and extracts CMCD from the query string to build new fields out of it. After that, Lambda inserts the data into Timestream database. Amazon Grafana is used to visualize the data stored in the database.
Having a rich and powerful set of data lets you create endless variants of its representation in a dashboard. Furthermore, there’s no way to create a single version that will fit every possible customer need. In this post, we provide a sample that can be adapted for your own needs. For example, you can remove the charts that aren’t important for you and add those that are missing but helpful. To install the solution, you can clone it from the Github repository and follow the installation instructions in the Readme.
According to the best practices for creating a dashboard in Grafana, the first question to answer when architecting a dashboard is: what story does it tell, or what is its goal? The dashboard must also reduce cognitive load, not add to it: how hard do you need to think about something in order to figure it out? In addition, we must make sure that we pay for only what we need, which in particular means reducing the number of queries to the Timestream databases used as a data source for the dashboard. With this in mind, the proposed solution includes two dashboards used for different purposes and possibly, by different users:
QoE dashboard provides QoE and business insights, including the rebuffering ratio, number of concurrent plays, average plays duration, measured throughput, buffer length, and bytes transferred. It can be used to monitor QoE by various dimensions, such as Country, ASN, Device type (Mobile, SmartTV, Desktop), Streaming format (HLS, DASH), or CloudFront distribution.
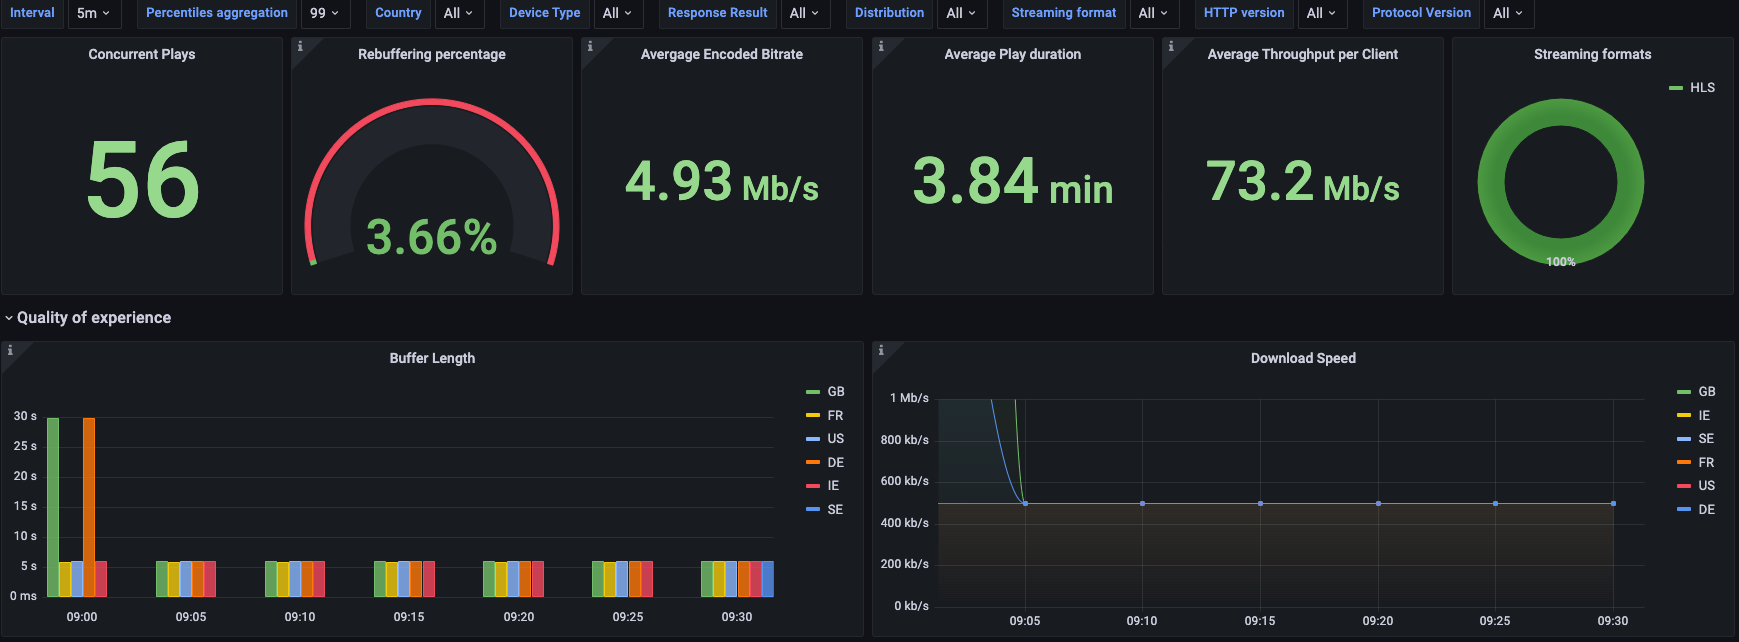
Figure 4 – QoE dashboard example
Troubleshooting dashboard helps monitor QoE issues as well as aids in troubleshooting once the issues occur. It contains the Rebuffering Ratio chart that measures the percentage of rebuffering on a video session level. This chart can be used to setup an alarm once the rebuffering ratio percentage is above its normal value. The alarm should trigger troubleshooting to find the root cause and to aid with this, the dashboard provides an excerpt from CloudFront logs for the requests that were served prior to the buffer starvation signal. This data can be used to open a support ticket for CloudFront performance investigation.
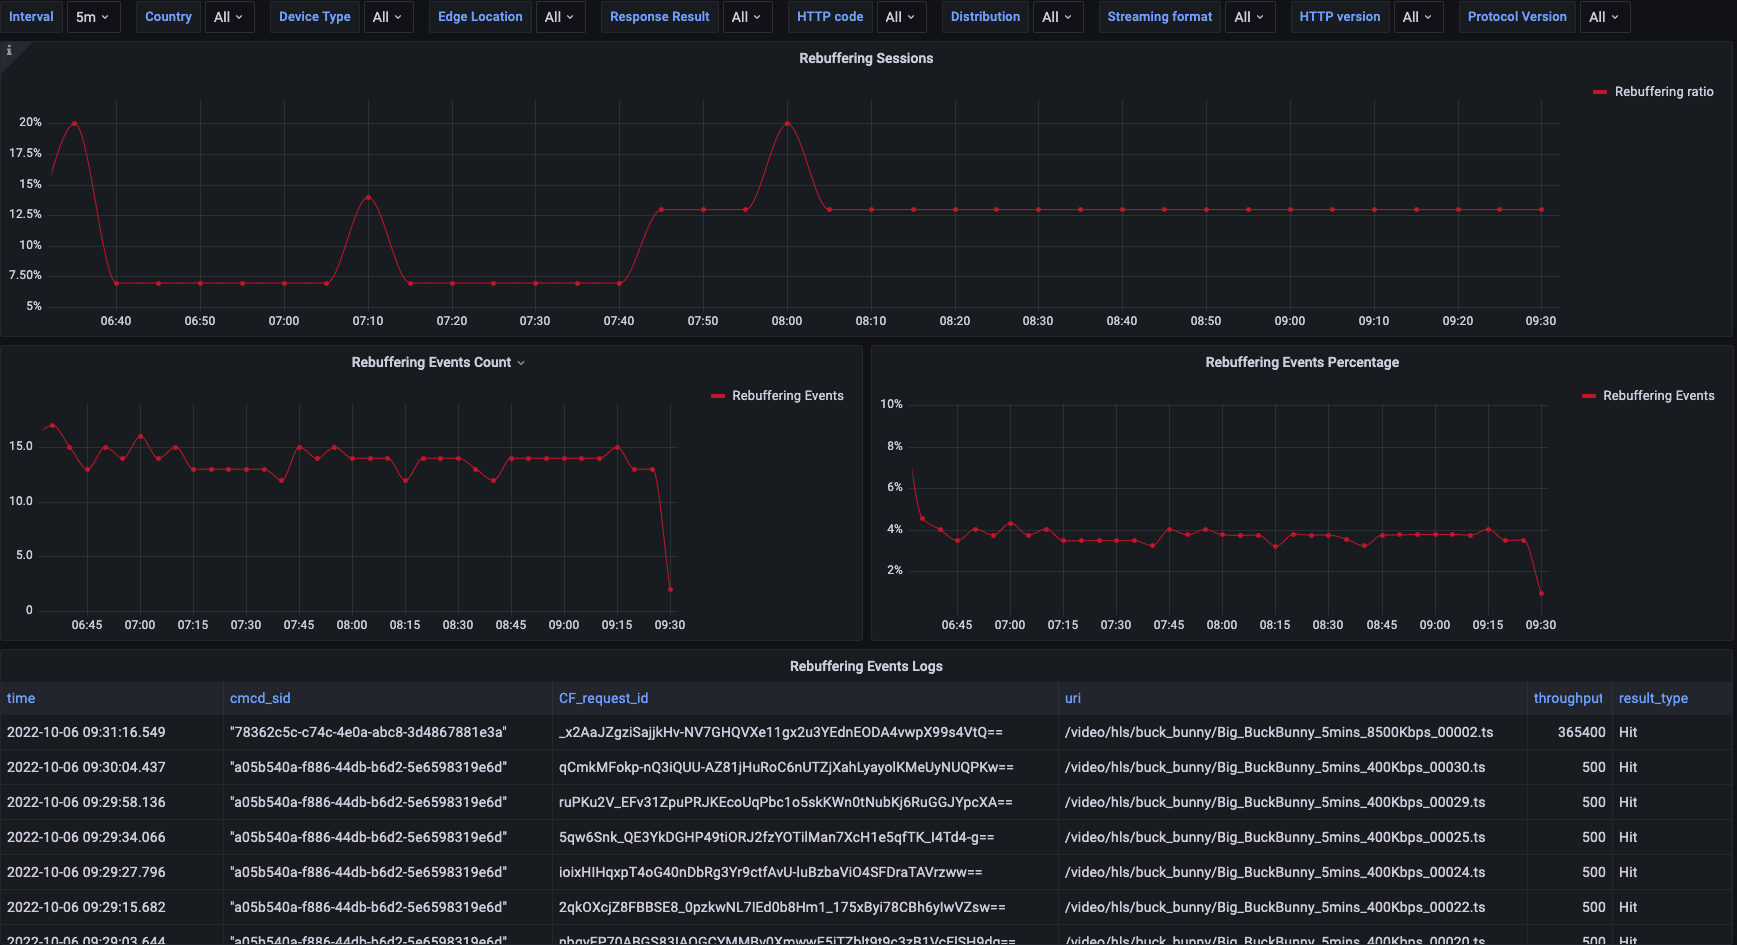
Figure 5 – Troubleshooting dashboard example
Conclusion
CMCD benefits include the ability to build a custom QoE observability tailored for your specific needs and make the root cause analysis easier. In this post, we overviewed the CMCD specification and how it can be used with CloudFront. We also provided a sample of a Grafana dashboard built out of CloudFront logs enriched by CMCD. This sample includes the test clients that generate the logs, and enable you to get familiar with the capabilities of CMCD, as well as to experiment with building new insights using this data.

Yury Yakubov
Yury is an Edge Specialist Solutions Architect. He has over fifteen years of content delivery industry experience, with a focus on media streaming, observability and performance. He is passionate about helping customers build effective solutions for complex tasks. Outside of the work, he can be found spending time with his family, reading books or playing old video games.