Networking & Content Delivery
Creating realtime dashboards using Amazon CloudFront logs
September 8, 2021: Amazon Elasticsearch Service has been renamed to Amazon OpenSearch Service. See details.
Creating real time dashboards using Amazon CloudFront logs
Amazon CloudFront is a content delivery network (CDN) that securely delivers static and dynamic web content with low latency and high transfer speeds using a global network of edge locations. Today, CloudFront announced a new feature that delivers logs, which are more detailed, configurable, and available in real time. The CloudFront real-time logs contain detailed information about every request that CloudFront receives. Having more detail in real time enables you to respond quickly to operational events.
With real-time logs, you can customize the information collected and where it gets delivered. The real-time logs are integrated with Amazon Kinesis Data Streams to enable delivery of these logs to a generic HTTP endpoint using Amazon Kinesis Data Firehose. Amazon Kinesis Data Firehose can deliver logs to Amazon S3, Amazon Redshift, Amazon Elasticsearch Service (Amazon ES), and service providers like Datadog, Datazoom, New Relic, and Splunk. Using these logs, you can create real-time dashboards, set up alerts, and investigate anomalies or respond to operational events quickly. Common data points that can be tracked include the number of viewer requests originating from different geographical regions and the number of unique viewers experiencing increased latency.
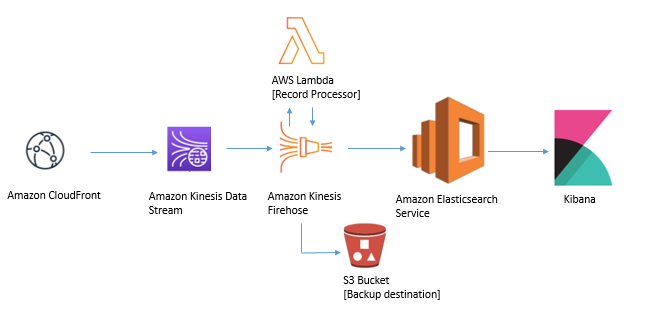
In this blog, you will learn how to create an operational dashboard using CloudFront real-time logs and Amazon Elasticsearch Service (Amazon ES). This architecture will show you how to configure Kinesis Data Firehose as the Kinesis Data Stream consumer, use a Lambda function within Kinesis Firehose to process logs, and update the log format. You will also be shown how to configure an S3 bucket as a backup destination for a scenario where Kinesis Firehose is unable to deliver the data to Elasticsearch. Afterwards, authorized users can login to the Kibana interface to build dashboards from the real-time logs to address live operational issues.
You can follow these steps to set up this log pipeline:
Step 1: Provisioning Kinesis Data Stream
1) Navigate to the Amazon Kinesis console on a Region of your choosing, choose Data streams and click Create data stream:

2) On the next page, name the stream cloudfront-real-time-log-data-stream and change the Number of open shards to 200. You can provision up to 500 open shards which is the maximum default limit per account.

 3) Click Create Data Stream.
4) After provisioning the data stream, you can choose to increase the Data retention period setting based on your needs. The default is 24 hours and this can be increased to 168 hours. There is also the option to enable Enhanced (shard-level) metrics.
Step 2: Enable real-time logs on CloudFront distribution


Step 3: Provisioning the Lambda function to process records in Kinesis Firehose before delivering to Elasticsearch
1) Navigate to the AWS Lambda Console and Click ‘Create function’.
2) Choose ‘Author from scratch’.
3) In the Basic information section:
a) Use cf-real-time-logs-transformer as Function name.
b) Choose Python 3.8 as Runtime.
4) In the Permissions section:
a) Choose Create a new role with basic Lambda permissions as the Execution role.
5) Click Create function.

6) The above step creates the Lambda function and opens the Configuration tab for the function.

7) Under the Function code section, replace the default generated code with the following code:
    import base64
    import json

    print('Loading function')


    def lambda_handler(event, context):
        output = []

        # Based on the fields chosen during the creation of the
        # Real-time log configuration.
        # The order is important and please adjust the function if you have removed
        # certain default fields from the configuration.
        realtimelog_fields_dict = {
        "timestamp" : "float",
        "c-ip" : "str",
        "time-to-first-byte" : "float",
        "sc-status" : "int",
        "sc-bytes" : "int",
        "cs-method" : "str",
        "cs-protocol" : "str",
        "cs-host" : "str",
        "cs-uri-stem" : "str",
        "cs-bytes" : "int",
        "x-edge-location" : "str",
        "x-edge-request-id" : "str",
        "x-host-header" : "str",
        "time-taken" : "float",
        "cs-protocol-version" : "str",
        "c-ip-version" : "str",
        "cs-user-agent" : "str",
        "cs-referer" : "str",
        "cs-cookie" : "str",
        "cs-uri-query" : "str",
        "x-edge-response-result-type" : "str",
        "x-forwarded-for" : "str",
        "ssl-protocol" : "str",
        "ssl-cipher" : "str",
        "x-edge-result-type" : "str",
        "fle-encrypted-fields": "str",
        "fle-status" : "str",
        "sc-content-type" : "str",
        "sc-content-len" : "int",
        "sc-range-start" : "int",
        "sc-range-end" : "int",
        "c-port" : "int",
        "x-edge-detailed-result-type" : "str",
        "c-country" : "str",
        "cs-accept-encoding" : "str",
        "cs-accept" : "str",
        "cache-behavior-path-pattern" : "str",
        "cs-headers" : "str",
        "cs-header-names" : "str",
        "cs-headers-count" : "int"
        }

        for record in event['records']:

            # Extracting the record data in bytes and base64 decoding it
            payload_in_bytes = base64.b64decode(record['data'])

            # Converting the bytes payload to string
            payload = "".join(map(chr, payload_in_bytes))

            # dictionary where all the field and record value pairing will end up
            payload_dict = {}

            # counter to iterate over the record fields
            counter = 0

            # generate list from the tab-delimited log entry
            payload_list = payload.strip().split('\t')

            # perform the field, value pairing and any necessary type casting.
            # possible types are: int, float and str (default)
            for field, field_type in realtimelog_fields_dict.items():
                #overwrite field_type if absent or '-'
                if(payload_list[counter].strip() == '-'):
                    field_type = "str"
                if(field_type == "int"):
                    payload_dict[field] = int(payload_list[counter].strip())
                elif(field_type == "float"):
                    payload_dict[field] = float(payload_list[counter].strip())
                else:
                    payload_dict[field] = payload_list[counter].strip()
                counter = counter + 1

            # JSON version of the dictionary type
            payload_json = json.dumps(payload_dict)

            # Preparing JSON payload to push back to Firehose
            payload_json_ascii = payload_json.encode('ascii')
            output_record = {
                'recordId': record['recordId'],
                'result': 'Ok',
                'data': base64.b64encode(payload_json_ascii).decode("utf-8")
            }
            output.append(output_record)

        print('Successfully processed {} records.'.format(len(event['records'])))

        return {'records': output}
8) Under Basic settings section, increase the Timeout value to 1 minute from the default 3 seconds by clicking the Edit button.

Step 4: Provisioning the Elasticsearch resource and the backup S3 bucket as destination for the Kinesis Firehose resource
1) In the Elasticsearch Service console, click Create a new domain.
2) On the screen (Step 1: Choose deployment type), in the Choose deployment type section, choose Development and testing.
3) Leave the default (latest) Elasticsearch version in the Version section.
4) Click Next.

5) On the next screen (Step 2: Configure domain), in the Configure domain section, use cf-realtime-log-es-domain as the Elasticsearch domain name. Leave the default settings for Instance type and Number of nodes in the Data nodes section. Leave the default settings in the Data nodes storage section and Dedicated master nodes section as well. Click Next.

6) On the next screen (Step 3: Configure access and identity):
a) Under Network configuration, choose Public access.

b) Under Fine-grained access control – powered by Open Distro for Elasticsearch section, select Enable fine-grained access control. Also, choose Create master user radio button and fill in the Master username, Master password and Confirm master password fields. (Important: Please make sure to save the credential because you need it to access the Kibana Dashboard.)

c) In the Access policy section, choose Allow open access to the domain for Domain access policy.

d) Leave the other settings on the same screen (Step 3: Configure access and identity) as default and click Next.
7) On the next screen (Step 4: Review), double-check the settings and click Confirm.
8) It takes about approximately 10 minutes to provision the Elasticsearch resource. Once the domain is in Active state, proceed to provisioning the Kinesis Firehose resource.

9) Please also create an S3 bucket in the same Region as the Kinesis Data Stream and Elasticsearch cluster to function as the backup destination for records that Kinesis Firehose may fail to deliver to Elasticsearch cluster.
Step 5: Provisioning the Kinesis Data Firehose resource to setup the analysis pipeline
1) In the Kinesis console Dashboard, click Create delivery stream.

2) On the next screen (Step 1: Name and source):
a) In the New delivery stream section, use cloudfront-real-time-log-data-kinesis-firehose-consumer as the Delivery stream name.

b) In the Choose a source section, choose Kinesis Data Stream radio button and select cloudfront-real-time- log-data-stream as Kinesis data stream (that was provisioned earlier in Step 1).

c) Click Next.
3) On the next screen (Step 2: Process records), in the Transform source records with AWS Lambda section:
a) Choose Enabled radio button for Data transformation.
b) Choose the Lambda function cf-real-time-logs-transformer created in Step 3.
c) Click Next.

4) On the next screen (Step 3: Choose a destination):
a) In the Choose a destination section, select the Amazon Elasticsearch radio button.

b) In the Amazon Elasticsearch Service destination section:
i) Choose cf-realtime-log-es-domain as Domain.
ii) Type: realtime under Index.

c) In the S3 backup section, choose Failed records only and select the backup S3 bucket created in Step 4.

d) Click Next.
5) On the next screen (Step 4: Configure settings), leave all the settings to default and click Next. (Note: You will notice under the Permissions section, that Firehose creates an IAM role that it assumes while interacting with other services. An example ARN for this role would be: arn:aws:iam::111222333444:role/service-role/KinesisFirehoseServiceRole-cloudfront-re-us-west-2-111222333444)
6) On the next screen (Step 5: Review), double-check the settings and click Next. Once the Kinesis Data Firehose resource is in place, let’s move on to the next step.
Step 6: Whitelisting Kinesis Data Firehose Service Role to push to Elasticsearch
Using the master username and password we set up while configuring fine-grained access control for the Elasticsearch domain in Step 4 (6)(b) above, we need to access the Kibana Dashboard and make the necessary configuration changes to allow the Kinesis Data Firehose Service Role to create Elasticsearch domain indexes and write data. Below are the steps:
1) Navigate to Kibana (you can find the URL on the Amazon Elasticsearch Service console). Select the URL next to the Kibana field in the Elasticsearch console for the Elasticsearch domain provisioned in Step 4.

2) Enter the master username and password that you set up when you created the Amazon Elasticsearch Service endpoint.

3) Under Security, choose Roles.

4) Click the + icon to add new role.
a) Name your role; for example, firehose-role.
b) In the Cluster Permissions tab, for Cluster-wide permissions, add as Action Groups: cluster_composite_ops and cluster_monitor
c) In the Index Permissions tab, click Add index permissions. Then choose Index Patterns and enter realtime*. Under Permissions: Action Groups, add three action groups: crud, create_index, and manage.
d) Click Save Role Definition.


5) In the next step, you map the IAM role that Kinesis Data Firehose uses to the role you just created.
a) Under Security, choose Role Mappings.
b) Choose the firehose-role you just created.
c) For Backend roles, enter the IAM ARN of the role Kinesis Data Firehose uses to write to Amazon ES and S3 arn:aws:iam::<aws_account_id>:role/service-role/<KinesisFirehoseServiceRole> . (This would be the same ARN for the IAM Service Role that is created during Kinesis Data Firehose resource creation at Step 5. Example:(arn:aws:iam::111222333444:role/service-role/KinesisFirehoseServiceRole-cloudfront-re-us-west-2-111222333444). Click Add Backend Role.
d) Click Submit.

Step 7: Build a Dashboard in Amazon ES
You can use Amazon ES to observe trends in the data and you can combine your graphs into a dashboard. For example, you may want to see how many requests are originating from different geographic Regions.
1) To do this, go to the Visualize section of your Kibana dashboard and create a new visualization. Specify the type of visualization that you want to generate. You can create the map below by selecting a Type of Region Map. Specify the index pattern that you have created in Kibana. Under the Metrics select aggregation of Count and add a Bucket with Aggregation of Terms with the c-country field. Save the visualization by specifying a title.

2) Another example is if you want to see in which Region vieweres see the most latencies, you can create a visualization with a bar graph and set up a range of values that you would like to track. In this example, we have set up a range on the time-taken field and are looking at the number of requests per country.

3) You can combine visualizations into dashboards that aggregate relevant information about operational events. Select the Dashboard option on the Kibana main page. You see an option to Create new dashboard.

4) Add the existing visualizations that we have created previously to the dashboard.

5) In the sample dashboard that follows, you can see multiple visualizations focusing on different dimensions like Requests per country, Countries with viewers experiencing higher latency, and Number of Viewers per Country within the specified latency range.

Conclusion
In this post, we set up a real-time log streaming and dashboard solution using CloudFront and Amazon ES. The ability to receive real-time CloudFront log data allows you to quickly analyze requests to your web applications. We’ve covered an example of how you can use Amazon ES as a destination for CloudFront logs and shown you how to build a visualization. You can create a real-time operational dashboard in Kibana to review the detailed log data. For more information on CloudFront real-time logs you can review the CloudFront Developer Guide.

Mohammad Shafiullah
Mohammad Shafiullah is a Senior Cloud Support Engineer at AWS. He has a keen interest for technologies in the M&E sector and specializes in CDN, streaming, OTT services, and serverless technologies. He spends considerable amount of time investigating and root causing complex issues for enterprise customers. He is always hungry to learn about newer technologies and help customers build holistic solutions. Outside of work, he loves watching movies, reading books but most importantly spending time with his family.

Samrat Karak
Samrat Karak is a Senior Product Manager on the Amazon CloudFront team based in Seattle. He is passionate about understanding and solving customer use cases with product features and serverless compute with Lambda@Edge. Samrat has over 13 years of experience building and managing products in Enterprise solutions and AWS.