AWS Public Sector Blog
Mission AI ROI strategy framework for space using Amazon Bedrock
If you lead an aerospace program, two massive economic forces create both opportunity and urgency.
McKinsey & Company projects the global space economy will reach $1.8 trillion by 2035, nearly tripling from $630 billion in 2023. Separately, McKinsey estimates generative AI stands to add $2.6 trillion–$4.4 trillion in annual value.
Aerospace programs operate under constraints that break standard AI return on investment (ROI) models. International Traffic in Arms Regulations (ITAR) and Export Administration Regulations (EAR) restrict where data can flow and who can access it. Errors carry consequences measured in lives. Qualification cycles span years, yet the launch cadence the market expects leaves no room for slow timelines.
This post introduces the mission AI ROI strategy (MARS) framework, giving you a defensible path from AI spending to quantifiable value without compromising governance rigor. Built on Amazon Bedrock by Amazon Web Services (AWS) as the implementation solution, the framework rests on a single argument: ROI, governance, and token optimization form a reinforcing system. None of them deliver the desired results in isolation.
Why the space industry needs a different ROI model
Standard AI ROI frameworks assume cost is the dominant variable and that all workloads carry similar consequences. Neither holds in aerospace.
On the cost side, any inference call touching ITAR-controlled technical data must comply with export control access restrictions, and output informing a safety-critical decision requires human validation. Those costs are real, recurring, and routinely excluded from ROI calculations.
On the benefit side, compressing a launch vehicle design cycle by weeks translates directly to launch cadence, contract capture, and competitive position.
Corporate AI investment reached $581.7 billion in 2025 according to Stanford’s AI Index Report 2026. That growth isn’t slowing, but neither is scrutiny: Today, 93 percent of organizations exceed their AI budgets. If you can’t articulate your return, you risk losing budget to programs that can.
The arithmetic of ungoverned consumption is unforgiving. If your organization has broad coding assistant adoption, power users generate $500 to $2,000 per engineer per month in token costs, with one 5,000-engineer organization burning through its annual AI budget in only 4 months. Even at average consumption rates of $150 to $250 per engineer per month, annual spend for a large engineering organization can reach tens of millions of dollars, and power-user consumption can push that above $100 million. For your space company, the exposure is larger than cost. Every token processed through an unapproved pathway is a potential export control violation. The MARS framework treats token budgets as a governance control, not only a financial one.
Pillar 1: ROI measurement with mission context
The first pillar of the MARS Framework adapts financial ROI methodology to your space program realities, which include long timelines, high consequence variability, and regulatory overhead that varies by workload.
Mission-adjusted AI ratio (MAIR)
Because aerospace programs value schedule, cost, and risk differently depending on mission type, With MAIR, program leadership can assign explicit weights to each benefit category. We define MAIR as a weighted benefit-cost ratio adapted for aerospace AI investments. The following formula and table define each term:
MAIR = (w_m × ΣMV + w_c × ΣCE − w_r × ΣRE) / GA-TCO
| Term | Description |
|---|---|
| MV | Mission velocity value ($): schedule compression converted to dollar value using contract milestone rates or avoided delay penalties, summed across all workloads or periods under evaluation |
| CE | Cost efficiency gains ($): labor hours saved × fully loaded cost rate, plus rework avoidance, summed across all workloads or periods under evaluation |
| RE | Risk exposure costs ($): probability of incident × financial impact (investigation, rework, contract penalty), summed across all workloads or periods under evaluation |
| w_m, w_c, w_r | Weighting factors set by program leadership. Constraint: w_m + w_c + w_r = 1.0, forcing trade-off decisions rather than inflation |
| GA-TCO | Governance-adjusted total cost of ownership (GA-TCO) (see Pillar 2) |
Interpreting the ratio: MAIR is a form of benefit-cost ratio (BCR). In standard BCR analysis, any value above 1.0 indicates that benefits exceed costs and the investment is worthwhile. Values below 1.0 indicate that costs outweigh benefits. Organizations can establish their own action thresholds based on risk tolerance, estimation uncertainty, and historical program cost-growth data. As a starting point, consider calibrating thresholds against two reference points:
- Industry BCR baseline: A ratio above 1.0 is the universally accepted minimum for a positive investment. For aerospace and defense programs, where cost overruns of 20–50 percent are common, a higher minimum (for example, 1.5) is appropriate to provide a margin of safety.
- AI ROI benchmarks: Current enterprise AI data shows that value capture remains highly concentrated. McKinsey’s State of AI 2026 survey (n=1,719) found that only 6 percent of enterprises qualify as AI high performers with 5 percent or more of earnings before interest and taxes (EBIT) attributable to AI, even as 88 percent reported using AI in at least one function in 2025. Boston Consulting Group (BCG) independently confirms this pattern: The top 5 percent of future-built companies achieve 1.7 times revenue growth and 3.6 times 3-year total shareholder return when compared to laggards, deploying 62 percent of AI initiatives to production compared to only 12 percent for laggards.
The following table provides a suggested interpretation framework. These thresholds aren’t drawn from a published standard; rather, they’re proposed guidelines that each organization can adjust to its own context.
| MAIR range | Suggested interpretation | Recommended action |
|---|---|---|
| > 2.0 | Strong return with meaningful margin above cost uncertainty | Candidate for expanded investment and scaling to additional workloads |
| 1.5–2.0 | Positive return with adequate margin for estimation error | Investment justifies current spending levels; monitor for improvement opportunities |
| 1.0–1.5 | Marginal return; benefits exceed costs but margin is thin relative to typical aerospace and defense cost growth | Apply optimization levers, reduce GA-TCO, or increase workload maturity before expanding |
| < 1.0 | Costs exceed benefits | Reassess workload viability or restructure the investment |
The normalization constraint (w_m + w_c + w_r = 1.0) prevents inflation. A launch vehicle program weights mission velocity heavily because every week of schedule compression is worth millions in earlier revenue recognition. A satellite manufacturing line weights cost efficiency because margins are thinner, and volume is higher.
MAIR differs from standard ROI in two ways. First, the risk subtraction term accounts for AI failure costs in regulated environments. Second, the normalization constraint means you must choose where to place emphasis, surfacing real strategic trade-offs.
Accepted output per dollar (APD)
You can track whether each AI dollar produces more usable work over time using this formula:
APD_t = [Q_t × A_t × (1 − H_t)] / C_t
| Term | Description |
|---|---|
| Q_t | Volume of AI-assisted tasks in period t |
| A_t | Acceptance rate: outputs used without modification |
| H_t | Error escape rate: accepted outputs later requiring rework (trailing 90-day window) |
| C_t | Total inference cost in period t |
Risk-adjusted net present value for AI workload maturity (rNPV-AI)
You can adapt the risk-adjusted net present value (rNPV) method, widely used in biopharmaceutical and technology portfolio valuation, to your generative AI investment decisions. This approach scales each period’s cash flow by a confidence factor that reflects AI workload maturity:
rNPV-AI = Σ[(CF_t × K_t) / (1 + r_s)^t] − I₀
Where:
- CF_t = expected cash flow in period t
- K_t = confidence factor (0 to 1) reflecting workload maturity
- r_s = discount rate (cost of capital)
- I₀ = initial investment
Confidence factors (K_t) are informed by the National Aeronautics and Space Administration (NASA) Technology Readiness Level (TRL) framework, adapted here for AI workload maturity. The TRL scale (levels 1–9) was originally developed by NASA to assess technology maturity for space systems and is widely adopted across aerospace and defense. We propose the following three-tier mapping as a practical heuristic:
| Maturity tier | TRL analog | K_t (Suggested) | Description |
|---|---|---|---|
| Proven | TRL 7–9 | 0.85–1.0 | Workload operating in production at scale |
| Demonstrated | TRL 4–6 | 0.4–0.7 | Successful pilot with measured outcomes |
| Speculative | TRL 1–3 | 0.1–0.3 | Pre-pilot; concept or early prototype only |
Because K_t accounts for technical uncertainty in the numerator, the discount rate (r_s) should reflect only the time value of money and market risk, not technology risk, to avoid double-counting. For large publicly traded aerospace and defense firms, the weighted average cost of capital (WACC) is 7.5–8.5 percent based on current industry data. Individual organization hurdle rates are set higher (10 percent or more) to create a margin of safety.
Instrumenting Pillar 1 on AWS
The following AWS services provide the cost and usage data needed to compute MAIR, APD, and rNPV-AI without custom instrumentation:
- Identity and Access Management (IAM) Principal-Based Cost Allocation for Amazon Bedrock – Per-user, per-team visibility with no code changes
- Amazon Bedrock application inference profiles – You can attach cost allocation tags to a profile for workload-level attribution
- AWS Cost Explorer – Aggregate Amazon Bedrock spend by tag dimension for quarterly reporting
- AWS Cost Anomaly Detection for Amazon Bedrock – Automatic machine learning-driven anomaly detection on third-party model spend with root cause breakdowns by service, account, Region, and usage type
- Amazon CloudWatch – Track invocation count, latency, and token counts for Q_t and C_t
Pillar 2: AI governance as the control layer
This is where the framework diverges from what you might have seen in standard AI governance. The National Institute of Standards and Technology (NIST) AI Risk Management Framework provides the structure: Govern (establish accountability), Map (identify scope and export classifications), Measure (quantify risks), and Manage (implement proportional controls).
Risk-tiered governance model
| Tier | Workload examples | Optimization permitted | Governance |
|---|---|---|---|
| Low | Content drafting, meeting summaries, knowledge search | All levers (aggressive caching, routing to smallest capable model, batching) | Self-service with budget alarms |
| Medium | Code generation, test automation, engineering assistants | Caching and batching. Routing restricted to preapproved model tiers | Team review, quarterly ROI assessment |
| High | Structural analysis, flight systems, export-controlled data | Provisioned Throughput and nonsensitive prefix caching only. No model downgrading | Engineering review board, human-in-the-loop approach |
Governance-adjusted total cost of ownership (GA-TCO)
GA-TCO extends standard AI cost models by accounting for the governance, regulatory, and mission assurance costs that are unique to aerospace programs. It serves as the denominator of the MAIR equation introduced earlier.
GA-TCO = C_compute + C_data + C_talent + C_platform + C_governance + C_compliance + C_space
The final three terms distinguish this model from enterprise TCO:
| Term | Description |
|---|---|
| C_governance | AI review boards, guardrail configuration, evaluation pipeline operations |
| C_compliance | ITAR/EAR classification, Federal Risk and Authorization Management Program (FedRAMP) boundary infrastructure, personnel clearance administration |
| C_space | Launch/mission readiness reviews, independent verification and validation (IV&V) of AI-assisted designs, mission assurance documentation |
For defense-adjacent programs operating in AWS GovCloud (US), the infrastructure component of C_compliance (FedRAMP High boundary, ITAR-regulated environment) adds 10–15 percent to baseline compute costs. However, infrastructure is only one layer of compliance cost. When human and process costs are included, such as ITAR classification workflows, personnel clearance administration, and continuous monitoring operations, C_compliance can approach or exceed C_compute. This is why GA-TCO treats compliance as its own cost category rather than folding it into infrastructure overhead.
Map each cost activity to exactly one term. You can ask the question, “What triggered this cost?” If the trigger is an AI policy decision, it belongs in C_governance. If it’s triggered by a regulatory boundary requirement, it belongs in C_compliance. If it’s triggered by a mission integration gate, it belongs in C_space.
Enforcing Pillar 2 on AWS
The following AWS services enforce the risk-tiered governance model across the full inference lifecycle, from prompt filtering to audit logging:
- Amazon Bedrock Guardrails – Content filters, denied topics, sensitive information redaction, and contextual grounding checks.
- Amazon Bedrock Guardrails Automated Reasoning checks – These are formal, logic-based validations of model output against encoded rules. Deterministic and citable in design reviews.
- Amazon Bedrock Guardrails cross-account safeguards – Centralized enforcement of guardrail configurations across AWS accounts within an organization through Amazon Bedrock policies, with consistent safety controls for every model invocation.
- Amazon Bedrock Evaluations – Managed evaluations using automatic metrics, large language model (LLM)-as-a-judge, and human review.
- Amazon Bedrock AgentCore Observability – Traces, metrics, and step-level visibility for agentic workloads.
- AWS CloudTrail and Amazon Bedrock invocation logging – Full AWS Identity and Access Management (AWS IAM) identity recording, with prompt and completion capture.
- AWS GovCloud (US) and AWS PrivateLink – Inference inside FedRAMP High and Department of War (DoW) Impact Level boundaries over private network paths.
- AWS Organizations service control policies (SCPs) – Enforce Amazon Bedrock Guardrails attachment and model access across accounts.
Pillar 3: Token optimization as an engineering discipline
Token cost management is an established discipline, but your safety-critical and export-controlled workloads restrict which optimization choices you can apply. This pillar maps four levers to a risk-tier gate.
Optimization levers using Amazon Bedrock and implementing Pillar 3 on AWS
| Lever | Description | Potential impact |
|---|---|---|
| Prompt caching | Cache stable prompt prefixes to reduce input-token costs and latency | Up to 90 percent input-token cost reduction, 85 percent latency reduction |
| Intelligent Prompt Routing | Route prompts to the most suitable model, balancing quality against cost | Up to 30 percent cost reduction without accuracy loss |
| Batch inference | Run non-urgent workloads at discount pricing | 50 percent of on-demand pricing |
| Provisioned Throughput | Reserve model capacity for predictable unit economics | Fixed-cost dedicated capacity |
Amazon Bedrock Knowledge Bases amplifies these four levers by supplying precise retrieved context instead of stuffing documents into prompts. This lowers C_t, the total inference cost at period t, while sustaining acceptance rate.
Validation rule:Every optimization lever must reduce C_t while A_t, the acceptance rate, and H_t, the error escape rate, hold steady. A cost reduction that degrades acceptance isn’t an optimization; it’s a quality transfer.
The unified framework in action
When you apply the MARS Framework, the three pillars form a reinforcing cycle:
- ROI justifies governance investment –A single ITAR compliance incident carries cost at every level. Internal investigation, remediation, and voluntary disclosure preparation alone cost $100,000–$500,000. If governance controls prevent even one incident per year, the governance cost produces clear net value.
- Governance constrains optimization –The risk tier determines which token levers are available, preventing quality degradation in mission-critical workloads.
- Optimization feeds ROI –Token savings land directly in the GA-TCO denominator.
Figure 1 illustrates how the three pillars connect into a single reinforcing cycle:
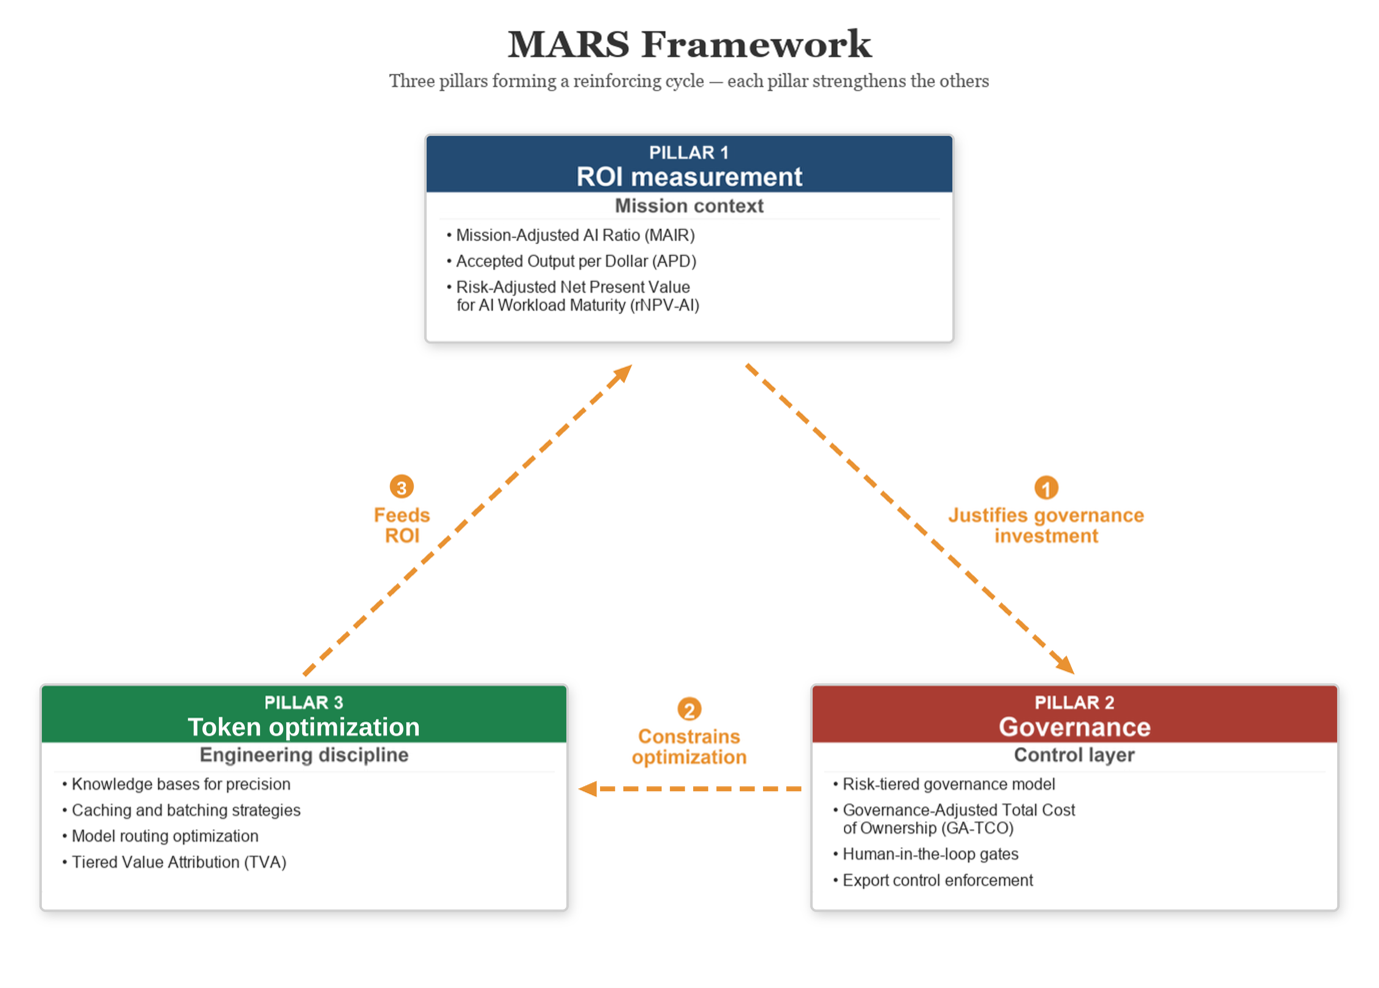
Figure 1: The MARS Framework. ROI measurement, governance, and token optimization form a reinforcing cycle where each pillar strengthens the other two
Tiered value attribution (TVA)
Report the same data through audience-appropriate lenses:
TVA = α × V_operational + β × V_strategic + γ × V_financial
V_operational captures cycle time, defect rate, and throughput. V_strategic captures competitive differentiation and time to market. V_financial captures cost avoidance and revenue acceleration. Weights (α, β, γ) sum to 1.0 and shift by audience:
| Audience | α (Operational) | β (Strategic) | γ (Financial) |
|---|---|---|---|
| Engineering leadership | 0.6 | 0.2 | 0.2 |
| Chief financial officer | 0.2 | 0.2 | 0.6 |
| Board | 0.2 | 0.6 | 0.2 |
Applying the framework: A satellite program example
To illustrate how to apply this framework, consider a commercial satellite manufacturer that deployed a generative AI assistant to accelerate thermal model documentation. The thermal analysis team produces 200 summaries per quarter, each previously requiring 4 hours of senior engineer time. The AI assistant reduced this to 20 minutes per summary with engineer review. The program classified the workload as Medium tier.
MAIR calculation
Using the satellite program’s first 90 days of production data, the team computed MAIR from the following inputs:
- MV – 3-week schedule compression valued at $1.2 million ($400,000/week contract milestone rate)
- CE – 200 summaries × 3.7 hours saved × $180 an hour = $133,200
- RE – Two unit conversion errors caught in peer review, 40 hours investigation at $200 an hour = $8,000
- Weights – w_m = 0.5, w_c = 0.3, w_r = 0.2 (schedule-driven program)
- GA-TCO – $42,000 inference + $28,000 prompt engineering + $18,000 evaluation + $12,000 governance = $100,000
MAIR = [(0.5 × $1,200,000) + (0.3 × $133,200) − (0.2 × $8,000)] / $100,000 = 6.4
At 6.4, the workload justified aggressive scaling to additional documentation workflows.
APD: 200 tasks × 0.94 acceptance × (1 − 0.01 error escape) / $42,000 = 4.4 accepted outputs per $1,000 spent. After enabling prompt caching, C_t dropped 62 percent while acceptance held, and APD rose to 11.7 in 60 days.
In plain terms: every $1 the program spent on generative AI returned $6.40 in weighted mission value, and prompt caching nearly tripled the output efficiency without sacrificing quality.
Implementation sequence
To put the framework into practice, follow these five steps in order. Each builds on the controls and data established by the previous one:
- Classify workloads by risk tier – Map each use case to Low, Medium, or High based on data sensitivity and consequence of error.
- Establish cost attribution – Configure IAM-based cost allocation and application inference profiles in Amazon Bedrock.
- Apply optimization levers by tier – Enable caching, routing, and batching only where governance permits.
- Build ROI equations as baseline data accumulates – Allow 60–90 days of production data before computing MAIR and APD.
- Report quarterly using TVA – Present results with audience-appropriate weighting.
Conclusion
If you want to lead the $1.8 trillion space economy of 2035, you need to make generative AI investment decisions today. The MARS Framework provides the structure to make those decisions defensibly, with ROI that accounts for mission context, governance that respects consequence levels, and token optimization that binds the system together.
The measures in this framework (MAIR, APD, rNPV-AI, GA-TCO, and TVA) draw on standard financial constructs (weighted return ratios, net present value, total cost of ownership) and recompose them for the specific constraints of regulated aerospace AI programs. They provide you with a common language to discuss AI investment across engineering, finance, and executive stakeholders.
Next steps
- AWS Well-Architected Agentic AI Lens – You can review this page for prescriptive guidance on agent cost visibility and governance.
- Amazon Bedrock Guardrails – You can explore Amazon Bedrock Guardrails to implement risk-tier enforcement controls.
- Optimizing cost and latency with Amazon Bedrock prompt caching – You can review this guide for six implementation patterns including tenant-isolated caching for multi-program environments.
Contact your AWS account team to discuss how to structure AI ROI measurement and governance for your regulated space programs.