亚马逊AWS官方博客
使用 CloudWatch Metric Streams 实时采集服务指标到自定义 HTTP Endpoint
 |
Amazon CloudWatch 是 AWS 的监控服务,用于收集和追踪运行在 AWS 的各种资源和应用程序的指标,为用户提供了全方位的监控和观测能力。CloudWatch 本质是一个强大的指标存储库,通过收集 AWS 服务(如 Amazon EC2、Amazon EBS、Amazon RDS 等)的原生指标,以及用户自定义的指标数据,构建了一个完整的监控体系。
指标是发布到 CloudWatch 的一组按时间顺序排列的数据点。Amazon CloudWatch 支持自动从 70 多种 AWS 服务收集指标,您无需额外配置。例如,EC2 实例会自动发布 CPU 使用率、数据传输和磁盘使用情况等指标,指标数据会按时间序列存储到 CloudWatch。同时,CloudWatch 指标分为自动启用的默认指标和需手动开启的详细指标,指标数据采集支持标准精度(分钟级)和高精度(秒级)两种模式,数据默认保留 15 个月并按区域存储,到期后自动清理。
在实际的应用场景中,企业客户经常需要将 CloudWatch 中的指标数据实时采集到自己的集成平台,与其他来源的数据进行整合分析或长期存档。AWS 服务指标采集主要有两种方案,一种为通过 API(GetMetricStatistics/GetMetricData)拉取数据,一种为使用 CloudWatch Metric Streams 通过 Kinesis Data Firehose 实时推送指标数据。调用 API 拉取数据,数据延迟较大(5 到 10 分钟的延时),存在一些限制。本文将详细介绍如何使用 CloudWatch Metric Streams 将服务指标近实时推送到自定义的 HTTP Endpoint 的方案。
方案架构
下面的架构图演示了该方案的工作原理,以及它如何与其他 AWS 服务进行集成。
 |
- 我们为三个服务命名空间创建了 CloudWatch Metric Streams,分别是:AWS/RDS、AWS/EC2、AWS/Lambda。
- 配置 Amazon Kinesis Data Firehose 将指标数据传输到自定义的 HTTP Endpoint,期间选择了使用 Lambda 函数进行数据转换,使用 Amazon S3 来备份传输失败的数据。
- 我们定义了API Gateway REST API 端点接收来自 Kinesis Data Firehose 数据流的数据,然后通过与 Lambda 的集成触发相应的 Lambda 函数。
通过 AWS Console 部署方案
使用 API Gateway 和 Lambda 创建 HTTP Endpoint
1. 在 AWS Console 打开 Lambda,点击 Create function 继续操作
选择 Use a blueprint,blueprint name 选择 Hello world function,函数名填写 metrics-processor,点击 Create function
 |
修改 Lambda 代码,点击 Deploy
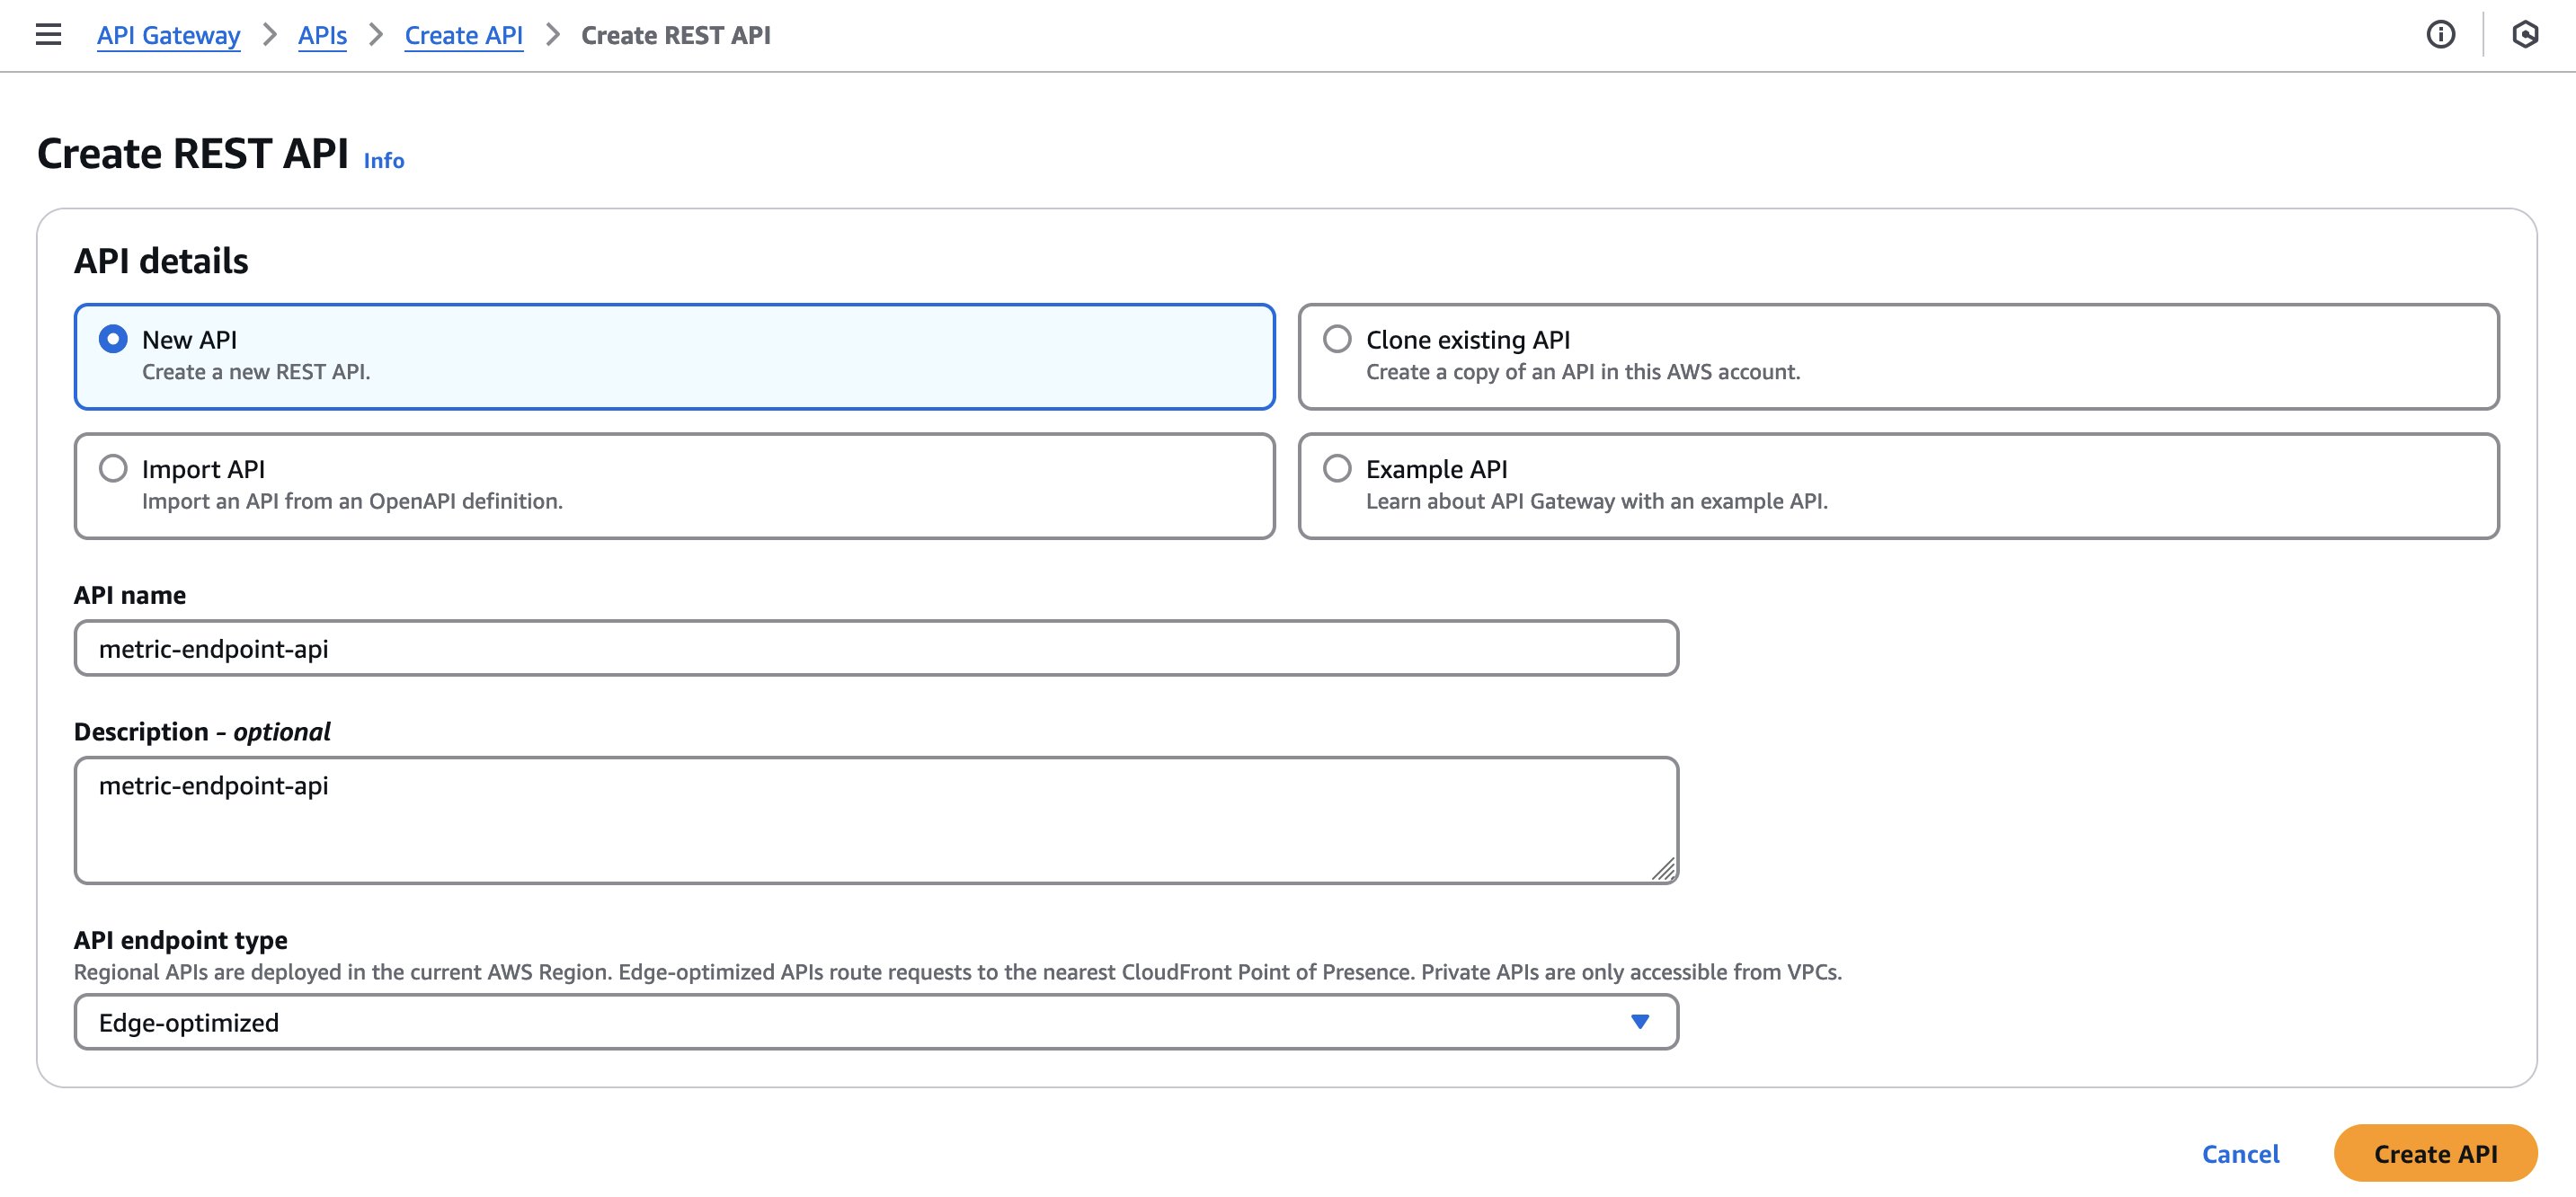
2. 在 AWS Console 打开 API Gateway,点击 Create API,在新页面里选择 REST API;在新页面里名字填写 metric-endpoint-api,API endpoint type:Edge-optimized ,点击 Create API 继续操作
 |
3. 在页面中点击 Create Resource 创建 Resource,填写资源名称 metrics,资源路径为/metrics
 |
 |
4. 在页面选择刚刚创建的 metrics,选择 Create Method,创建 Method。选择 Method type:POST,Integration type:Lambda 函数,Lambda proxy integration 设置为 enable,Lambda Region:(选择您的区域),Lambda function 选择之前创建的 metrics-processor;点击 Create Method 继续操作
 |
5. 在 Resource 页面中点击 Deploy API,部署 API。选择 New Stage,Stage name 输入 prod,点击 Deploy
 |
6. 记录 Invoke URL,如我们创建 URL 为 https://aqju1m4vof.execute-api.us-east-1.amazonaws.com/prod/metrics。在稍后创建 Data Firehose 时需填写此 URL
 |
创建 Kinesis Data Firehose 到 HTTP Endpoint
1. 在 AWS Console 所需的特定区域打开 Amazon Data Firehose,点击 Create Firehose Stream(创建 Firehose 流)继续操作:
Firehose stream name 输入 cloudwatch-firehose-put-http,Source 选择 Direct PUT,Destination 选择 HTTP Endpoint
2. 在 Destination settings 页面中,输入 HTTP Endpoint 名称和对应的 URL 地址 https://aqju1m4vof.execute-api.us-east-1.amazonaws.com/prod/metrics
 |
3. 选中 Turn on data transformation,点击 Create function 为 Transform source records 创建 Lambda 函数
 |
4. 在新页面中选择 General Amazon Data Firehose Processing,点击 Use blueprint,选择 Blueprint name: Process records sent to an Amazon Data Firehose stream;Function name 填写 cloudwatch-firehose-record-processor,点击 Create function 完成操作,lambda 代码如下:
5. 继续在 Firehose stream 创建页面,Transform records 选择 cloudwatch-firehose-record-processor 作为转换函数
 |
6. 继续在 Firehose stream 创建页面,Backup settings 保留 Failed data only,创建名字为 metrics-backup-failed 的 S3 bucket,作为数据传输失败时 S3 backup bucket
 |
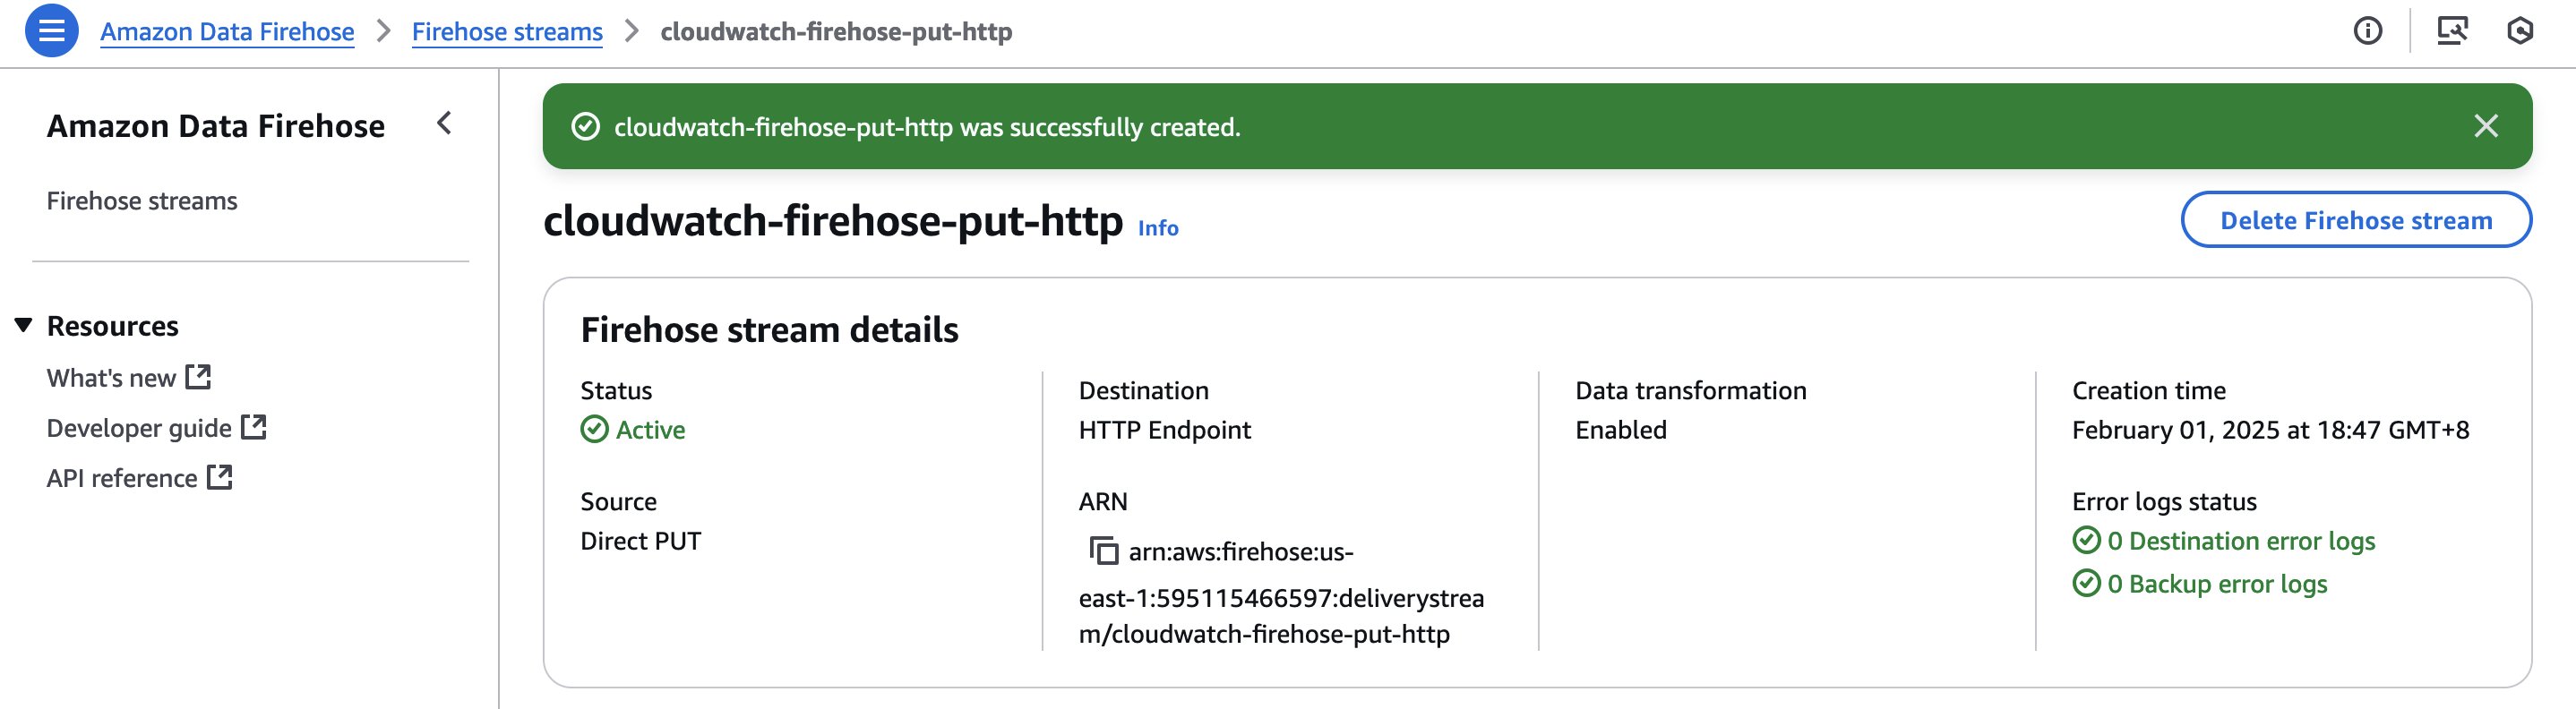
7. 点击 Create Firehose stream 完成操作
 |
创建 CloudWatch Metric Streams
1. 在 AWS Console 所需的特定区域打开 CloudWatch,点击左侧导航栏中的 Streams(流),点击 Create metric stream(创建流)继续操作
Destination 选择 Custom setup with Firehose,选择上一步创建的名字为 cloudwatch-firehose-put-http 的 data firehose,Change output format 选择 JSON
 |
Metric to be streamed 选择 Select metrics,Select metrics 选择 Include,搜索框分别输入 EC2,RDS,Lambda,并选择 All metrics names;Custom metric stream name 填写 cloudwatch-metric,点击 Create metric stream 完成操作
 |
通过 CloudFormation 部署方案
您可以从此 Git Repo 找到代码仓库,参照以下命令一步一步部署此 CloudFormation
1. 准备 S3 存储桶(Prepare S3 Bucket)
首先创建一个 S3 存储桶来存储 Lambda 函数代码:
2. 准备 Lambda 函数代码(Prepare Lambda Function Code)
创建并上传 Lambda 函数的部署包:
3. 部署 CloudFormation 堆栈(Deploy CloudFormation Stack)
使用 AWS CLI 部署(Deploy using AWS CLI):
4. 验证部署(Verify Deployment)
部署完成后,验证关键组件:
验证测试
1. Metric Streams 状态为 Running,Metric Updates 和 Total Metric Update 处于更新状态
 |
 |
2. Data Firehose Transformation 和 HTTP Endpoint Lambda 函数创建成功
 |
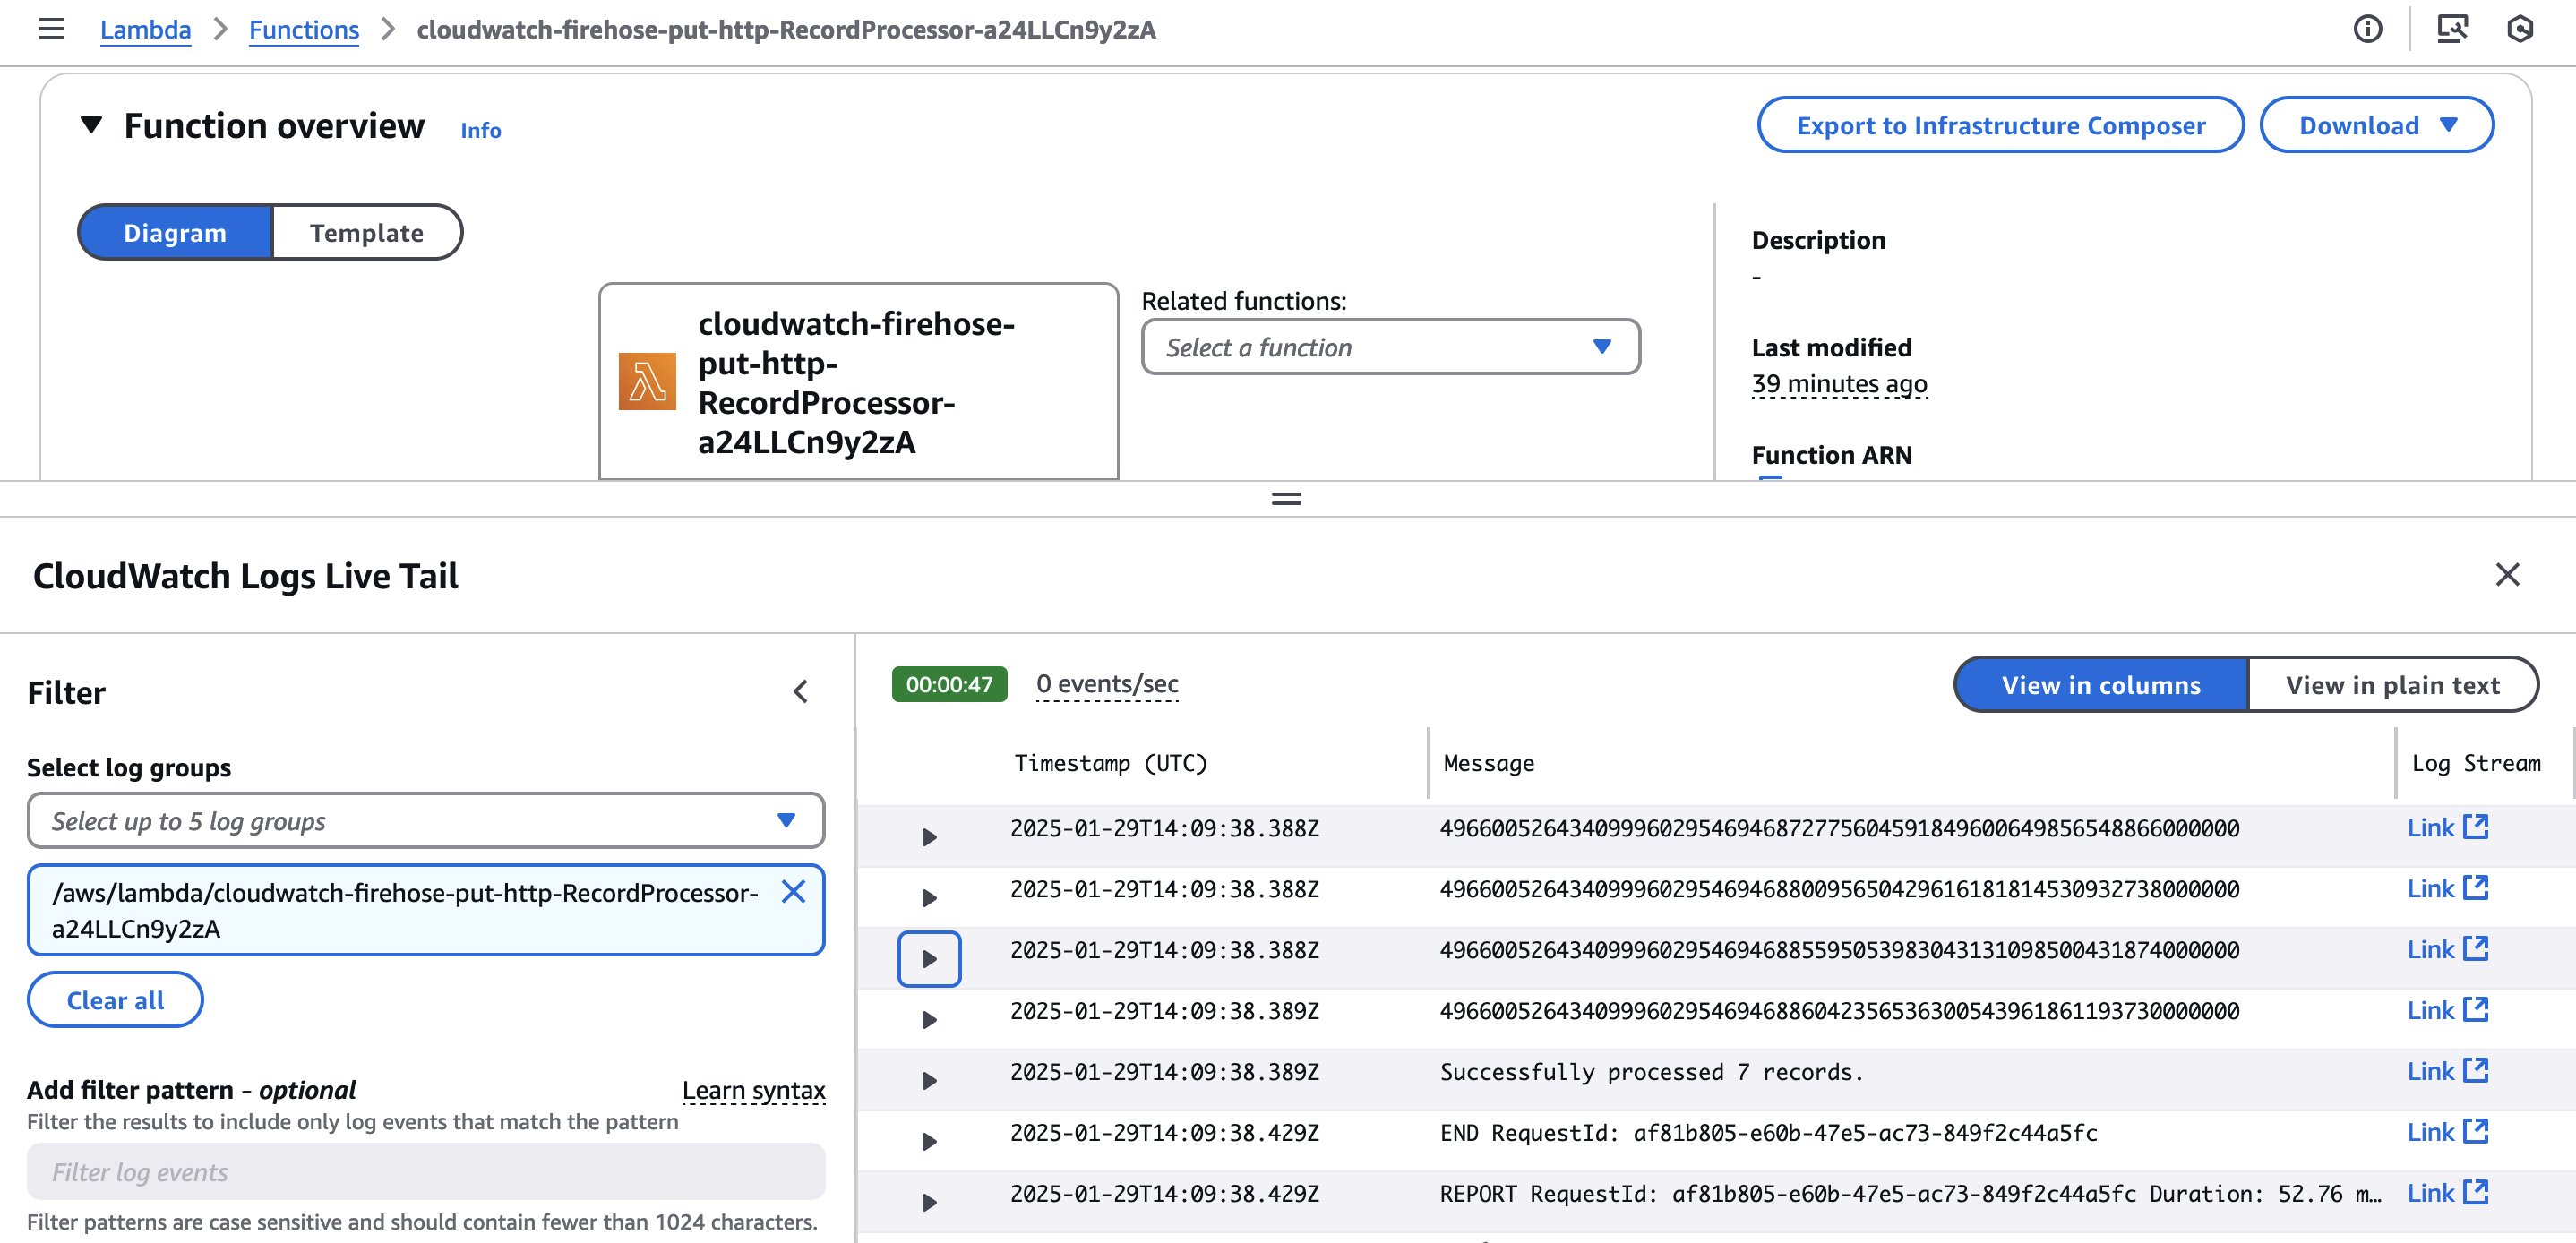
3. Data Firehose Transformation Lambda CloudWatch Logs Live Tail 日志正常输出
 |
4. HTTP Endpoint Lambda CloudWatch Logs Live Tail 日志正常输出
 |
总结
在这篇文章中,我们向您介绍了如何通过设置指标流将 CloudWatch 的监控指标近实时地传输到自定义的 HTTP Endpoint,以进行整合分析或长期存档,并提供了 CloudFormation 模板来简化部署流程。您还可以在示例代码的基础上进行开发以满足自定义需求,比如,您提供的 HTTP Endpoint 可能不是来自于 API Gateway REST API 端点触发的 Lambda 函数,而是集成平台中已经存在的 HTTP 接口。