AWS Contact Center
Create Custom Reports for Amazon Connect Cases
Introduction
Amazon Connect Cases allows your agents to track and manage customer issues that require multiple interactions, follow-up tasks, and teams in your contact center. As an organization, it becomes important to define performance metrics for resolving cases and identifying any bottlenecks.
Amazon Connect supports Cases events streams which provide you with near real-time updates when cases are created or modified within your Amazon Connect Cases domain. Organizations can generate custom reports based on these events to get deeper insights of their case resolution performance.
In this blog, you will learn how to develop a reporting and analytics solution using Amazon Athena and Amazon QuickSight.
Overview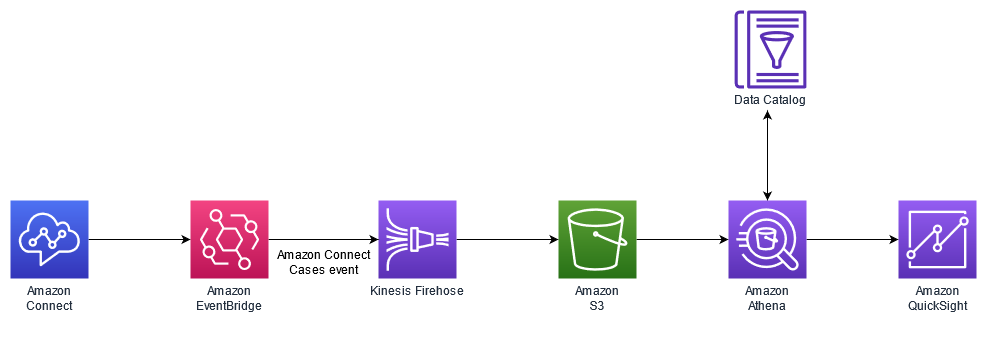
Fig 1 – High-level architecture diagram
In this architecture, Amazon Connect publishes events near real-time to the case events streams, each time a case is created or modified. The events published to the stream include, Case reacted, Case modified and Related items (Comments, Calls, Chats, Tasks). Amazon EventBridge receives the Amazon Case event streams, tracks the case event data, and streams it to Amazon Kinesis Data Firehose. Kinesis Data Firehose collects these events for a defined interval of time, compresses these records to a parquet file, and stores this parquet file in the Amazon Simple Storage Service (S3) bucket.
AWS Glue Catalog has the table definitions for the Contact event stream. You can run queries in Amazon Athena for reporting, and Amazon QuickSight for visualization.
This solution uses a parameter named “Project Name” that defines the solution domain. You can deploy this solution multiple times with different project names to maintain isolation. Since it will be used to name fundamental components such as an S3 bucket, project name must be globally unique.
Prerequisites
To follow along with the solution presented in this blog post, you should be familiar with the following AWS services and features:
- Amazon Connect
- Amazon EventBridge
- Amazon Simple Storage Service (S3)
- AWS CloudFormation
- Amazon Kinesis
- AWS Glue
- Amazon QuickSight
- Amazon Athena
- AWS Identity and Access Management (IAM)
- Set up case event streams
- An active AWS account with the permission to create and modify AWS IAM roles
Walkthrough
- Sign in to the AWS Management Console.
- Download the CloudFormation template from here onto your local machine
- In your preferred Region, create a CloudFormation stack using the template file downloaded in step 2, by filling the Stack name and Project name.

- Keep the defaults on the remaining options page and select Create Stack
Validation
In this step, generate data by interacting with Amazon Connect Cases. Within a few minutes, Contact Event case stream data will appear in the bucket named as your project name under “cases-relateditem-base” in “.parquet” files.
- Navigate to Amazon Athena table, you should see “connect-cases” table. Click on three dots besides the connect_case table, then select Preview Table.

- Athena displays the query results as seen in the following screenshot.

Visualize in Amazon QuickSight
Amazon QuickSight allows you to visualize the results of your Amazon Athena queries directly. Before connecting Amazon QuickSight to Athena, you must grant Amazon QuickSight access to Athena and its associated S3 bucket. For more information, see managing Amazon QuickSight permissions to AWS resources. After granting the access permissions, you create a new dataset in Amazon QuickSight based on the Athena table that was created.
Next create a new analysis in Amazon QuickSight.
- Navigate to QuickSight and select Analyses.
- Click on New Dataset, then select Athena and give the data source a name.
- In the example below, the name chosen is ‘cases-reporting’. Afterwards, click on Create data source.

- Choose the name of the database (same as project name in CFT) and “connect_cases_latest” view then click ‘Select’

- Finally, click Visualize to complete the dataset creation.

- In the next screen, you set up your analytics in the sheet.
- Click on the fields of interest under the “Fields list” and the “Visual type” to display the visualization.

- To get visuals similar to the following screenshots (Fig – 2), configure the Field list and Visual types as listed in the following table (Table – 1).
Visual Name Field List Visual Types Visual type icon Number of Cases caseid (count) KPI 
Number of open cases status_open (sum) KPI Number of closed cases status_closed (sum) KPI Average # of Hours from creation to close creation_to_close_diff_hours (average) KPI Average number of Touch points countofcontactspercase (average) KPI Average number of Tasks pre case countoftaskspercase (average) KPI Number of cases created per date X axis – createdatetime
Y axis – caseid (count)Vertical bar chart 
Number of cases created per date with status X axis – createdatetime
Y axis – status(count)
Group/Color – statusVertical bar chart Number of cases by status Group/Color – status Pie chart 
Table-1
 Fig -2
 - To create a filter on CaseTemplate or CaseReason, follow the steps below
- Under the Parameters option, click the plus sign (+) to add a parameter
- Name the Parameter (e.g. CaseReason), select type (e.g. “String”) and select “single value” and click create
- In the next screen click on Control. Name the Control (e.g. Case Reason).
- Select style as “Drop-down” and select “Link to a data-set field” option.
- Select the data-set you created earlier, and select the field that will contain the data (case_reason). Click on Add
- Under the Filters option, click the plus sign (+) to add a filter. Select field to use with the filter (case_reason).
- Click on the newly created filter. Select filter type to be ‘Custom filter’. Check ‘Use parameters’. When asked to change the scope of the filter, select ‘Yes’.
- Select the parameter to be the parameter you created above. Click ‘Apply’ and ‘Close’.
To build additional customized visualizations within Amazon QuickSight, check this blog post for more details.
Clean up
In order to remove the resources created by the stack, perform the following:
- Delete the CloudFormation template.
- Delete the object and the S3 bucket created from the CloudFormation template. The Bucket name should contain the project name.
- Delete the Glue database created from the CloudFormation template.
- Delete Amazon QuickSight dashboard
Conclusion
In this blog, you learned about Amazon Connect Cases events, set up a pipeline to stream the cases’ events, built reports using Athena, and visualization using Amazon QuickSight. You can stream the cases event data in a similar fashion to other AWS services like Amazon CloudWatch or third-party applications. To visualize your cases data in Tableau and Power BI, follow Building AWS data lake visualizations with Amazon Athena and Tableau and Using the Amazon Athena Power BI connector blog, respectively.
If you are interested in learning about hands off solutions for your analytics needs, explore our accredited partner solutions in the AWS Marketplace. Partners like Joulica and Aceyus offer Contact Center metric solutions including cases reports.
For more analytics capabilities on Amazon Connect data sources, refer the following blogs in the Amazon Connect reporting blog series:
- Analyze Amazon Connect Contact Trace Record (CTR)
- Analyze Amazon Connect Contact Lens
- Analyze Amazon Connect Chat sentiments
- Analyze Amazon Connect Chatbot performance
- Analyze Amazon Connect Agent Event Stream (AES)
- Automating Amazon QuickSight dashboard creation for analyzing Amazon Connect data
- Analyze data for Amazon Connect Outbound Campaigns (Contact event Streams)
- Create Custom Reports for Amazon Connect Cases
Author Bio
 |
Mehmet Demir is a Senior Solutions Architect at Amazon Web Services (AWS) based in Toronto, Canada. He helps customers in building well-architected solutions that support business innovation. |
 |
Ankur Taunk is a Senior Specialist Solutions Architect at AWS. He helps customer achieve their desired business outcomes in the Contact Center space leveraging Amazon Connect. |
 |
Edgar Alza is a Senior Product Manager at Amazon Web Services (AWS). Edgar is passionate about building solutions that help organizations provide superb customer service. Outside of work, he loves to travel and play soccer. |