AWS Big Data Blog
Building AWS Data Lake visualizations with Amazon Athena and Tableau
July 2023: This post was reviewed for accuracy.
Amazon Athena is an interactive query service that makes it easy to analyze data in a data lake using standard SQL. One of the key elements of Athena is that you only pay for the queries you run. This is an attractive feature because there is no hardware to set up, manage, or maintain.
You can query Athena with SQL or by using data visualization tools such as Amazon QuickSight, Tableau, or other third-party options. QuickSight is a cloud-native business intelligence (BI) service that you can use to visually analyze data and share interactive dashboards with all users in your organization. QuickSight is fully managed and serverless, requires no client downloads for dashboard creation, and has a pay-per-session pricing model that allows you to pay for dashboard consumption with a maximum charge of $5.00 per reader per month. The combination of QuickSight and Athena allows you to rapidly deploy dashboards and BI to tens of thousands of users, while only paying for actual usage, and not worrying about server deployment or management. Tableau allows you to similarly share dashboards with readers when utilizing Tableau servers. This post demonstrates how you can connect to Athena from a Tableau desktop, create a dashboard that queries data from Athena, and publish to a Tableau server for broader distribution.
Integration of Tableau with Athena as a data source is gaining in popularity, and many customers prefer to create Tableau dashboards on Athena. Performance of the dashboard usually varies based on many factors, such as number of fields and views, data size, network bandwidth, Athena query runtime, dashboard rendering time, connection type, and location of the Tableau server (on premises or AWS). We walk you through the required configuration to integrate Tableau with Athena, best practices, and Athena runtime analysis.
Solution overview
In this solution, we build an end-to-end Tableau dashboard using Athena as a data source for data analysts. The dashboard has two views:
- Student’s study time based on age group and gender
- Geo location of the students
The dashboard is very helpful in analyzing a student’s performance in the class and their health condition.
You walk through the following steps:
- Configure Tableau to connect to Athena.
- Connect Tableau Desktop to Athena to build dashboard.
- Create a Tableau dashboard and publish to Tableau server.
- Analyze the Tableau dashboard.
We also review best practices and design patterns of Tableau development with Athena.
The following diagram illustrates the architecture of this solution.

Prerequisites
You need the following prerequisites before you can proceed with solution:
- Pre-installed Tableau Server.
- Install this in the same network where you install Tableau Server.
- An Amazon Simple Storage Service (Amazon S3) bucket and prefix. For instructions, see Creating a folder.
- An access key ID and secret access key with the AWS Identity and Access Management (IAM) user. For more information, see IAM users and Programmatic access.
Configuring Tableau to connect to Athena
Athena connects to Tableau via an Athena JDBC driver. Complete the following configuration steps:
- Install the appropriate version of 64-bit Java. A minimum JDK 7.0 (Java 1.7) is required.
- Download the JDBC driver (.jar) file that matches with your version of the JDK.
- Move the downloaded .jar file to the following location, based on your operating system:
- For Windows, use
C:\Program Files\Tableau\Drivers. - For Mac, use
~/Library/Tableau/Drivers location.
- For Windows, use
Setting up Athena
For this use case, you create an Athena table called student that points to a student-db.csv file in an S3 bucket. Additionally, you create the view student_view on top of the student table. You build the Tableau dashboard using this view. You expose only a subset of columns from the student table in the view.
You can download the Athena DDL (student.sql and student_view.sql) and data file student-db.csv from GitHub repo.
- On the Amazon S3 console, upload the student-db.csv file in the S3 bucket you created as a prerequisite.

- On the Athena console, use the following DDL statement in the query editor to create your
studentdbdatabase:
For more information, see Creating Databases in Athena.
- Choose the
studentdbdatabase and use the following DDL statement to create the student table (provide the name of your S3 bucket):
- Use the following DDL statement to create the
student_viewview. This creates an Athena view with a limited number of fields to build the Tableau dashboard.
Now if you query student_view on the Athena console with a select * SQL statement, you can see the following output.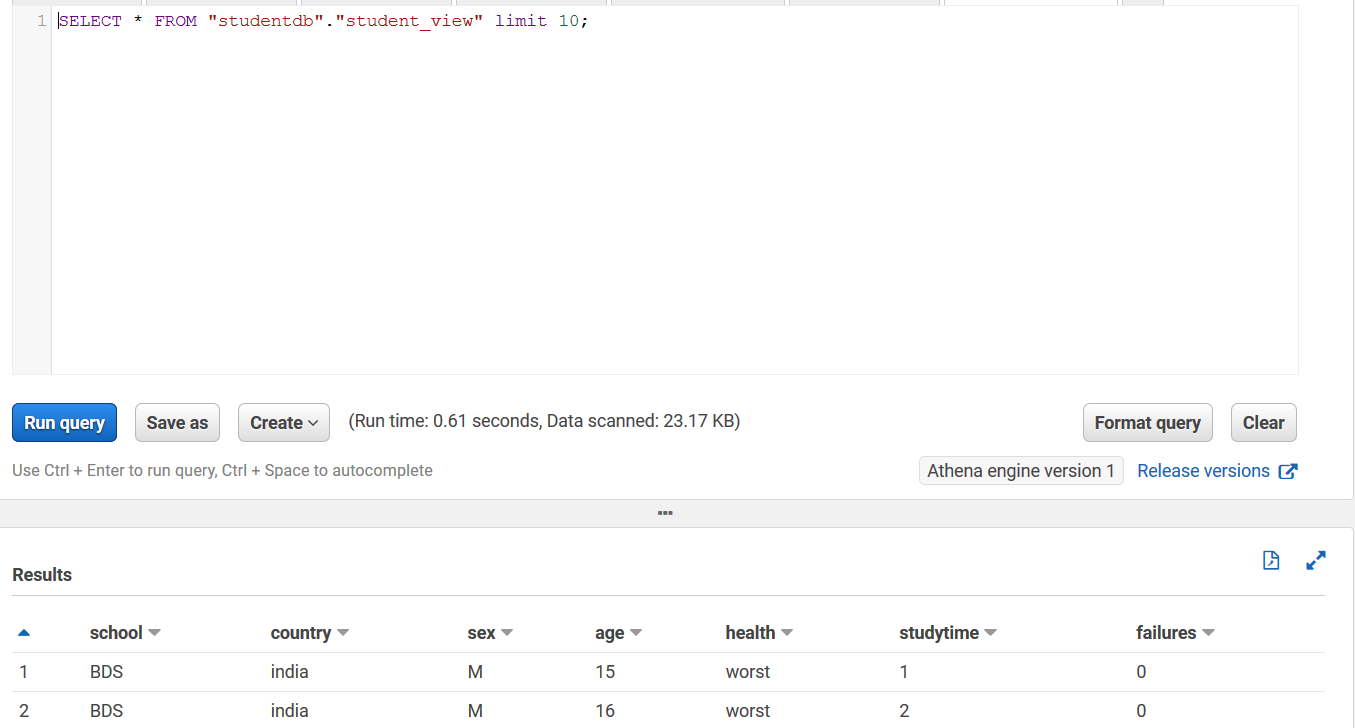
Connecting Tableau Desktop to Athena
Athena connects to Tableau via a JDBC driver. With the Amazon Athena connector, you can quickly and directly connect Tableau to their Amazon S3 data for fast discovery and analysis, with drag-and-drop ease. Tableau Desktop is used to create worksheets, dashboards, stories connecting to data sources which can be files or server.
In this section, you connect Tableau Desktop to Athena.
- Open Tableau Desktop.
- On the navigation pane, choose More.
- Choose Amazon Athena.

- For Server, enter
athena <region>.amazonaws.com.
Use the Region that you’re using to set up the Athena table and view. For more information, see Amazon Athena endpoints and quotas.
- For Port, enter 443.
- For S3 Staging Directory, enter the path of the Amazon S3 location where you want to store query results.
The path is available on the Settings page on the Athena console, under Query result location.

- For Access Key ID and Secret Access Key, enter the appropriate values.

After you sign in, you create a dashboard by selecting your database and available table or view.
- Choose student_view.
- Drag and drop this view as a data source.

- Create the worksheet country-wise, as per the configuration in the following screenshot.

- Create another worksheet called
age-wise.

- On the Dashboard menu, choose New Dashboard.
- Drag and drop
country-wiseandage-wise.

You have created a Tableau dashboard successfully, your data is in Athena, and you’re ready to share it with the rest of your organization by publishing the dashboard. Before you publish, you need to configure the plan to refresh the Athena data sources used by the Tableau dashboard.
Two options are available:
- Live connection – A Tableau live connection offers real-time updates, with any changes in the data source reflecting immediately in Tableau.
- Data extract – Data extracts are snapshots of data optimized into system memory to be quickly recalled for visualization. Extracts are likely to be much faster than live connections, especially in complex visualizations with large datasets, filters, calculations, and so on. For more information, see Refresh Extracts.
- On the Server menu, choose Publish Workbook.

After you share the link with end-users, they can view the dashboard.

The Tableau dashboard run and refresh creates a query in Athena for each visualization. To view the query, choose the History tab on the Athena console.

The following code is the query generated from the country-wise visualization:
The following code is the query generated from the age-wise visualization:
Analyzing the Athena query runtime
The Tableau dashboard is a collection of several views and visualizations. The dashboard runtime depends on many factors, including:
- Database query execution time
- Data transfer time
- Dashboard visualization rendering time
- Number of visualizations, filters, data volume, total number of fields, number of rows, KPI calculation complexity, custom scripts runtime, and so on.
- Number of concurrent users
- Workload and Tableau Server sizing
Each Tableau dashboard visualization generates an Athena query. Each query that runs is known as a query execution. The query execution has a unique identifier known as the query ID or query execution ID. You can identify Tableau dashboard queries on the Athena console using query IDs. The query IDs for Tableau queries can be found from the driver logs. For more information, see Enable Driver Logging for Amazon Athena Using a .properties File.
You can further check the query runtime on the Athena console. On the History tab, search for the query with the query ID. The following screenshot shows the search results for the student age query.

The following screenshot shows the search results for the student country query.

In this use case, you have two queries from two visualizations. Both queries start at the same time, and the query runtime is 1.22 seconds.
Best practices on Athena to Tableau integration
The following best practices may be useful as you build Tableau dashboards on Athena:
- There may be use cases where you want to create complex queries as views by joining multiple tables in Athena. You use these queries in Tableau to build the dashboard. The runtime of these views can take a while to complete because it depends on the underlying complexity of the view, such as the number of joins and filters. This isn’t ideal for live database connections, but it works well in a data extract model where you can refresh the data in Tableau on a schedule.
- By using views and extracts, you can also minimize Athena costs. You only run the query one time during extraction and then publish the extract to Tableau. This means you can be efficient in leveraging the Tableau Hyper engine while minimizing your costs in Athena.
- Tableau data extract provides performance benefits, but there are situations where you need live data. In this case, data extract isn’t an option, and you can choose Tableau live connection.
- You can partition your dataset. Partitioning divides your table into parts and keeps the related data together based on column values such as date, country, and region. Data partition restricts the amount of data scanned by each query, thereby improving performance and reducing cost.
- Rather than query the CSVs directly in Athena, you can write the data to Amazon S3 as Apache Parquet or Apache ORC files, which is an optimized columnar format that is ideal for analytic queries. For more information about performance tuning, see Top 10 Performance Tuning Tips for Amazon Athena.
- You can convert your existing data to Parquet or ORC using Apache Spark or Apache Hive on Amazon EMR or AWS Glue. For more information, see Analyzing Data in S3 using Amazon Athena. See also the following resources:
- Build a Data Lake Foundation with AWS Glue and Amazon S3 (blog post)
- aws-blog-spark-parquet-conversion (Spark GitHub repo)
- Converting to Columnar Formats (using Hive for conversion)
- You can also use the Athena Create Table As feature to convert to Parquet format. The following query converts the student CSV data to Parquet and creates a
student_parquettable (provide the S3 bucket name where you want to store the Parquet file):
The following table compares query data scanning and run times between the two Athena tables.
| Table | Query | Data Scanned | Runtime |
| student | SELECT * FROM "studentdb"."student"; |
23.17 KB | 0.63 seconds |
| student_parquet | SELECT * FROM "studentdb"."student_parquet"; |
1.93 KB | 0.49 seconds |
- Using Athena to query small data files (generally less than 128 MB) can degrade query performance. For more information, see Top 10 Performance Tuning Tips for Amazon Athena.
The following best practices may be useful as you deploy Tableau Server on AWS:
- Choose the right Amazon Elastic Compute Cloud (Amazon EC2) instance type based on your workload. A total of 8 CPU cores (16 AWS vCPUs) and 64 GB RAM are recommended for a single production EC2 instance. The typical EC2 instance types to use for Tableau Server is C5.4xlarge, m5.4xlarge, and r5.4xlarge.
- You should test your workload to check any performance bottleneck due to CPU. You can use a different set of Tableau dashboards to check the performance and add more CPU as required.
- EC2 instances with insufficient RAM may cancel out the benefit of high-end CPU. You should choose to run with 64+ GB RAM for production workloads. Although it’s important to choose an instance with sufficient CPU, running Tableau Server on instances starved for RAM may lead to degraded performance.
- Tableau Server has several processes and components, including a database (PostgreSQL) that stores the system’s metadata. Tableau Server needs a high level of disk throughput in order to perform well, and it’s recommended to use Amazon Elastic Block Store (Amazon EBS) SSD (gp2) or provisioned IOPS volumes. Magnetic disks are not recommended. Provision a minimum 30–50 GB volume for the operating system and over 100 GB for Tableau Server.
For more information, see Optimizing Performance of Tableau Server on AWS.
If you have Tableau client and server deployments, you can use Athena to directly connect to data lakes in Amazon S3 and pull the latest information on dashboards, either via a live connection or with an extract. QuickSight offers similar capabilities, with the option of direct connection to Athena, or via periodic refresh of data into SPICE. SPICE is a high-performance in-memory data store that natively provides high concurrency and high availability without the need for any server sizing, setup, or management. QuickSight also provides centralized, AWS native IAM-based control over access to Athena, which removes the need to store individual user credentials in client software on individual user machines.
Cleaning up
To avoid incurring future charges, delete the data file from the S3 bucket.
- On the Amazon S3 console, choose the bucket where you uploaded student-db.csv.
- Select student-db.csv.
- On the Actions menu, choose Delete.

Conclusion
In this post, you’ve seen how to connect Tableau to Athena and start gaining insights into data. This post also discussed the best practices when building a Tableau dashboard on Athena.
About the Author
 Dhiraj Thakur is a Solutions Architect with Amazon Web Services. He works with AWS customers and partners to provide guidance on enterprise cloud adoption, migration and strategy. He is passionate about technology and enjoys building and experimenting in Analytics and AI/ML space.