AWS Database Blog
Deliver Amazon RDS Performance Insights counter metrics to a third-party Application Performance Monitoring service provider using Amazon CloudWatch Metrics Stream
This blog post was last reviewed or updated May, 2023.
The updated version shown below is based on working backwards from a customer need to use RDS Performance Insights metrics in their APM tool for database observability.
Amazon RDS Performance Insights is a feature that monitors Amazon Relational Database Service (Amazon RDS) database instances so that you can analyze and troubleshoot database performance. You can view Performance Insights data in the AWS Management Console. Alternatively, Performance Insights provides a public API so that you can query your own data. You can use this API to ingest data, to add Performance Insights data to existing monitoring dashboards, or to build your own monitoring tools.
Application performance monitoring (APM) is the practice of tracking key software application performance metrics using monitoring software and telemetry data. Practitioners use APM to ensure system availability, optimize service performance and response times, and improve user experiences. Dynatrace, Datadog, New Relic are some examples of widely used APM tools.
Amazon CloudWatch metric streams can be used to continually stream Amazon CloudWatch metrics to a destination of your choice, with near-real-time delivery and low latency. Supported destinations include AWS destinations such as Amazon Simple Storage Service (Amazon S3), an http endpoint, and several third-party service provider destinations.
In this post we use Amazon Performance Insights API and AWS Lambda to send database metrics to Amazon CloudWatch metrics stream setup with an http endpoint as a proxy for your APM destination. This workflow will allow for streaming your Amazon Performance Insights database metrics to your APM system.
Overview
Performance Insights collects a variety of operating system and database counter metrics to help monitor system performance. Each Amazon RDS database engine has its own particular set of counter metrics, such as the Aurora metrics. Although you should begin troubleshooting database performance by determining where your database time is going, counter metrics are an excellent secondary source of monitoring data. They can be useful when integrated into an existing system dashboard.
This post is intended for anyone interested in database counter metrics. We introduce one of the six Amazon Performance Insights API methods, GetResourceMetrics, to demonstrate how to create an AWS Lambda function that extracts that data from Performance Insights and integrates it into another monitoring system. In this post, we use Boto3, Python3, the AWS CLI, and the Performance Insights API. To start, either create an Amazon RDS instance with Amazon Performance Insights enabled or enable Performance Insights on an existing instance.
AWS provides service functionality through public APIs as often as possible to empower customers to build their own solutions. Performance Insights is no different. Although you can interact with the service through the provided console, the API is designed to give you access to your own data.
The Amazon Performance Insights dashboard (shown in the following screenshot) is divided into three parts:
- Counter metrics chart: Shows data for specific performance counter metrics.
- Average active sessions chart: Shows how the database load compares to the database instance capacity, as represented by the Max CPU.
- Top load items table: Shows the top items that are contributing to database load.
 The Amazon Performance Insights API has six actions:
- GetResourceMetrics: Retrieves a time series of metric data. This method builds the Counter Metrics chart and the Average Active Sessions chart.
- DescribeDimensionKeys: Retrieves the top metric keys over a period of time. This method builds the Top load items table.
- GetDimensionKeyDetails: Retrieves the attributes of the specified dimension group for a DB instance or data source.
- GetResourceMetaData: Retrieve the metadata for different features. For example, the metadata might indicate that a feature is turned on or off on a specific DB instance.
- ListAvailableResourceDimensions: Retrieve the dimensions that can be queried for each specified metric type on a specified DB instance.
- ListAvailableResourceMetrics: Retrieve metrics of the specified types that can be queried for a specified DB instance.
GetResourceMetrics
This post focuses on using the GetResourceMetrics method to retrieve counter metrics. Using the AWS CLI, you can see more information about this API method by running the help command.
start-time: The inclusive datetime value to specify the start of the time-series query-range. By default, Performance Insights has seven days of retention, but this time period can be extended to two years.end-time: The exclusive datetime value to query to specify the end of the time-series query range parameters.period-in-seconds: The granularity of each returned data point. Currently, this value must be one of the following: 1, 60, 300, 3600, or 86400.service-type: Helps identify the resource to query. Currently, the only valid value is RDS.identifier: Identifies the resource. This is shown in the Amazon RDS console as the ResourceID when you look at the details of your instance. It’s returned as DbiResourceId when calling the RDS DescribeDbInstances API method.metric-queriesparameter: Specifies one or more queries for which to get results. Each query consists of a mandatory Metric parameter and optional GroupBy and Filter parameters.--max-results: The maximum number of items to return in the response. If more items exist than the specifiedMaxRecordsvalue, a pagination token is included in the response so that the remaining results can be retrieved.--next-token: An optional pagination token provided by a previous request. If this parameter is specified, the response includes only records beyond the token, up to the value specified byMaxRecords.--cli-input-json: Performs service operation based on the JSON string provided. The JSON string follows the format provided by--generate-cli-skeleton. If other arguments are provided on the command line, the CLI values will override the JSON-provided values. It is not possible to pass arbitrary binary values using a JSON-provided value as the string will be taken literally.--generate-cli-skeleton: Prints a JSON skeleton to standard output without sending an API request. If provided with no value or the value input, prints a sample input JSON that can be used as an argument for--cli-input-json. If provided with the valueoutput, it validates the command inputs and returns a sample output JSON for that command.
In this post, we’ll be making simple metric queries for the last five minutes of data:
For a concrete example, see the following code. The identifier resource ID has to be changed, otherwise, this code should work as is.
Step 1: Create a basic AWS Lambda function
In the AWS Lambda console, choose Create Function, Author from Scratch.

Name: PerformanceInsightsCounterMetrics
Runtime: Python 3.9
Roles: Create a new role from one or more templates.
Role name: PerformanceInsightsCounterMetricsRole
Leave Policy templates blank.

Finally, to avoid any timeout issues, go to General Configuration on the function and select Edit to go to Basic Settings; update Timeout to 1 minute.
Schedule the function
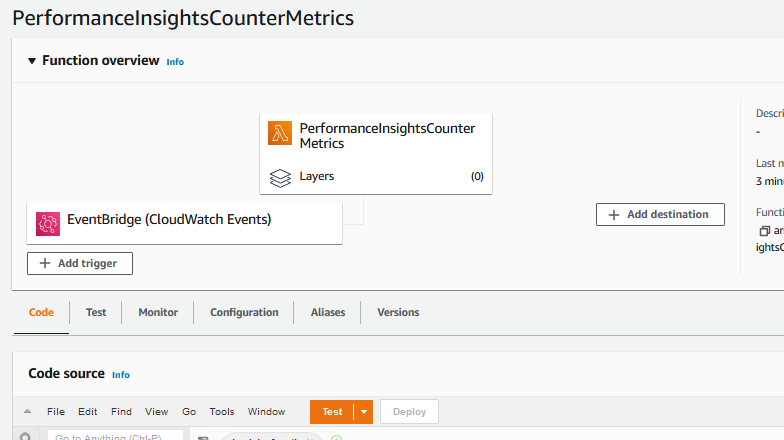
After creating the Lambda function, you see the configuration. Lambda functions can be triggered by all kinds of events. In this case, you should run the Lambda function every five minutes.
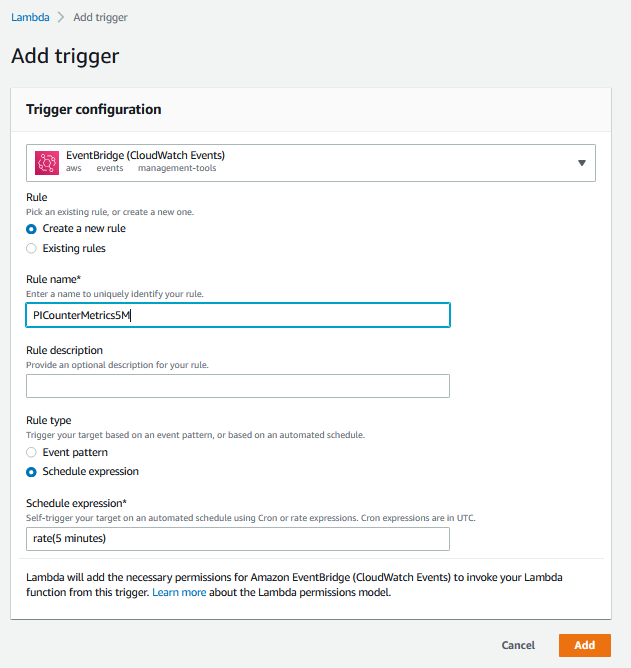
Select Add Trigger on the Lambda function.

CloudWatch Events has a scheduling pattern that you can use to accomplish this goal.
Use the following options to create a new rule:
Rule Type: Event Bridge (CloudWatch Events)
Rule Name: PICounterMetrics5M
Rule Type: Schedule Expression
Schedule Expression: rate (5 minutes)
Test the function
Choose Test to create a new test event.
Event Template: Amazon CloudWatch
Name: ScheduledTest
Accept the defaults and save.

After you’ve saved these settings, you should be able to choose Test and verify that the logs printed “Hello from Lambda.”
Step 2: Update the Lambda function to call the Performance Insights API
You’ve now created a basic Lambda function that doesn’t do anything. Your goal in this step is to call the Performance Insights API and print some counter metrics.
Find the database resource ID
Find your database resource ID in the RDS console by selecting your instance and viewing it in the Configuration tab. The name should start with “db-”. In this case, my instance ID is db-YTDU5J5V66X7CXSCVDFD2V3SZM.
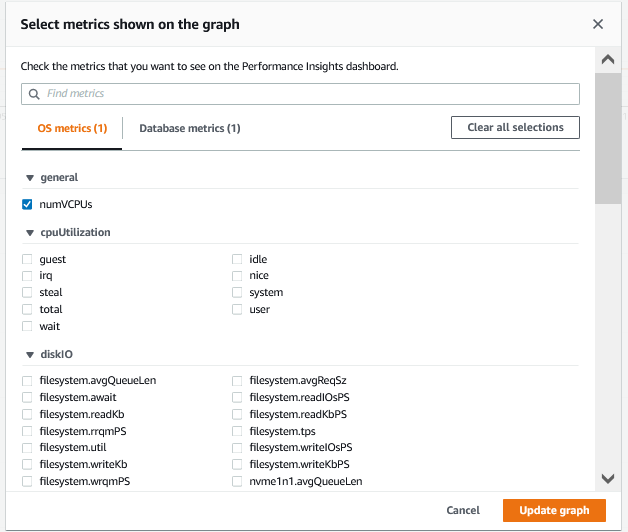
Find the metrics to query
On the Performance Insights Counter Metrics page, you can configure the displayed metrics by selecting the configure widget, as shown in the following screenshot. To start, query for an OS metric, os.general.numVCPUs, because that value should be relatively constant. When you issue a query, combine a metric name with a statistic. In this case, you are querying for the average, so use os.general.numVCPUs.avg.
Update the Lambda function IAM role
In IAM, find the PerformanceInsightsCounterMetricsRole that you created. Add permissions to call the Performance Insights API by creating and adding a PerformanceInsightsResourceMetricsAccess policy with the following permissions policy:

Update the Lambda function with the following code:
Running the Lambda function again should produce a successful response, and the logs should contain a response body, as shown in the following screenshot.

The response contains the following fields:
AlignedStartTime/AlignedEndTime: The queriedStartTime/EndTime, transformed to align to a granularity. Performance Insights pre-computes summaries of database activity over particular periods (which is why two-year retention is an option), but that means that you can’t query for arbitrary spans of time.Identifier: TheDbiResourceIdpassed in as a query parameter.MetricList: One entry for every passed-inMetricQuery(in this example, I only had one), with every response containing a Key and a list ofDataPoints.
Step 3: Update the Lambda function to integrate with the RDS API and send multiple counter metrics
In this step, you will update the Lambda function to send multiple counter metrics and send data from all Performance Insights-enabled Amazon RDS instances.
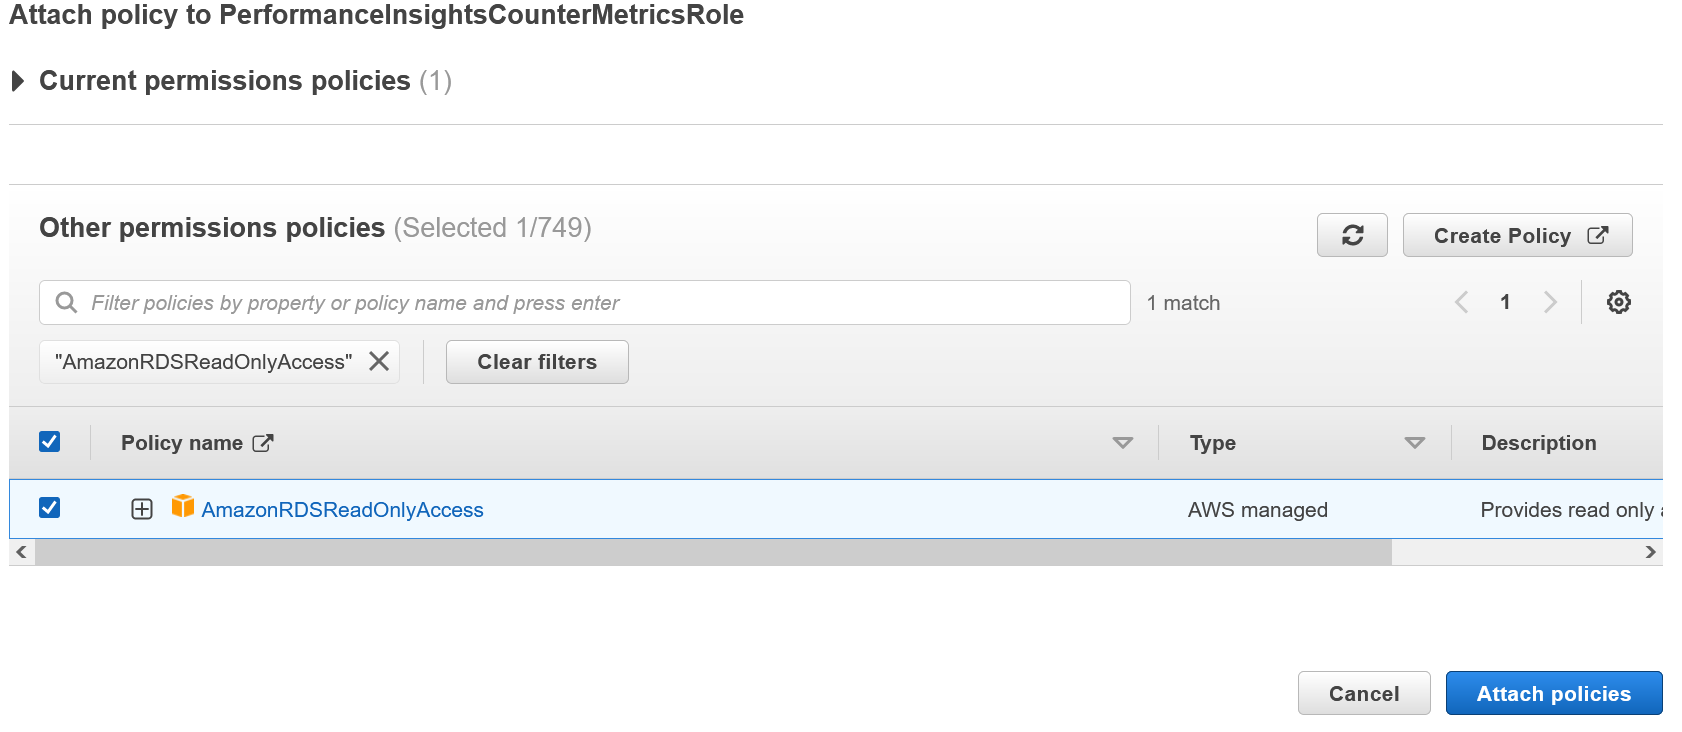
Update the Lambda function to add permission to call the RDS API
From the IAM console, select the PerformanceInsightsCounterMetricsRole and attach the AmazonRDSReadOnlyAccess policy.
Update the Lambda function with the following code:
The top of the code block defines an engine_metrics dictionary that maps an engine name to a list of metrics for that engine. You can customize the map to control exactly which counter metrics to deliver.
Step 4: Update the Lambda function to send the Performance Insights data to CloudWatch
The final step is to update the Lambda function to send the Performance Insights data to CloudWatch.
From the IAM console, select the PerformanceInsightsCounterMetricsRole and attach CloudWatchFullAccess permissions.

The Lambda function will call PutMetricData with the following key parameters:
-
Namespace:Use PerformanceInsights.Dimensions:Add the InstanceId as a dimension.MetricName/Value/Timestamp:Use the values that I get back from the Performance Insights API.
Updated Lambda code:
After updating the code, test it again with the ScheduledTest event to make sure it runs properly.
View data in CloudWatch
And you’re done! Back in CloudWatch, you should see a new custom namespace called PerformanceInsights, as shown in the following screenshot, along with the new metrics that you added.
 Step 5: Create a metric stream to continually stream CloudWatch metrics to a third-party APM service provider
You can use metric streams to continually stream CloudWatch metrics to a destination of your choice, with near-real-time delivery and low latency. Supported destinations include AWS destinations such as Amazon Simple Storage Service and several third-party service provider destinations.
There are two main usage scenarios for CloudWatch metric streams:
- Data lake— Create a metric stream and direct it to an Amazon Kinesis Data Firehose delivery stream that delivers your CloudWatch metrics to a data lake such as Amazon S3. This enables you to continually update monitoring data, or to combine this CloudWatch metric data with billing and performance data to create rich datasets. You can then use tools such as Amazon Athena to get insight into cost optimization, resource performance, and resource utilization.
- Third-party providers— Use third-party service providers to monitor, troubleshoot, and analyze your applications using the streamed CloudWatch data.
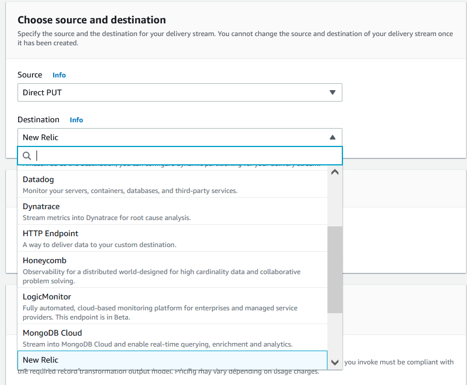
Note that Kinesis Data Firehose can send data records to various destinations, including Amazon S3, Amazon Redshift, Amazon OpenSearch Service, and any HTTP endpoint that is owned by you or any of your third-party service providers. The following are the supported destinations: Amazon OpenSearch Service, Amazon S3, Datadog, Dynatrace, Honeycomb, HTTP Endpoint, LogicMonitor, MongoDB Cloud, New Relic, Splunk, and Sumo Logic
Step 5.1: Create a Kinesis Data Firehose Delivery Stream that will be used for delivering metrics to a third-party service http endpoint
In this step, you will use the Third-party providers option to create a delivery stream that will deliver CloudWatch metrics to a third-party provider. You will see how to use Dynatrace HTTP endpoint details below but the procedure is the same with other destinations.
Go to Amazon Kinesis dashboard and select Create Delivery Stream.

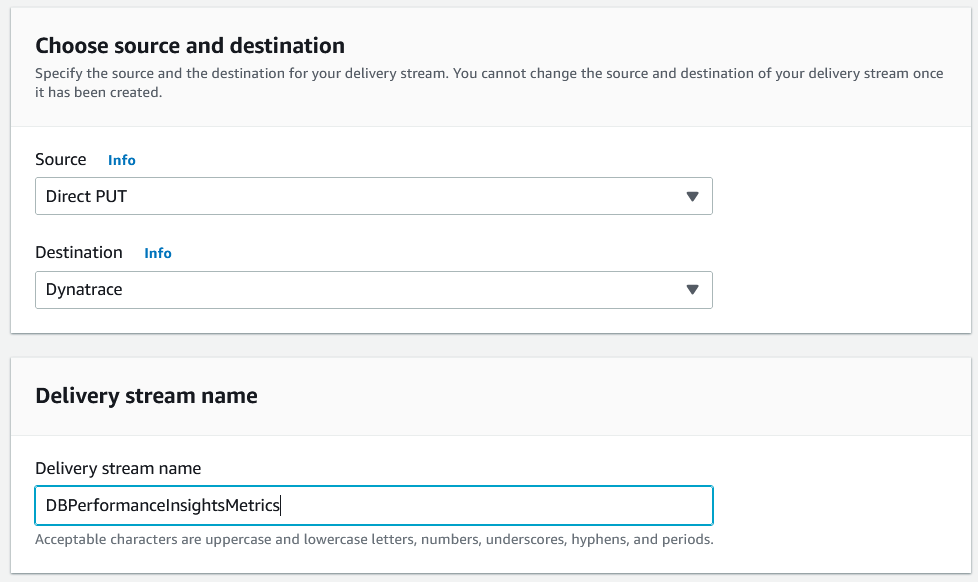
Choose source and destination
For source, you need to select “Direct PUT” as this option will setup a Kinesis Data Firehose delivery stream that producer applications (CloudWatch metrics stream in your case) write to directly.
For destination, you need to select “Dynatrace” – you can select other APM destinations too that will prompt for the same http destination information. Set the name of the delivery stream to “DBPerformanceInsightsMetrics”.
Use the default option of no transformation for Transform records option.
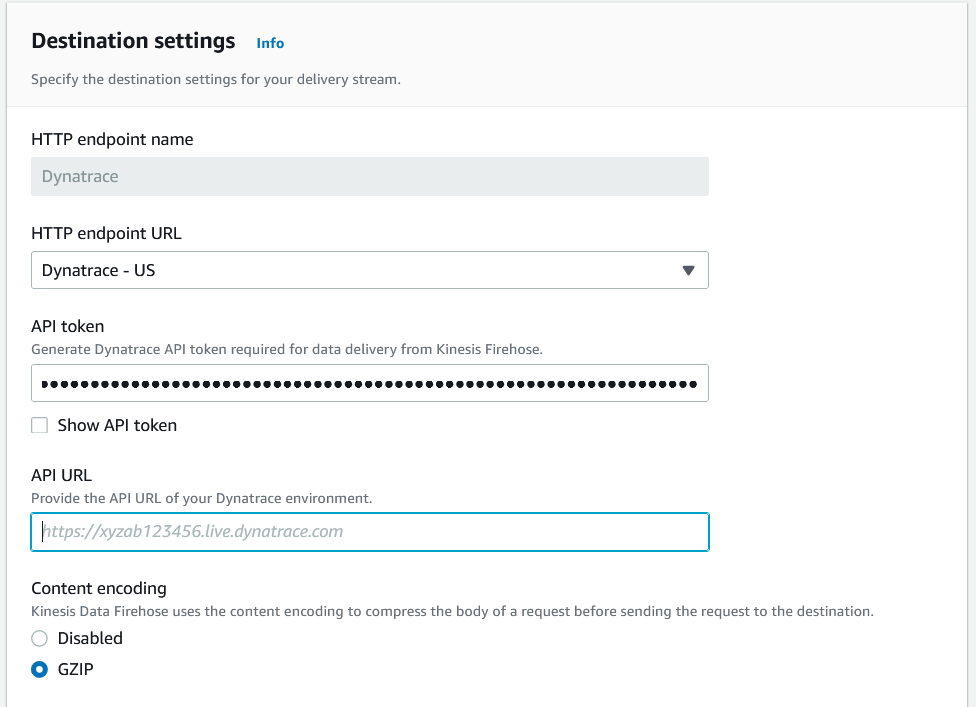
Setup your destination settings with your Dynatrace API token and your API URL
Consult your SaaS APM documentation for collecting values for these input parameters.
Update your backup setting for this delivery stream
Enabling source data backup ensures that the data can be recovered if record processing transformation does not produce the desired results.

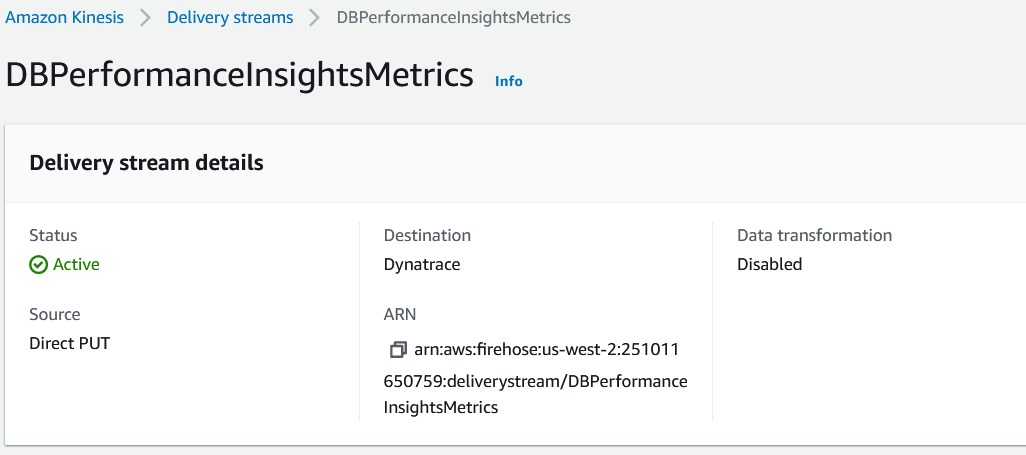
Once the delivery stream is created, its status will turn active.
Step 5.2: In this last step, you will create a CloudWatch metric stream to send the CloudWatch metrics to the AWS Kinesis Date Firehose delivery stream
Go to CloudWatch Metric Streams to create a new metrics stream as shown below.
Setup your metrics to be streamed
Pick “Selected namespaces” and chose “DBPerformanceInsights” namespace you already created.

Select the newly created Kinesis Firehose in the configuration section.

Use “DBPerformanceInsightsMetricsStream” for the new metrics stream name and defaults for the other options before creating the metrics stream.

And you’re done! Now that everything is setup, the metrics will begin streaming to the setup http destination (Dynatrace in this example above). You need to login to your APM SaaS tool to use and explore the Performance Insights metrics in your APM tool.
Note: Multiple third-party APM service providers are supported for Kinesis Delivery Stream as show below.
Clean up
To avoid incurring future charges, delete the following resources:
- Lambda function
PerformanceInsightsCounterMetrics - CloudWatch event
PICounterMetrics5M - IAM Role
PerformanceInsightsCounterMetricsRole - Kinesis Firehose Delivery Stream
DBPerformanceInsightsMetrics - CloudWatch metric Streams and S3 bucket for failed data.
Conclusion
In this post, we showed you how to connect the Performance Insights API to a Lambda function to insert Performance Insights counter metrics into CloudWatch. Once the Performance Insights counter metrics are in CloudWatch, we also showed how to setup a CloudWatch metrics stream with a Kinesis Date Firehose delivery stream to deliver the database metrics to an http destination of your choice. We showed you how this setup will allow you to observe these metrics in your APM tool. Finally, we listed multiple third-party service provider destinations that you can use when creating a Kineses delivery stream.
Full end-to-end observability enables organizations to get to the bottom of application performance issues faster. Performance Insights offers a rolling seven days of performance data history at no charge. This is enough time to troubleshoot a wide variety of issues. Go enable Performane Insights and deliver database metrics to your APM solution to increase your system’s observability. Use AWS pricing calculator to estimate the cost of implementing a solution delivered in this post.
In our next blog post we plan to further discuss the Performance Insights API and infrastructure as code for services used in this guide.
We would love to hear from you. Let us know what you think in the comments section.
About the Authors
 Andrew McNair is a senior software engineer with the RDS at Amazon Web Services. His team created Performance Insights to help customers better understand their database performance.
 Anand Komandooru is a senior cloud architect with ProServe at Amazon Web Services. His team helps AWS customers realize their vision with cloud scale readiness.
 Noorul Hasan is a DB Migrations Consultant with ProServe at Amazon Web Services. His team helps AWS customers to migrate and modernize their workloads to AWS cloud.
 Shankar Padmanabhuni is a Senior Database Consultant with ProServe at Amazon Web Services. His team helps AWS customers to modernize, architect, and build highly scalable cloud-native applications on AWS.
 Rolando is a Senior Cloud Application Architect with ProServe at Amazon Web Services. He helps customers to migrate and modernize workloads on AWS, with special focus on modern application development and architecture best practices.
 Shiva Vaidyanathan is a Senior Cloud Infrastructure Architect at AWS. He provides technical guidance, design and lead implementation projects to customers ensuring their success on AWS. Prior to joining AWS, he has worked on several research projects on how to perform secure computing in public cloud infrastructures. He holds a MS in Computer Science from Rutgers University and a MS in Electrical Engineering from New York University.