AWS Partner Network (APN) Blog
How Indexima Uses Hyper Indexes and Machine Learning to Enable Instant Analytics on Amazon S3
By Darragh O’Flanagan, Sr. Partner Solutions Architect at AWS
By Florent Voignier, Co-Founder & CTO at Indexima
 |
Achieving “speed of thought” or instant analytics on large data sets is a key challenge for business intelligence (BI) platforms.
Modern interactive data visualizations created with BI tooling can generate complex queries and aggregations as the data is diced and sliced across many filtered dimensions. When applied to large data sets, however, the resulting query performance often takes too long for the visualizations to remain viable.
Traditionally, data engineers would design and deliver an optimized, aggregated subset of the data to a data warehouse like Amazon Redshift to drive the visualization. This can often take weeks of development and testing or incur significant infrastructure costs.
In this post, we will discuss how AWS Partner Indexima uses machine learning (ML) and hyper indexes to automate this process and accelerate analytics by up to 1000x across a full data set on Amazon Simple Storage Service (Amazon S3).
We’ll use the NY Taxi Trip Record public dataset available on Amazon S3, through the open data registry. This dataset contains data of trips taken by taxis and vehicles for hire in New York City. We will query 30Gb of .csv files with 170 million rows as sample data for our analysis.
Analysis Overview
The diagram below shows how we’ll first create and evaluate for performance, a visualization in Tableau that queries data in Amazon S3 using Amazon Athena.
We will then use Indexima optimization to create hyper indexes with a pretrained machine learning model and compare the resulting query performance.
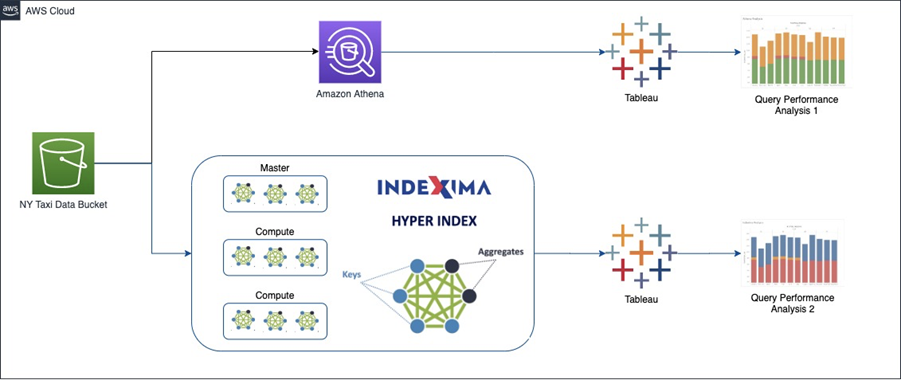
Figure 1 – Indexima creates in-memory hyper indexes.
Prerequisites
For this walkthrough, you should have the following prerequisites:
- AWS account.
- Access to the AWS Management Console with permissions to manage applications (access to Amazon Athena and S3 buckets).
- Tableau desktop installed locally. A free trial is available.
- An AWS Identity and Access Management (IAM) user with AWS credentials for connecting to Amazon Athena. See the documentation for instructions.
Step 1: Copy Dataset to Amazon S3
The data for this walkthrough is publicly available in the bucket s3://nyc-tlc/trip data/. We will copy the Yellow Trip data to our bucket for analysis.
- Open the AWS CloudShell console in your preferred region.
- Create a bucket to store the data we’ll use for analysis, and replace <BUCKET_NAME> with a suitable name for the data.
aws s3 mb s3://<BUCKET_NAME>
- Use the following command to copy the data to our bucket. Data transfer may take about 10 minutes.
aws s3 cp "s3://nyc-tlc/trip data/" \
s3://<BUCKET_NAME>/blog-aws/nyc_csv/ --recursive --exclude "*" \
--include "yellow_tripdata_2010*"
Step 2: Analyze Query Performance with Tableau and Athena
- Open the Amazon Athena console in the same region as your S3 bucket.
- In the query editor, paste the following code to create an external table with the dataset in the S3 bucket. Replace <BUCKET_NAME> with the name of the bucket you created.
Open Tableau Desktop and connect to the Athena database. If you’ve not already done so, it will be necessary to download the JDBC driver for Athena.
In the connection details, ensure the Athena region is correct. In the Amazon Athena console, choose Settings to identify the query results bucket. Add your AWS credentials and Sign In.

Figure 2 – Connect Tableau to your Athena endpoint.
- Once connected, choose:
- Catalog: AwsDataCatalog
- Database: sampledb
- Table: nyc_csv
- Click “Update Now” and open the worksheet.
- Next, create a dashboard called “Trip Count by Vendor Name and Period.” This will generate queries to Athena across the whole dataset which we can analyze.
- Drag “Trip Pickup Datetime” to the Columns shelf three times and set the periods to year, quarter, and month.
- Drag “Vendor Name” to the Marks section.
- Drag the measure nyc_csv (Count) to the Rows section.
- From the chart options on the right, choose Stacked Bars and exclude any null columns from the visualization.
- The result should look something like the workbook below.

Figure 3 – Trip count by vendor and period 1.
In the Athena console, choose History to see the query analysis. This shows the run times for each of the queries that drive the visualization.
We can see ranges between 9.01 to 4.7 seconds of response time on a data set of 169 million of rows over 28Gb of data.

Figure 4 – Athena query performance.
Step 2: Create an IAM Role for Indexima
You must create an IAM role before you can launch an instance with that role or attach it. Indexima needs access to the S3 bucket and permission to manage Amazon Elastic Compute Cloud (Amazon EC2) instances as part of the cluster.
To create an IAM role using the console:
- Open the AWS IAM console.
- In the navigation pane, choose Roles, Create role.
- On the Select role type page, choose EC2 and the EC2 use case. Choose Next: Permissions.
- Choose Create policy to open the policy creation tab.
- Open the JSON editor and paste the following policy, replacing the bucket name with the name of your bucket.
- On the Review page, enter the name “IndeximaPolicy” for the policy and choose Create policy.
- Return to the Create role tab and refresh the policy list and find and check the newly created policy.
- Choose Next: Add Tags.
- Choose Next: Review.
- Name the role “IndeximaRole” and choose Create role.
Step 3: Install and Configure Indexima Trial
Select “INDEXIMA Analytics Engine (Multi Node Edition)” from AWS Marketplace. Note the Indexima installation is a free trial, but there will be AWS charges for the EC2 infrastructure running the cluster.
- Click on Continue to Subscribe.
- Click on Continue to Configuration.
- Choose the Region where your data are stored and click on Continue to Launch.
- Select the action “Launch CloudFormation” and click on the Launch button.
- On the CloudFormation interface, click Next.
- On the Specify stack details page:
- Enter a stack name: Indexima
- Select a VPC and a public subnet.
- Select a key pair; if you do not already have a key pair, see the documentation.
- Enter a CIDR block that’s permitted to SSH to the Indexima Cluster. Example: 0.0.0.0/0 for access everywhere.
- Enter the name of the S3 bucket we created in Step 1.
- Enter an S3 path for Indexima to create the warehouse. Example: indexima-warehouse.
- IAM role: IndeximaRole
- Cluster size: Large–1-ui-1-zoo-1-master-7-worker
- Create a password.
- Choose Next, Next to review.
- On the Review page, scroll down, tick the box “I acknowledge that AWS CloudFormation might create IAM resources” and Create Stack.
- Open the AWS CloudFormation console and choose the Indexima stack. In the Outputs section, note the IP address from the HIVE_URL and the IndeximaUI HTTP URL which can be used to access the administration console.
- Open the Indexima UI HTTP URL in a web browser to access the administration panel. Log in with the username: admin and the password created above.
- Choose: Workbooks, Create a Workbook and choose a name [NYC Yellow Cab].
- On the SQL interface, copy and paste the following command to create the nyc_csv table:
- On the SQL interface, copy and paste the following command to index the data. This process will take some minutes. Replace <BUCKET_NAME> with the name of the bucket you created.
When complete, choose Schema: default , nyc_csv to see the Indexima metadata. We are now ready to connect Tableau to Indexima. We can see Indexima is aware of the 169 million rows.
Step 4: Connect Tableau to Indexima and Create the Visualization
- Open Tableau Desktop and connect with Cloudera Hadoop. Indexima uses a HiveServer2 connection. If you haven’t already done so, it will be necessary to download the ODBC driver for Cloudera.
- In the server section, enter the IP address from the HIVE_URL noted from the previous section. Use the username admin and Indexima password from the CloudFormation launch. Transport should be SASL.
- Choose Sign In.

Figure 5 – Connect Tableau to Indexima.
- Once connected, enter “default” into the schema search and choose Table: nyc_csv.
- Click Update Now and open the worksheet.
- Recreate the dashboard from Step 2 above. The stacked bar chart result should be similar or identical to the one from Step 2. Indexima is now aware of the types of queries our analysis generates and we are ready to start predicting and indexing.
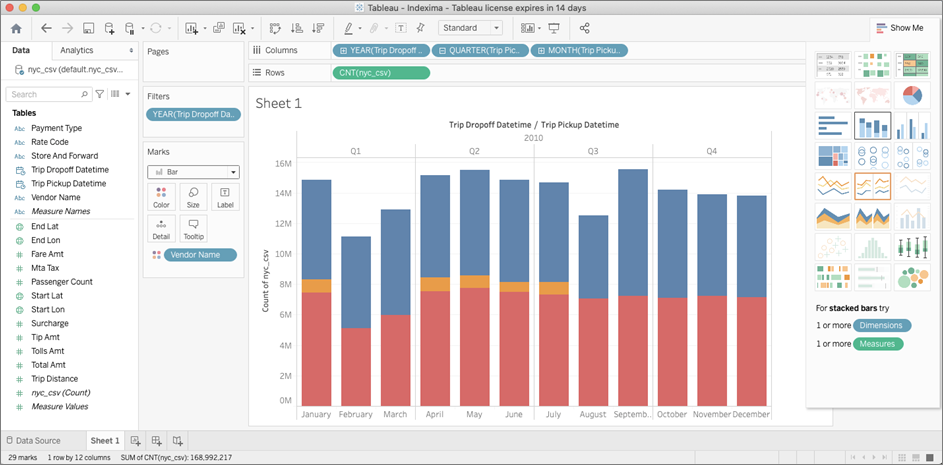
Figure 6 – Trip count by vendor and period 2.
Step 5: Enable Machine Learning and Hyper Indexing
Hyper indexes are the key elements of Indexima to achieve instant analytics on big data sets. Hyper indexes are multi-dimensional, distributed, persistent in-memory indexes. The indexes use pre-aggregation to eliminate the need for compiling OLAP cubes.
The hyper index answers queries in milliseconds regardless of the volume of data. Complex queries with “distinct count” or “top N” return instant answers without approximation. This is enabled by choosing to optimize and generate the pre-aggregation.

Figure 7 – What Indexima does.
- At the Indexima console schema overview, choose Optimize > Full Optimization. This will create the hyper indexes.

Figure 8 – Indexima dataset overview.
- In Tableau, create a new workbook and repeat the Indexima connection and dashboard analysis from Step 4. Indexima will use the hyper indexes to return the data to Tableau.
- In the Indexima console’s left menu beside the workbook name, click the link icon to monitor the queries in a new tab.
- The results as can be seen below show response times between 2ms and 33ms across 169 million rows and 28GB of data at the source. An original query taking 6.66 seconds has improved to 16ms. That’s nearly a 500x performance improvement.
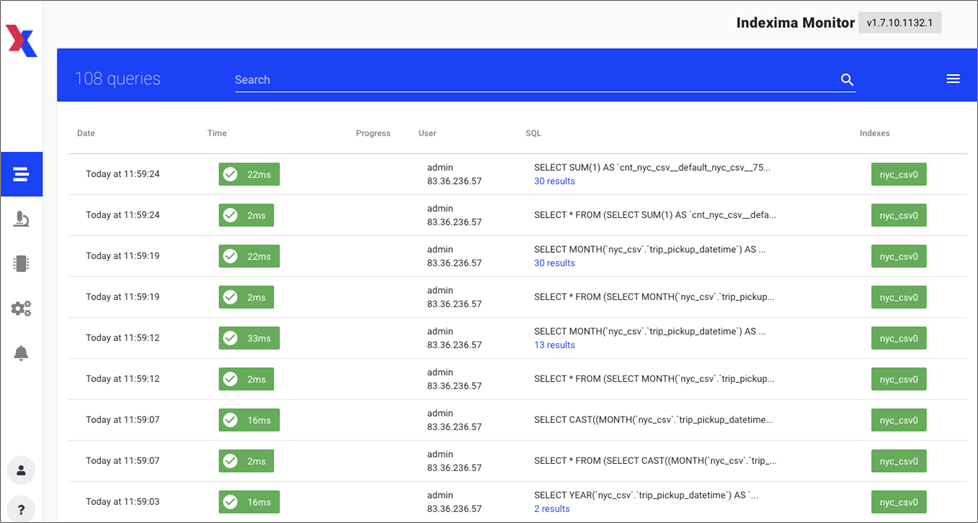
Figure 9 – Indexima query performance.
Step 6: Clean Up Resources
- Open the AWS CloudFormation console and identify the Indexima stack.
- Choose Delete Stack.
- Open the AWS CloudShell console to remove the resources in S3:
aws s3 rm s3://<BUCKET_NAME>/ --recursive
aws s3 rb s3://<BUCKET_NAME>
Cost-Performance Trade Off
The efficiency of hyper indexes means far fewer nodes are needed to deliver the performance than are needed with other big data query platforms.
Testing with Apache Spark SQL in memory on 30 billion rows shows an 1,000x increase in performance at 13th the infrastructure costs. The result can be seen below.
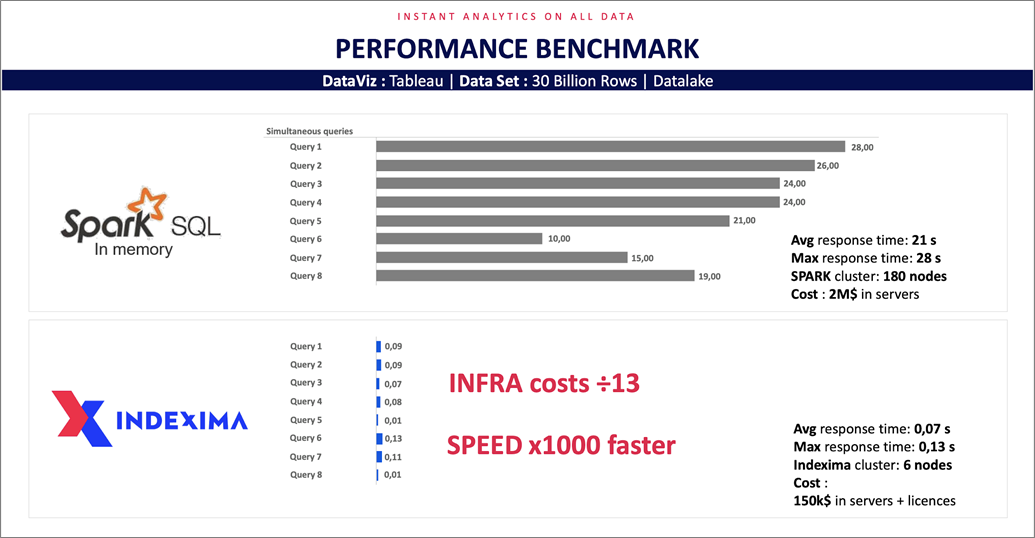
Figure 10 – Cost-performance vs. Apache Spark.
Summary
In this post, we have seen how to use Indexima machine learning and hyper indexes to enable instant analytics at any scale on Amazon S3, in just a few clicks. We also saw how Indexima optimizes the cost and performance trade-off for data analytics uses.
The AWS Marketplace solution allows organizations to query all of their data directly at the source, in volumes of tens of billions of rows in just a few milliseconds.
To learn more about the product, features, and use cases, contact the Indexima team at contact@indexima.com.
.

.
Indexima – AWS Partner Spotlight
Indexima is an AWS Partner that allows companies to access all of their data to simplify and accelerate analytics by leveraging a unique indexing engine combined with machine learning.
Contact Indexima | Partner Overview | AWS Marketplace
*Already worked with Indexima? Rate the Partner
*To review an AWS Partner, you must be a customer that has worked with them directly on a project.