AWS Partner Network (APN) Blog
How Sisense Simplifies Complex Data Analytics for Analysts and Developers
By Shashi Raina, Partner Solutions Architect at AWS
By Shruthi Panicker, Sr. Technical Product Marketing Manager at Sisense
 |
It’s well known that organizations these days are inundated with data, but the issue of data complexity is often underestimated.
Blending data from different sources is considered the most important data integration challenge in the analytics landscape today. Reports show the median number of internal sources used to support decision-making is five, while the mean number of external sources is three.
That kind of complexity, along with lagging business intelligence (BI) adoption rates and the fact that less than five percent of data gets analyzed, poses a very big question: how can businesses truly derive more value from data and build embedded data products that increase adoption?
Organizations have tried tackling these challenges by hiring large teams of highly technical people. They’ve also invested massive amounts of computing resources in traditional, rigid stacks, and custom-built dashboards, metrics, and applications that business users may need.
This approach is impractical given the high costs associated with required resources, likelihood of failure due to lack of agility, and poor adoption because the growing scale of data becomes too complex to manage. To be successful and build analytics of value, data needs to be democratized—everyone in the organization should be able to self-serve, build, and update their data dashboards and analytics applications rapidly.
In this post, we’ll discuss how engineers and analysts can handle the critical challenges of gaining insights from various large and complex data sources while also democratizing data for improved adoption across the organization.
How Sisense Helps
Given the challenges of scale and complexity of data, organizations need a comprehensive approach to deliver advanced analytics, self-service options, and embedded analytics while ensuring rapid development.
This requires the full breadth of data analytics capabilities, from building the right data pipeline to self-service BI tools and beyond. Sisense offers powerful tools to simplify complex data, build data products, and deliver insights both inside and outside an organization.
Sisense is an AWS Partner Network (APN) Advanced Technology Partner with the AWS Data & Analytics Competency and Amazon Redshift Ready designation.
The Sisense solution provides a data analytics platform tightly integrated with AWS services such as Amazon Redshift, Amazon Simple Storage Service (Amazon S3), Amazon Athena, and Amazon Relational Database Service (Amazon RDS).

Figure 1 – End-to-end analytics workflow.
The Sisense platform enables a centralized data strategy, reducing the redundancy of siloed or distributed reporting. Sisense allows product managers and R&D teams to build BI and analytic apps with a full suite of APIs and software developer kits (SDKs).
With Sisense, business users can self-serve to add a variety of data sources and build interactive dashboards with little or no IT involvement.

Figure 2 – Sisense data and analytics platform.
Sisense Solution
Most of our day-to-day work involves employing multiple applications with various datasets sitting in different databases. When analyzing this data, blending it together in a consumable fashion is a consistent challenge for users across an organization.
As a data engineer, how do you provide complex data from multiple sources in a consumable fashion to analysts, or perform advanced analysis to meet specific needs? As a business analyst, how do you leverage the power of data without going to a data engineer for every question?
Specifically, there are two areas that need attention: discoverability and performance.
There needs to be a way to store massive amounts of data and ingest relevant data for analysis while still maintaining high performance.
In the next section, we’ll look at a quick demonstration of how you can leverage the Sisense Elastic Data Hub to connect, mashup, and manage your data.
Setup
Sisense can be set up in one of many ways, depending on need and preference. It can be deployed as a single-node or multi-node Linux or Windows deployment on any cloud or on-premises environment. The Sisense on Linux deployment is built on a containerized microservices architecture that runs on Kubernetes and is the recommended platform for high-availability and scalability.
Sisense on Linux can be run on Sisense-provided Kubernetes or cloud-based Kubernetes like Amazon Elastic Kubernetes Service (Amazon EKS) and OpenShift.
Sisense on Windows can be installed using the UI-based Sisense installer with the option of using the Multi-Node Deployment Wizard. Sisense also provides a BYOL (Bring Your Own License) Amazon Machine Image (AMI) on AWS Marketplace.
In addition, Sisense can be consumed through Sisense Managed Services in any of the available configurations.
Once installed, Sisense enables analytics app builders to connect to data in one of two ways: directly using live connect, or by first pulling data into Sisense’s proprietary high-performance analytic database from a variety of sources.
In the first option, designers can connect to cloud data warehouses like Amazon Redshift or databases like SQL and MySQL. They can build visualizations with queries running directly against the underlying datastore.

Figure 3 – Amazon Redshift connector page.
Here’s an example of how it works—Finxera, a leading cloud computing payment processing company, leverages the Sisense Elastic Data Hub to have a live view into their data in Amazon Redshift. It also provides the flexibility to add other data sources, providing a consolidated view across their data.
“Sisense and AWS have helped us provide real-time analytics, by providing insight across all of our data,” says Praveer Kumar, Co-founder and CTO at Finxera.
In the second option, builders can connect to a wide range of data sources and pull data into Sisense ElastiCubes built on Sisense’s unique In-Chip technology, where each table within a single data model can come from any data source.
On cloud-native Sisense, the ElastiCube data can be stored in highly available and distributed shared storage technologies like Amazon Elastic File System (Amazon EFS) and Amazon FSx.
During ingestion, data is transformed into the Sisense columnar format. After the transformation, data from multiple sources is stored in the same format, allowing users to analyze data across sources in one unified layer.
Casumo, an online gaming platform, saw a 23x improvement in report processing time by quickly connecting Sisense to Amazon Redshift and pulling data into the ElastiCube. The easy-to-use Sisense interface eliminated over-reliance on the data team to build basic reports, with data scientists free to focus on core business competencies.
“Sisense provides us with a powerful platform that scales alongside our business as we integrate more data sources and enable all employees to have a true self-service experience,”says Emanuele Nardo, data scientist at Casumo.
Prior to the addition of a data layer between the data warehouse and end reports, it was impossible for Casumo to generate multiple reports on the same day without causing serious performance issues, which was eliminated with Sisense.

Figure 4 – Sisense data mashup and modeling interface.
Sisense Data Mashup and Modeling Layer
When using the ElastiCube engine, the Sisense data layer enables users to create relationships between tables from different data sources (data mashup) to build re-usable data models with minimal pre-aggregation or transformations.
In either option, data designers create a semantic data layer in Sisense using a drag-and-drop interface with the option to use advanced SQL capabilities when needed. The semantic layer supports the democratization of data for analysts and business users, allowing them to build visualizations without the knowledge of SQL or code.
Sisense’s data layer is decoupled from the visualization layer through dynamic run-time generation of queries. Sisense is unique because it doesn’t load the entire data model with all the joins into memory for dashboard querying. Simply put, the joins in a data model are not predefined in Sisense.
Instead, Sisense generates run-time queries optimized with a smart, machine learning-based caching mechanism to provide flexibility when it comes to analytic development, end-user interactivity, and drill-down. Only the columns and tables needed for a query at run-time are brought into memory.
For example, assume there are three tables in your data model:
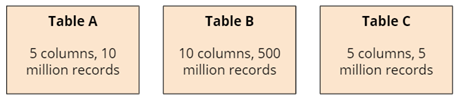
In typical BI tools, you have to produce views tied to specific dashboards, creating rigidity and inefficiency in memory utilization. You’ll only be able to answer a limited number of questions, and every change will require a technical person, time, and effort to go back and edit the underlying views.
Each view is also typically larger than their underlying tables themselves.

With Sisense, you do not have to create premeditated views and can easily bring in finer and lower levels of data into the data model.
Sisense only loads data into memory as needed for the specific query, in addition to utilizing smart caching to recycle queries across users. When utilizing the ElastiCube engine, Sisense’s In-Chip performance accelerator and columnar database provides high performance and flexibility.

Ultimately, the underlying architecture provides analysts or end users the ability to ask questions on-the-fly relating to different parts of the model (under the sanctioned security constraints in place). At the same time, they can create analytics visualizations without having to premeditate them before building the underlying data model. The same data model can also be used for multiple use cases, accelerating development.
When creating dashboards or visualizations on the front-end, builders can connect to any data model created using the Sisense data engine. Each dashboard can connect to more than one data model.
All the tables and fields from the selected models are available to build visualizations in a drag-and-drop interface. Sisense provides several quick functions to do time-series and other math functions from an out-of-the-box library.

Figure 5 – Building visualizations with the entire data model available.
Filters can be added at a formula level, widget level or dashboard level to enable slicing of the data by users. Again, every field in the data model is available for filtering.
Due the dynamic on-the-fly generation of queries and semantic data layer, end users can select slices of a visualizations to add a filter automatically (“Select”) or can drill-into any visualization (if allowed by the designer and with security constraints in place) to find their own path of exploration.

Figure 6 – Dynamic drill-into by viewers.
Sisense Elastic Data Engine Architecture
Sisense is unique in providing both live data models supported by materialized views and accelerated cached data models (through the ElastiCube).
Data Engine and Materialized Views
Data teams can transform and optimize raw data with materialized views on cloud data warehouses like Amazon Redshift with the flexibility to control the materialization schedule. Using SQL, (and soon Python and R), data teams can reduce database workloads and optimize query performance that power and scale analytics.
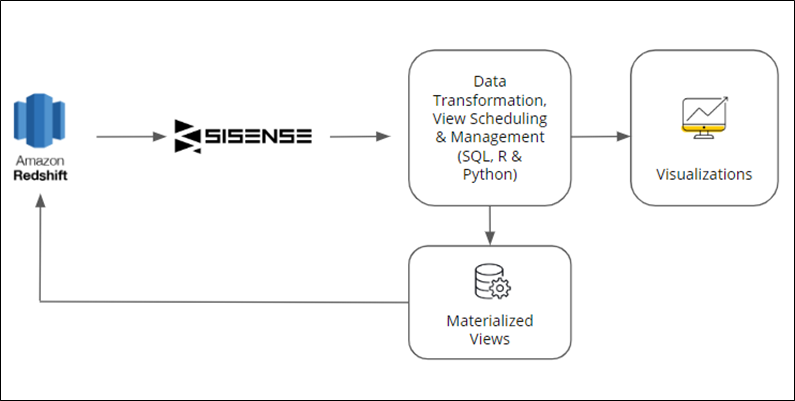
Figure 7 – Sisense data transformation and materialized views flow.
Sisense ElastiCubes
The ElastiCube engine is built on a true columnar data store and query kernel. It leverages proprietary In-Chip technology that utilizes the memory available in the CPU in addition to disk and RAM. With Sisense, calculations are performed inside the CPU without having to copy data from RAM to CPU.

Figure 8 – Layers of memory.
Sisense holds its columnar database on disk, as opposed to all in-memory. When data is ingested, it’s compressed and remains so until it reaches L1 cache. The data compression greatly improves I/O performance by reducing seek-and-transfer times, RAM performance, and in-chip analytical activity.
Summary
The Sisense platform simplifies end-to-end data and analytics, reducing time-to-insights by empowering data and IT teams to build advanced data models and perform advanced analysis for their needs. It also provides a governed layer for business teams to autonomously analyze and visualize data of any size from a unified data layer.
Sisense facilitates IT workflows to build flexible data models from any source, whether from increasingly leveraged cloud data warehouses or traditional on-premises sources.
With a wide range of database and web application connectors, data teams can perform analysis from high-performance sources like Amazon Redshift via a single user interface. They can also leverage Sisense In-Chip performance accelerator technology and Sisense Elastic Data Layer to speed up analysis from less performant data sources.
Sisense enables product and R&D teams to embed analytics into their products and build actionable apps to deliver insights at the point of decision making.
To learn more about how Sisense can enable you to build advanced data models and perform specialized analysis, try using your own data live.
.

.
Sisense – APN Partner Spotlight
Sisense is an AWS Data & Analytics Competency Partner. Its data analytics platform enables a centralized data strategy that is tightly integrated with AWS services such as Amazon Redshift.
Contact Sisense | Solution Overview | AWS Marketplace
*Already worked with Sisense? Rate this Partner
*To review an APN Partner, you must be an AWS customer that has worked with them directly on a project.