AWS Partner Network (APN) Blog
Leveling Up Your Alerting Workflow with Thundra’s Deep Instrumentation Capabilities
By Emrah Şamdan, Vice President of Product at Thundra
By Joe Norman, Partner Solutions Architect at AWS
 |
Serverless architectures allow application teams to build applications quickly, using a microservices-based approach, without worrying about any of the underlying servers. Services like AWS Lambda can scale up and down based on demand, with little to no input from developers.
This detachment from the underlying infrastructure can be freeing, but it also means you need to take a different approach monitoring, alerting, and debugging than you traditionally would.
Thundra is an AWS Partner Network (APN) Advanced Technology Partner with the AWS DevOps Competency.
Thundra’s cloud-native observability and security tool helps you test, debug, monitor, troubleshoot, and secure AWS Lambda functions, containers deployed by services like AWS Fargate, and their environments composed of managed or unmanaged services.
In this post, we’ll go through a sample alerting scenario and demonstrate how Thundra helps us pinpoint and resolve the problem.
We’ll also walk through an example using a sample SAM application that creates and alters tickets in Zendesk. These concepts, however, can broadly apply to virtually any serverless application.
Alerting in Thundra
One of the many sets of features in Thundra is the ability to query against the different views of your projects and directly create alerts from those queries.
There are currently four views you can query against:
- Functions: Search across all of your Lambda functions connected to Thundra. For example, you may want to return all functions that threw more than 10 errors in the last hour in a specific project.
- Invocations: Invocations are exactly that—a single invocation of a specific Lambda function. You might have a critical new function and want to query all invocations of that function that cold started. Or you may want to get alerted for the invocations dealing with an important customer’s operation. Invocation queries let you do those and turn the query into an alert.
- Operations: This lets you query against individual actions taken by functions, such as a call out to a third-party API or another AWS service. You may want to find all timeouts to a specific third-party API to help you troubleshoot with a vendor.
- Traces: Traces are a bit different from the three above. Thundra provides a unique identifier that tracks across the different pieces of an asynchronous chain of invocations across separate functions and services end-to-end, and you can query against that. You might choose a specific Lambda function as the origin of a trace for a query and return all traces when the entire trace takes longer than one second to complete.
Example: Serverless App Error to Alert to Resolution
Let’s look at an example scenario of setting up an alert in Thundra and taking that through to resolution.
In this example, you’ve just deployed a new serverless app with a bunch of functions running asynchronously. As far as your manual tests have gone, things seem to be working and you’ve decided to run it at scale and watch for problems.
Setting Up an Alert
To set up an alert in Thundra, you start with a query. Figure 1 shows one of the views for setting up a query. In this case, we’re querying against all of our functions in “default-project” in the us-west-2 region and returning any functions that threw errors more than 10 times in the last hour.
You can flexibly change the frequency of check to from one minute to one week, according to your use case.
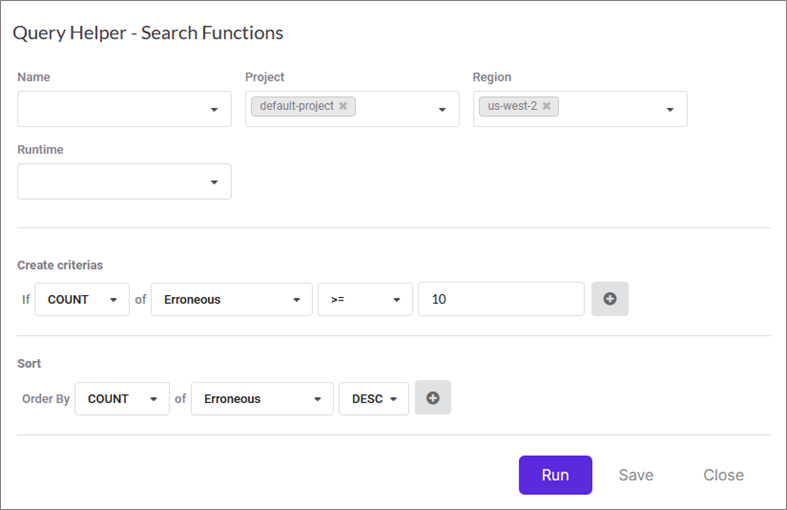
Figure 1 – Thundra query creation interface.
This query will be good for our example. Once you make the query, you can choose to save it as an alert. Doing so lets you set some other variables, such as the alert’s severity, how often you want it to run, and how you want to be notified. We cover the notification piece next.
Getting Notified
Once you’ve got an alert setup, Thundra offers notification through a host of platforms, including email, Amazon EventBridge, Opsgenie, PagerDuty, VictorOps, ServiceNow, and webhooks. For this example, we chose to connect Thundra to a channel in our Slack workspace and receive this alert there.
Figure 2 shows an error notification that came into Slack, telling us the “Errors > 10” alert we built from the query shown above in Figure 1 has been triggered the ticket generator function. We can click directly on the alert to go to more details in the Thundra dashboard.
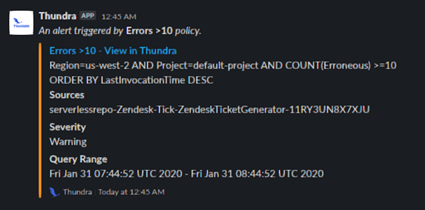
Figure 2 – Thundra alert as it appears in Slack.
Getting More Details
Jumping from the alert notification to the alert detail in the Thundra dashboard, as shown in Figure 3, gives us a quick summary view of the alert and the query that triggered it. Importantly, we can go directly to the full query results that triggered the alert.

Figure 3 – Alert event detail in the Thundra dashboard.
Below, you can see the function that threw more than 10 errors in the last hour, and we can quickly see some vital statistics as well. It looks like this function is erroring intermittently, with a health rating of 52 percent.
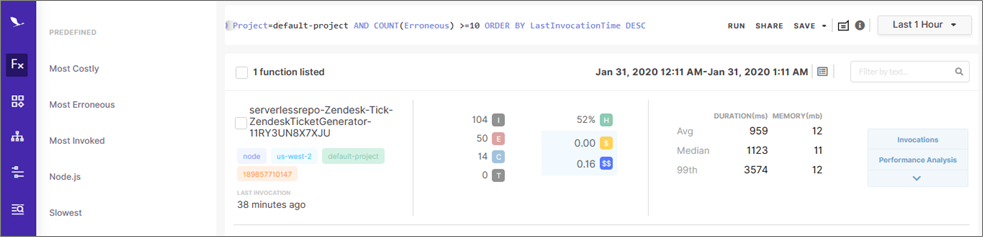
Figure 4 – Detailed results view of the alert, listing all functions that triggered the alert.
Finding the Root Cause
It’s great that we know there’s a problem, but now we need to figure out what that problem is so we can solve it. Thundra allows you to dive deep quickly through the weeds to pinpoint the problem.
From the screen in Figure 4 above, you can click “Invocations” on the right side and pull up details on individual erroneous invocations of that function. Figure 5 below shows the details of one of the erroneous invocations, separating each operation in the invocation so you can filter out the good from the bad quickly.
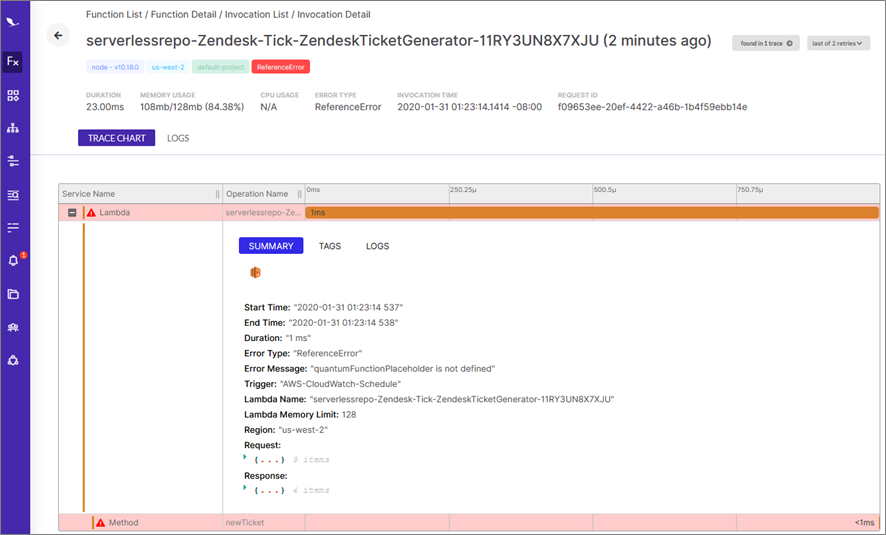
Figure 5 – Invocation details for an erroneous invocation of one of the functions triggering alerts.
In this case, we can see the parent function—the Lambda function’s event handler—is failing to complete successfully. It gets to the child method newTicket and stops there. From that information, we can reasonably assume the issue is within the newTicket method.
In Figure 6 below, you can see more details of the error, including the error stack, to help you pinpoint the error within newTicket.
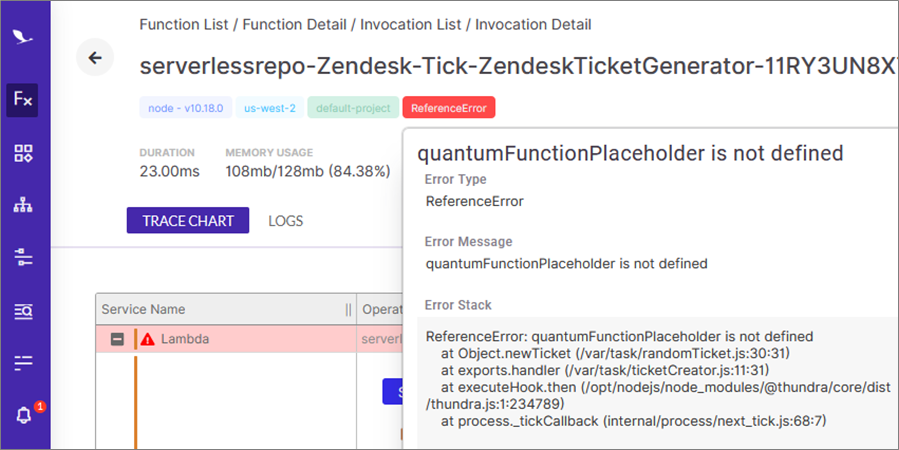
Figure 6 – Error stack details that appear when you hover over the ReferenceError tag in Thundra.
Thundra allows us to go even deeper than just the error stack, though. With offline debugging, you can step through the problematic code itself without leaving the Thundra console.
Figure 7 shows what that looks like when stepping into the newTicket method that’s throwing the errors.

Figure 7 – Thundra’s offline debugging allows you to look at code from within the Thundra console.
Using the arrows in the top right corner, we can step through the code line-by-line to figure out the cause of the error. The right side of the window shows the states of all variables at current line.
In Figure 8 below, we’re able to advance until line 17, when the error caused the function to terminate. At that point, the value for the variable ‘a’ is 2, and line 17 shows that ‘a’ is used in a switch statement.
Going to case 2, we suddenly find that undefined “quantum” function the error stack called out earlier. Looks like someone forgot to delete a line of code.

Figure 8 – Thundra’s offline debugging interface lets you step through lines of code and display variable values. Red boxes added for emphasis.
Now that we know we need to delete line 29, we can correct our code and redeploy the Lambda function, which we’ll do shortly.
Understanding the Wider Impact
We know we have a bug and even know how to solve it, but that doesn’t necessarily tell us it’s worth stopping everything our developers are working on to fix it right away.
Thundra gives us the ability to visualize the error’s impact on the larger serverless application. We can use that info to determine the downstream effects and how we should prioritize the bug fix.
In Figure 9 below, you can see a more holistic view of the serverless app, with the various functions involved, other AWS services, and calls out to external services, such as the Zendesk API.
This is a very simple application, and the sky is the limit on how complicated these diagrams can get. In this case, you can see an orange box around the ticket generator function that was throwing errors.
The orange box indicates this piece of the architecture is throwing errors. Thundra uses a color-coded system based on the health percentage, so you can spot issues at a glance.
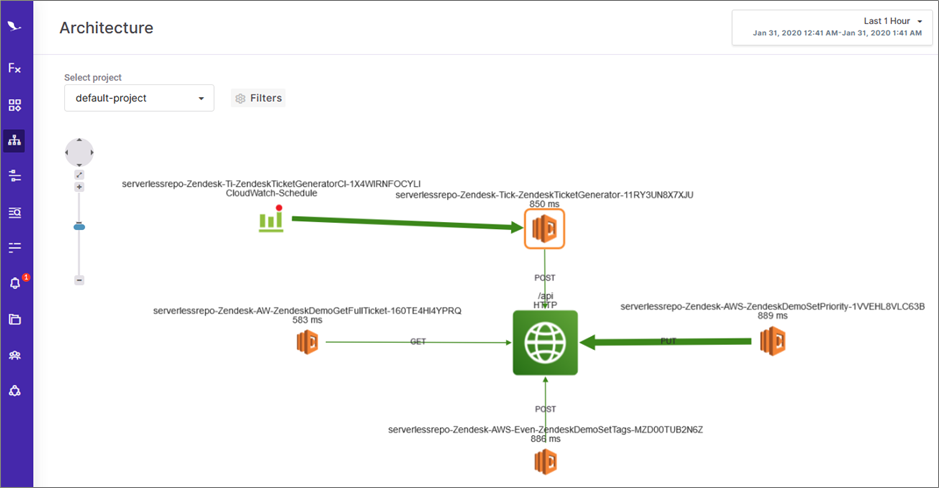
Figure 9 – Architecture view in Thundra of the entire serverless project.
The thickness of the arrows indicates the quantity of interactions happening along that path. The ticket generator function is designed to receive an event from Amazon CloudWatch Events once per minute and call the Zendesk API to make a new ticket every time.
Here, we see the CloudWatch Events to Lambda arrow is thicker than the Lambda to “/api” arrow, but they would be the same if the function was doing its job properly. We can therefore tell right away there’s downstream impact from this error. In this case, it looks like we should prioritize fixing this error.
Solving the Problem
From all of the information gathered in these steps, we figured out there was an error in the ticket generator function, that it’s happening in 48 percent of the invocations in the last hour, that it affects the function’s ability to write downstream to the Zendesk API, and exactly what that error is in the code itself.
Now, all we have to do is go delete that erroneous line and redeploy the Lambda function. This post isn’t about how to deploy and redeploy Lambda functions, so we won’t walk through that part.
Figure 10 below shows the results of making the code correction. After we re-deployed the Lambda function, we waited about 15 minutes to see if more errors showed up, and we have 100 percent health in that time period.
It looks like the code change solved the problem, and we were able to figure it out much more quickly than manually searching through logs.
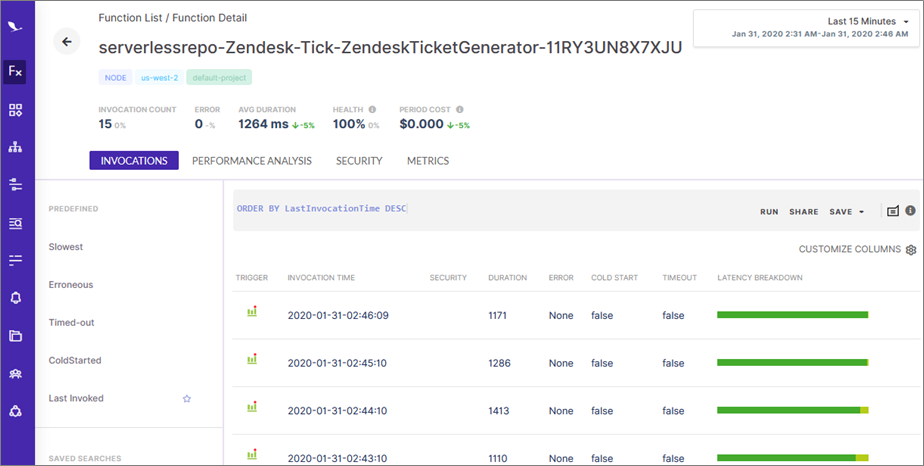
Figure 10 – List of recent invocations and stats of this function over the last 15 minutes, showing that the errors have stopped.
Reconfigure Alerts Based on Lessons Learned
One thing we learned jumping into this architecture is that we may want to watch for errors that hit the downstream resources, such as the Zendesk API. Errors there may impact our desired results from the application.
Knowing that, we can use Thundra to send an alert on an operations query where the resource is the Zendesk API endpoint and the operation is erroneous. Alerting supports different prioritization tags, so we can tag that type of alert as “critical” to get it more attention over a lower impact “warning.”
Summary
In this post, we went through responding to an alert in an AWS Lambda function using Thundra’s deep instrumentation capabilities.
Thundra also replaces multiple tools that organizations typically use, providing application teams the insights, recommendations, and actions to efficiently identify issues of cost, performance, availability, security, and compliance.
Unlike tools that emerged with virtualization and containerization, Thundra started with serverless. The constraints of serverless drove the need for an end-to-end understanding of the application to efficiently troubleshoot and debug.
Thundra provides lightweight runtime libraries provided for Java, Node.js, Python, Golang, and .NET applications running on AWS Lambda, AWS Fargate, Amazon Elastic Container Service (Amazon ECS), and more. The library for Node.js is only 5.1 MB and adds 5-10ms of overhead to the actual invocation time.
Thundra is available as a subscription and on AWS Marketplace, with a free tier to help you decide if the service is right for you. The documentation provides several different options for connecting your serverless apps to Thundra, including a single button press that does the instrumentation for you with no other hassle.
.

.
Thundra – APN Partner Spotlight
Thundra is an AWS Competency Partner. Its application observability and security platform combines troubleshooting and debugging to improve MTTR while ensuring security and compliance policies are enforced.
Contact Thundra | Solution Overview | AWS Marketplace
*Already worked with Thundra? Rate this Partner
*To review an APN Partner, you must be an AWS customer that has worked with them directly on a project.