AWS News Blog
Find Your Most Expensive Lines of Code – Amazon CodeGuru Is Now Generally Available

|
Bringing new applications into production, maintaining their code base as they grow and evolve, and at the same time respond to operational issues, is a challenging task. For this reason, you can find many ideas on how to structure your teams, on which methodologies to apply, and how to safely automate your software delivery pipeline.
At re:Invent last year, we introduced in preview Amazon CodeGuru, a developer tool powered by machine learning that helps you improve your applications and troubleshoot issues with automated code reviews and performance recommendations based on runtime data. During the last few months, many improvements have been launched, including a more cost-effective pricing model, support for Bitbucket repositories, and the ability to start the profiling agent using a command line switch, so that you no longer need to modify the code of your application, or add dependencies, to run the agent.

You can use CodeGuru in two ways:
- CodeGuru Reviewer uses program analysis and machine learning to detect potential defects that are difficult for developers to find, and recommends fixes in your Java code. The code can be stored in GitHub (now also in GitHub Enterprise), AWS CodeCommit, or Bitbucket repositories. When you submit a pull request on a repository that is associated with CodeGuru Reviewer, it provides recommendations for how to improve your code. Each pull request corresponds to a code review, and each code review can include multiple recommendations that appear as comments on the pull request.
- CodeGuru Profiler provides interactive visualizations and recommendations that help you fine-tune your application performance and troubleshoot operational issues using runtime data from your live applications. It currently supports applications written in Java virtual machine (JVM) languages such as Java, Scala, Kotlin, Groovy, Jython, JRuby, and Clojure. CodeGuru Profiler can help you find the most expensive lines of code, in terms of CPU usage or introduced latency, and suggest ways you can improve efficiency and remove bottlenecks. You can use CodeGuru Profiler in production, and when you test your application with a meaningful workload, for example in a pre-production environment.
Today, Amazon CodeGuru is generally available with the addition of many new features.
In CodeGuru Reviewer, we included the following:
- Support for Github Enterprise – You can now scan your pull requests and get recommendations against your source code on Github Enterprise on-premises repositories, together with a description of what’s causing the issue and how to remediate it.
- New types of recommendations to solve defects and improve your code – For example, checking input validation, to avoid issues that can compromise security and performance, and looking for multiple copies of code that do the same thing.
In CodeGuru Profiler, you can find these new capabilities:
- Anomaly detection – We automatically detect anomalies in the application profile for those methods that represent the highest proportion of CPU time or latency.
- Lambda function support – You can now profile AWS Lambda functions just like applications hosted on Amazon Elastic Compute Cloud (Amazon EC2) and containerized applications running on Amazon Elastic Container Service (Amazon ECS) and Amazon Elastic Kubernetes Service (Amazon EKS), including those using AWS Fargate.
- Cost of issues in the recommendation report – Recommendations contain actionable resolution steps which explain what the problem is, the CPU impact, and how to fix the issue. To help you better prioritize your activities, you now have an estimation of the savings introduced by applying the recommendation.
- Color-my-code – In the visualizations, to help you easily find your own code, we are coloring your methods differently from frameworks and other libraries you may use.
- CloudWatch metrics and alerts – To keep track and monitor efficiency issues that have been discovered.
Let’s see some of these new features at work!
Using CodeGuru Reviewer with a Lambda Function
I create a new repo in my GitHub account, and leave it empty for now. Locally, where I am developing a Lambda function using the Java 11 runtime, I initialize my Git repo and add only the README.md file to the master branch. In this way, I can add all the code as a pull request later and have it go through a code review by CodeGuru.
Now, I add the GitHub repo as origin, and push my changes to the new repo:
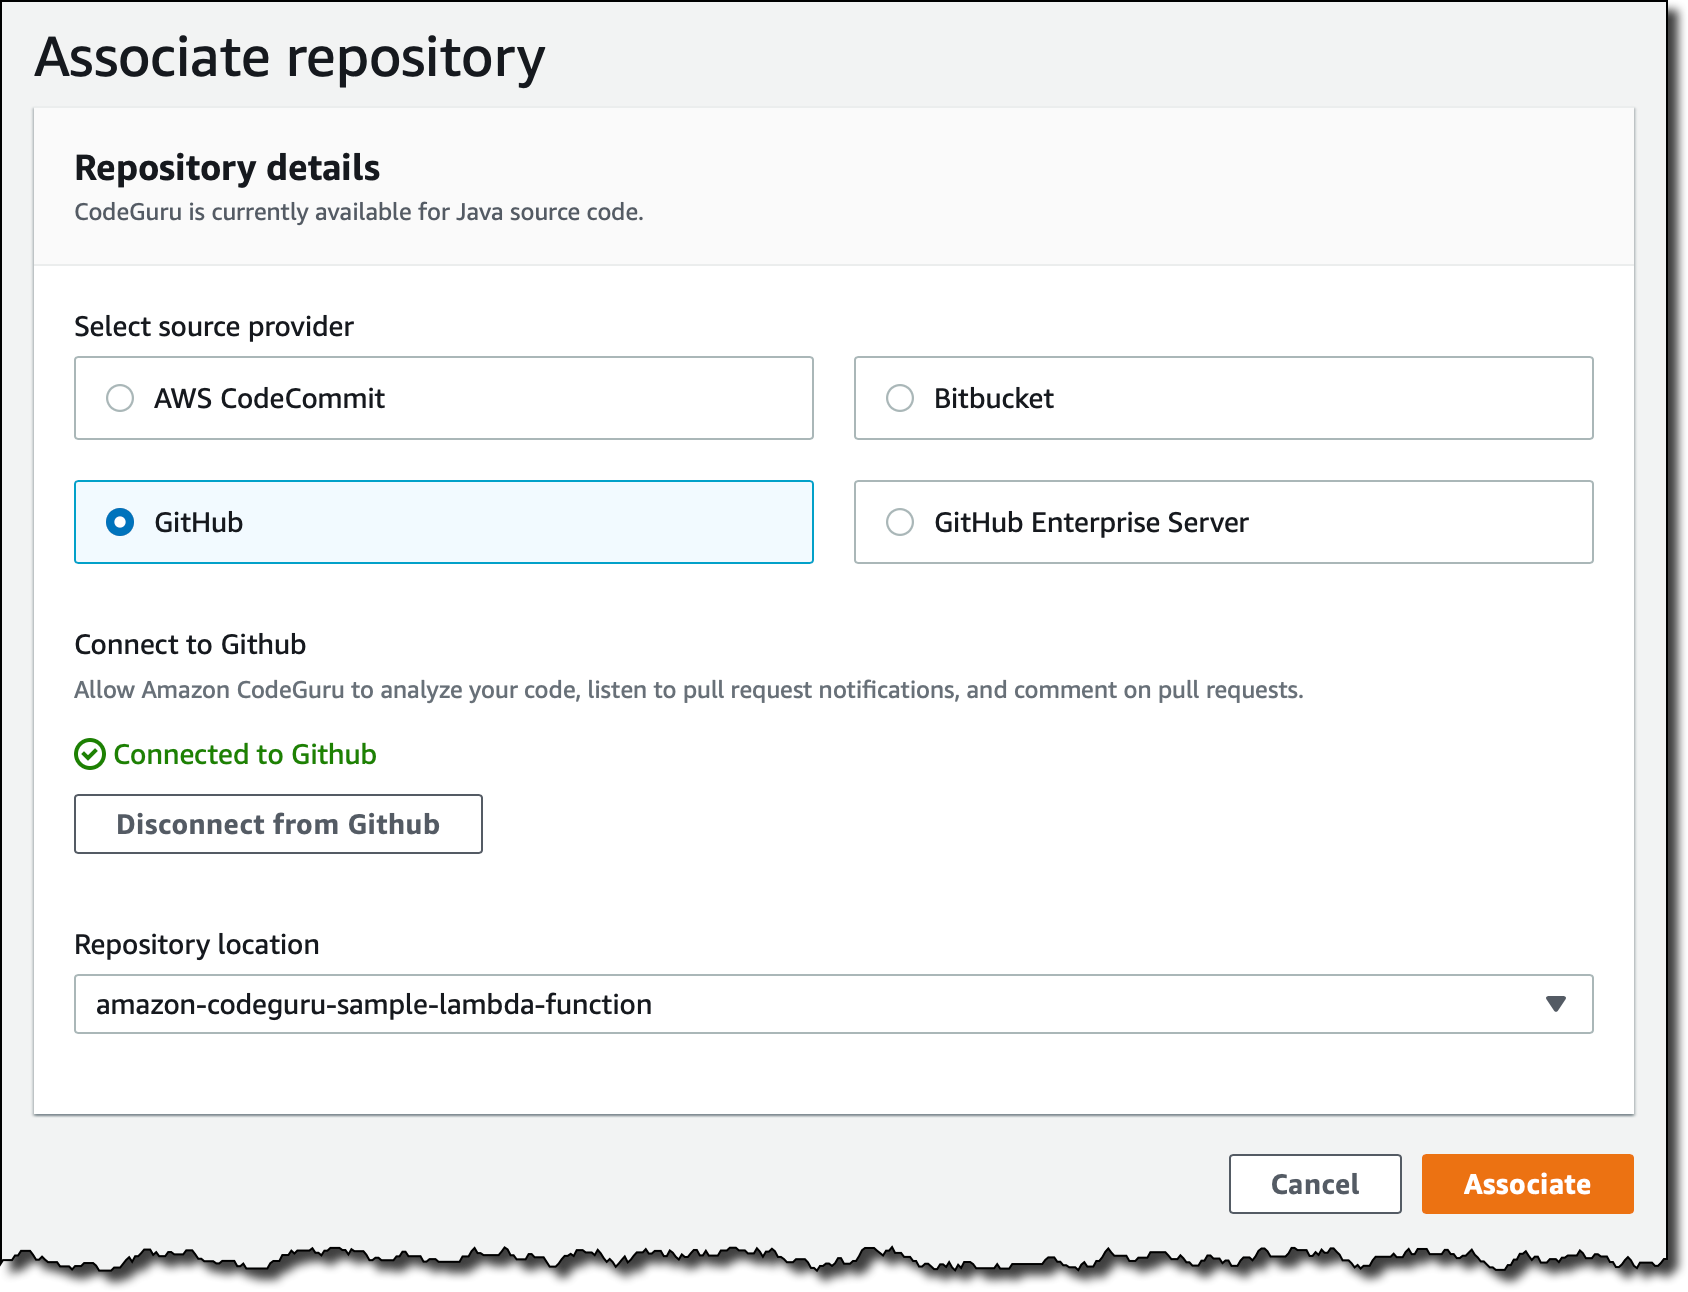
I associate the repository in the CodeGuru console:
When the repository is associated, I create a new dev branch, add all my local files to it, and push it remotely:
In the GitHub console, I open a new pull request by comparing changes across the two branches, master and dev. I verify that the pull request is able to merge, then I create it.

Since the repository is associated with CodeGuru, a code review is listed as Pending in the Code reviews section of the CodeGuru console.

After a few minutes, the code review status is Completed, and CodeGuru Reviewer issues a recommendation on the same GitHub page where the pull request was created.
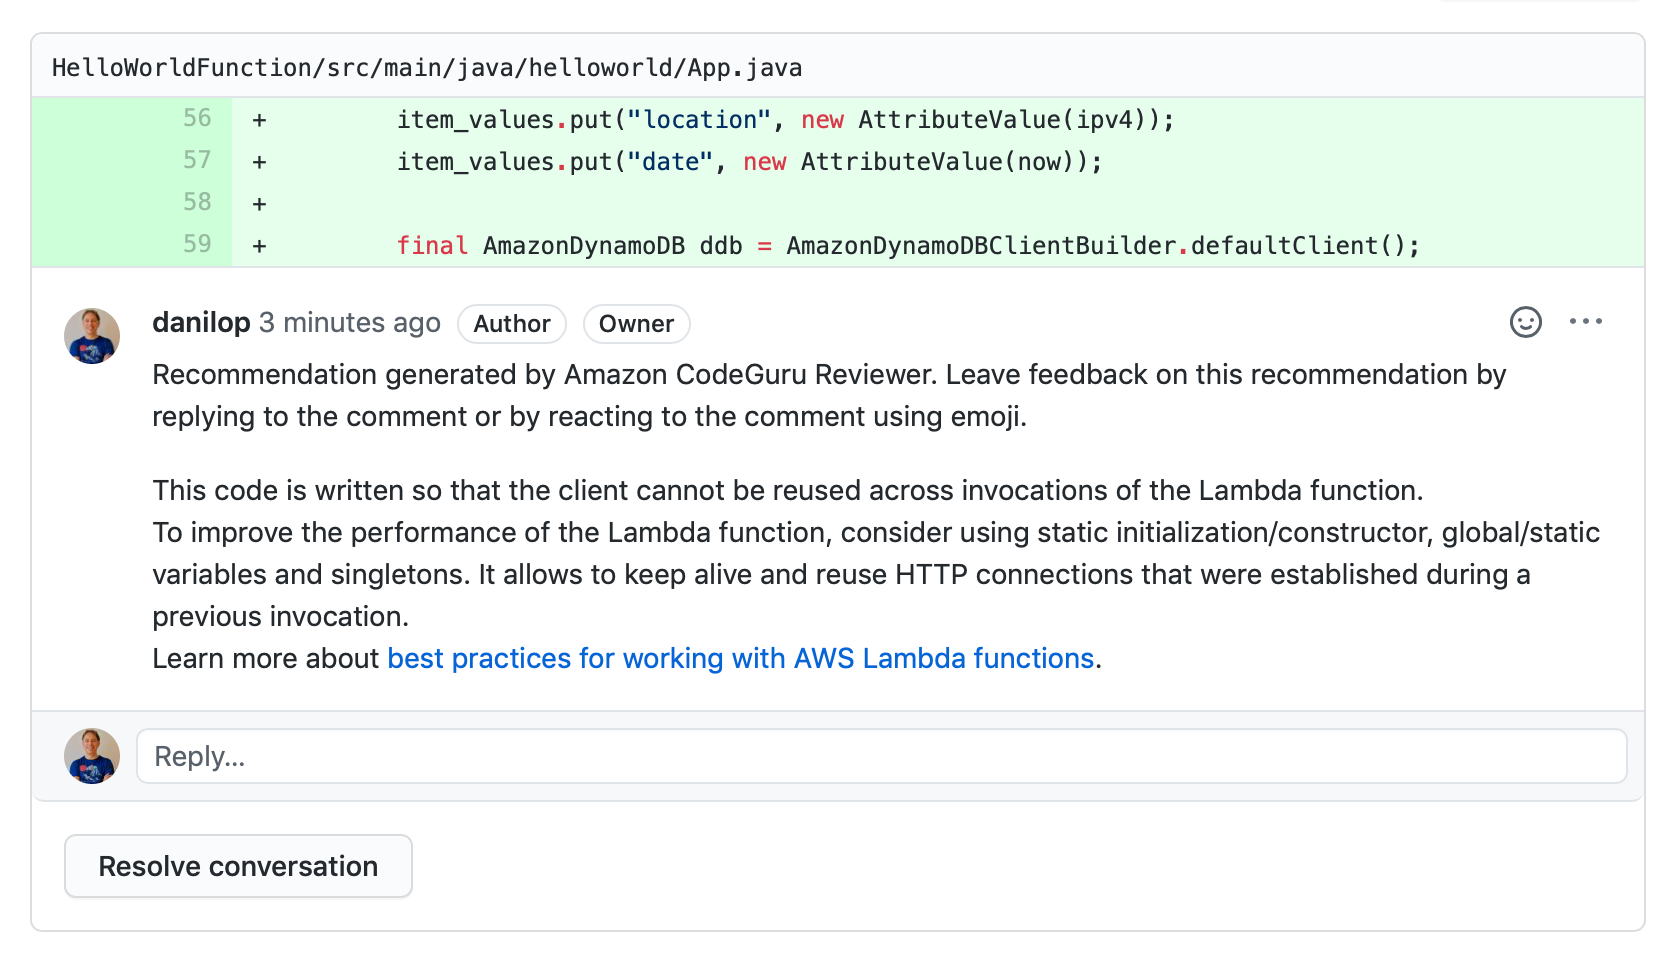
Oops! I am creating the Amazon DynamoDB service object inside the function invocation method. In this way, it cannot be reused across invocations. This is not efficient.
To improve the performance of my Lambda function, I follow the CodeGuru recommendation, and move the declaration of the DynamoDB service object to a static final attribute of the Java application object, so that it is instantiated only once, during function initialization. Then, I follow the link in the recommendation to learn more best practices for working with Lambda functions.
Using CodeGuru Profiler with a Lambda Function
In the CodeGuru console, I create a MyServerlessApp-Development profiling group and select the Lambda compute platform.

Next, I give the AWS Identity and Access Management (IAM) role used by my Lambda function permissions to submit data to this profiling group.

Now, the console is giving me all the info I need to profile my Lambda function. To configure the profiling agent, I use a couple of environment variables:
AWS_CODEGURU_PROFILER_GROUP_ARNto specify the ARN of the profiling group to use.AWS_CODEGURU_PROFILER_ENABLEDto enable (TRUE) or disable (FALSE) profiling.

I follow the instructions (for Maven and Gradle) to add a dependency, and include the profiling agent in the build. Then, I update the code of the Lambda function to wrap the handler function inside the LambdaProfiler provided by the agent.
To generate some load, I start a few scripts invoking my function using the Amazon API Gateway as trigger. After a few minutes, the profiling group starts to show visualizations describing the runtime behavior of my Lambda function.
For example, I can see how much CPU time is spent in the different methods of my function. At the bottom, there are the entry point methods. As I scroll up, I find methods that are called deeper in the stack trace. I right-click and hide the LambdaRuntimeClient methods to focus on my code. Note that my methods are colored differently than those in the packages I am using, such as the AWS SDK for Java.
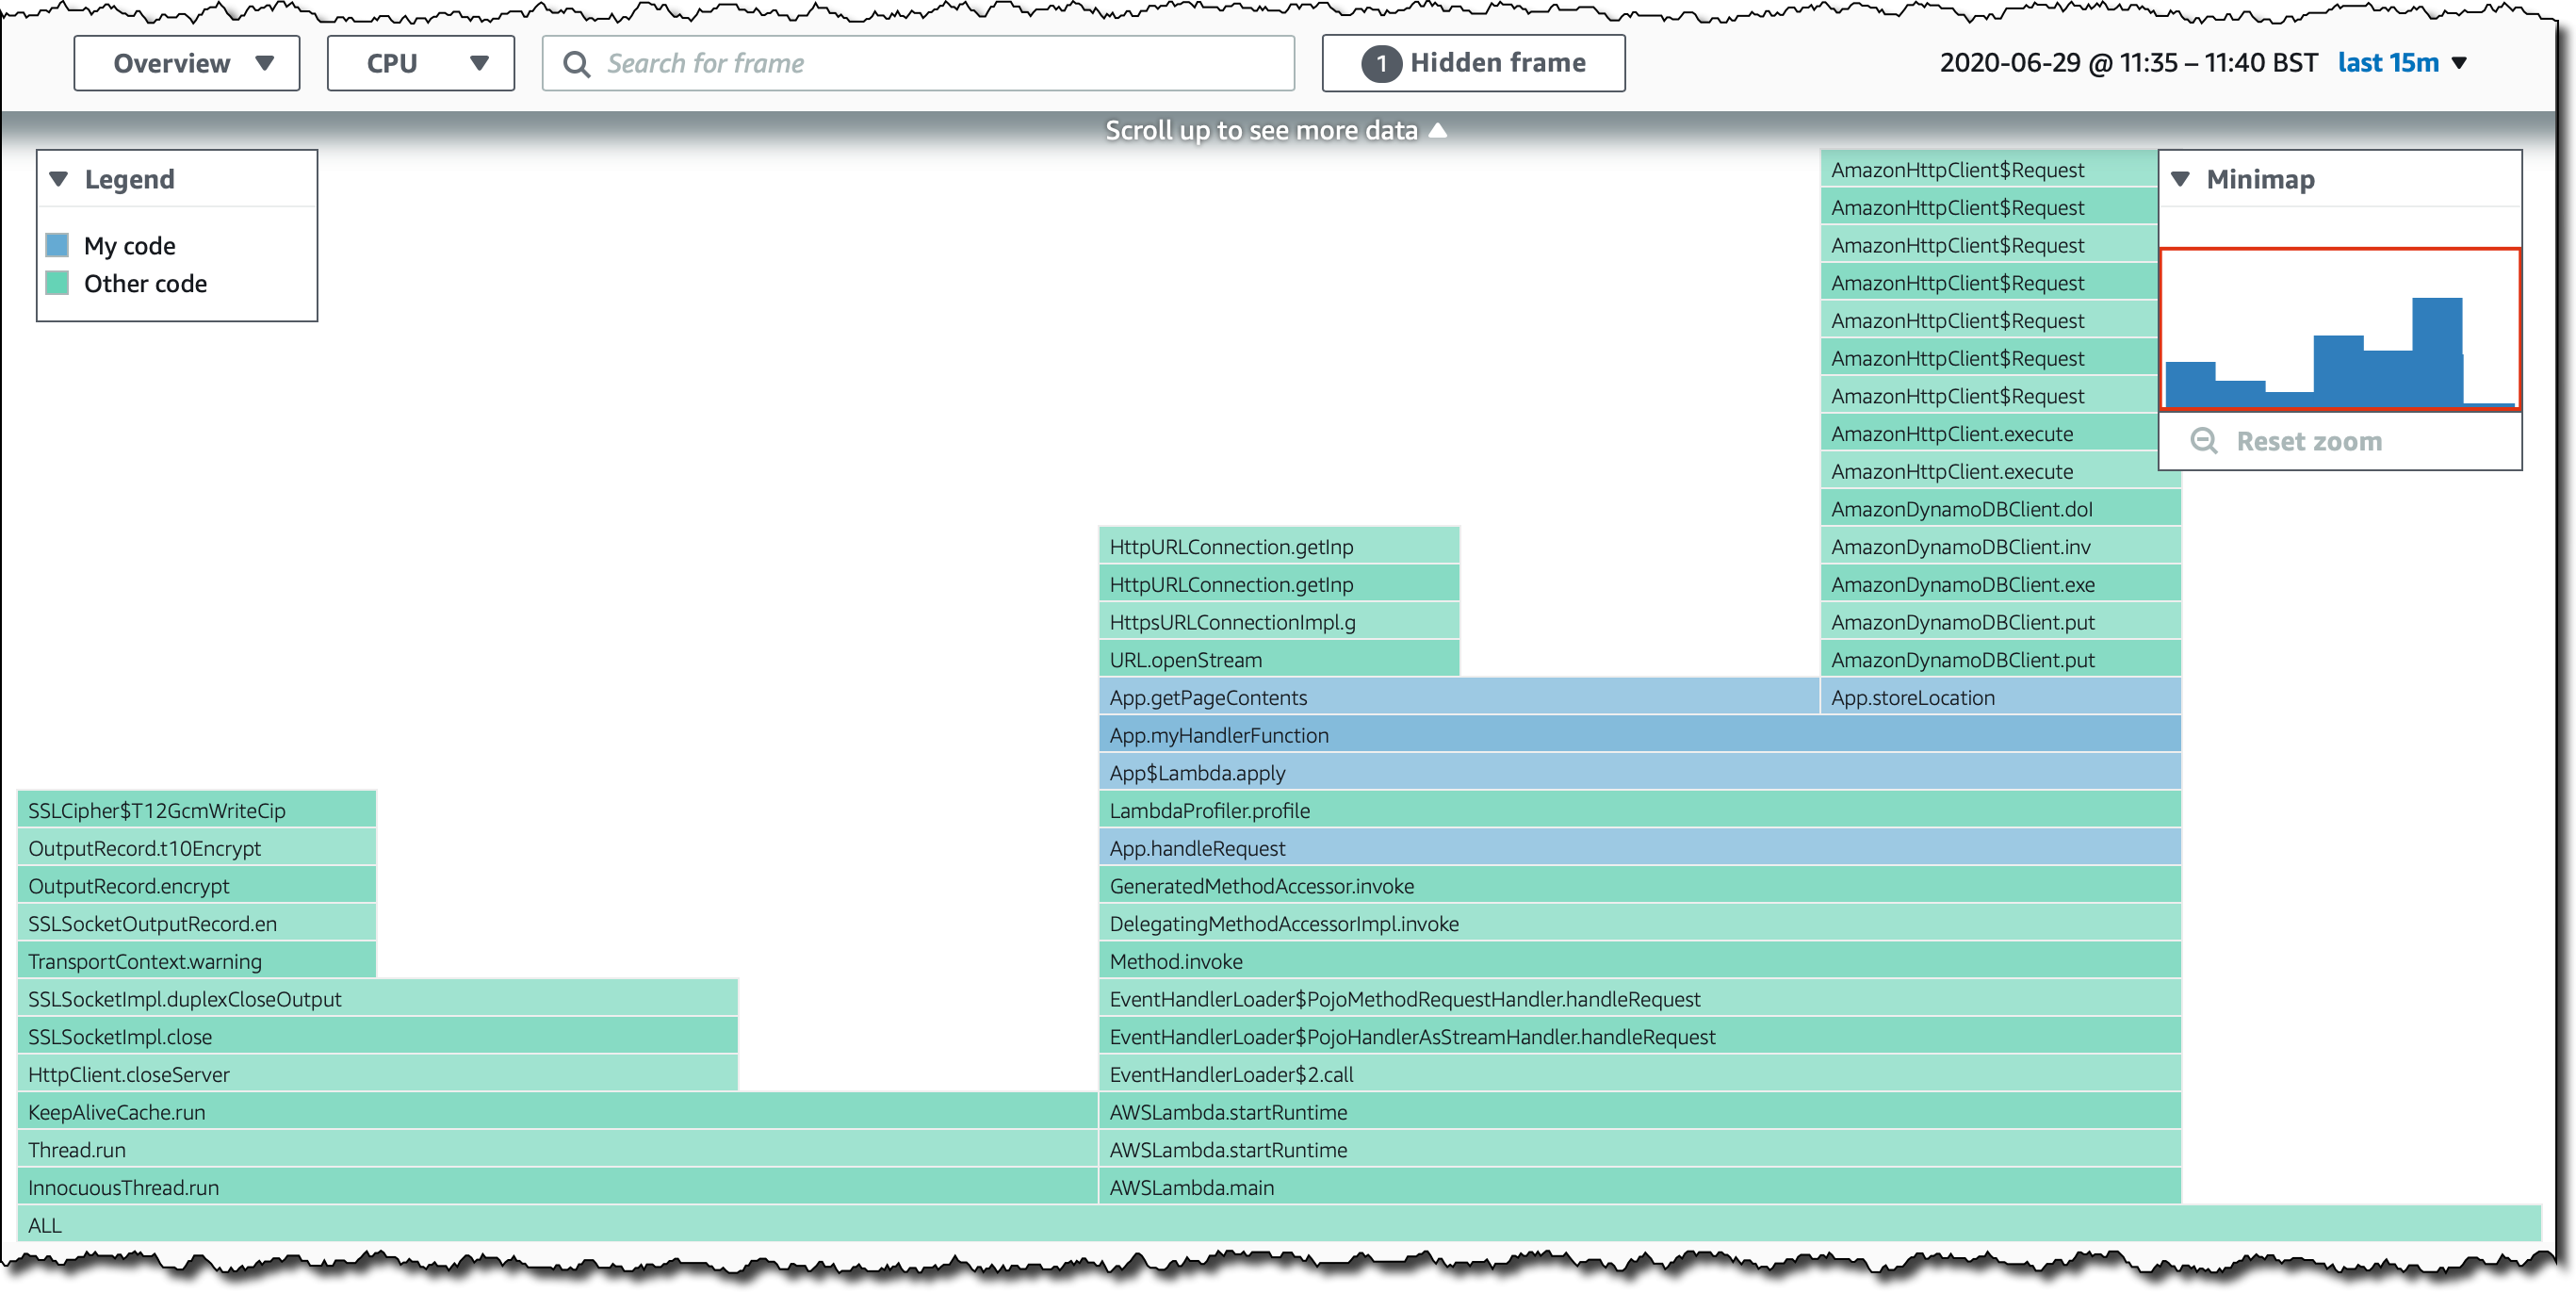
I am mostly interested in what happens in the handler method invoked by the Lambda platform. I select the handler method, and now it becomes the new “base” of the visualization.

As I move my pointer on each of my methods, I get more information, including an estimation of the yearly cost of running that specific part of the code in production, based on the load experienced by the profiling agent during the selected time window. In my case, the handler function cost is estimated to be $6. If I select the two main functions above, I have an estimation of $3 each. The cost estimation works for code running on Lambda functions, EC2 instances, and containerized applications.
Similarly, I can visualize Latency, to understand how much time is spent inside the methods in my code. I keep the Lambda function handler method selected to drill down into what is under my control, and see where time is being spent the most.

The CodeGuru Profiler is also providing a recommendation based on the data collected. I am spending too much time (more than 4%) in managing encryption. I can use a more efficient crypto provider, such as the open source Amazon Corretto Crypto Provider, described in this blog post. This should lower the time spent to what is expected, about 1% of my profile.

Finally, I edit the profiling group to enable notifications. In this way, if CodeGuru detects an anomaly in the profile of my application, I am notified in one or more Amazon Simple Notification Service (Amazon SNS) topics.

Available Now
Amazon CodeGuru is available today in 10 regions, and we are working to add more regions in the coming months. For regional availability, please see the AWS Region Table. AWS CloudFormation support is coming soon.
CodeGuru helps you improve your application code and reduce compute and infrastructure costs with an automated code reviewer and application profiler that provide intelligent recommendations. Using visualizations based on runtime data, you can quickly find the most expensive lines of code of your applications. With CodeGuru, you pay only for what you use. Pricing is based on the lines of code analyzed by CodeGuru Reviewer, and on sampling hours for CodeGuru Profiler.
To learn more, please see the documentation – or check out the video by Jeff!
— Danilo