AWS Big Data Blog
Analyzing Amazon EC2 Spot instance interruptions by using event-driven architecture
Amazon Elastic Compute Cloud (Amazon EC2) Spot Instances offer significant cost savings of up to 90% compared to On-Demand pricing, making them attractive for cost-conscious workloads. However, when using Spot Instances within AWS Auto Scaling Groups (ASGs), their unpredictable interruptions create operational challenges. Without proper visibility into interruption patterns, teams struggle to optimize capacity planning, implement effective fallback mechanisms, and make informed decisions about workload placement across availability zones and instance types.
This challenge can be addressed through a custom event-driven monitoring and analytics dashboard that provides near real-time visibility into Spot Instance interruptions specifically for ASG-managed instances. For the remainder of this document, we’ll refer to this custom solution as “Spot Interruption Insights” for Auto Scaling Groups.
In this post, you’ll learn how to build this comprehensive monitoring solution step-by-step. You’ll gain practical experience designing an event-driven pipeline, implementing data processing workflows, and creating insightful dashboards that help you track interruption trends, optimize ASG configurations, and improve the resilience of your Spot Instance workloads.
Solution overview
The architecture uses an event-driven approach utilizing AWS native services for robust spot instance interruption monitoring.
The solution uses Amazon EventBridge to capture interruption events, Amazon Simple Queue Service (Amazon SQS) for reliable message queuing, AWS Lambda for data processing, and Amazon OpenSearch Service for storage and visualization of interruption patterns.
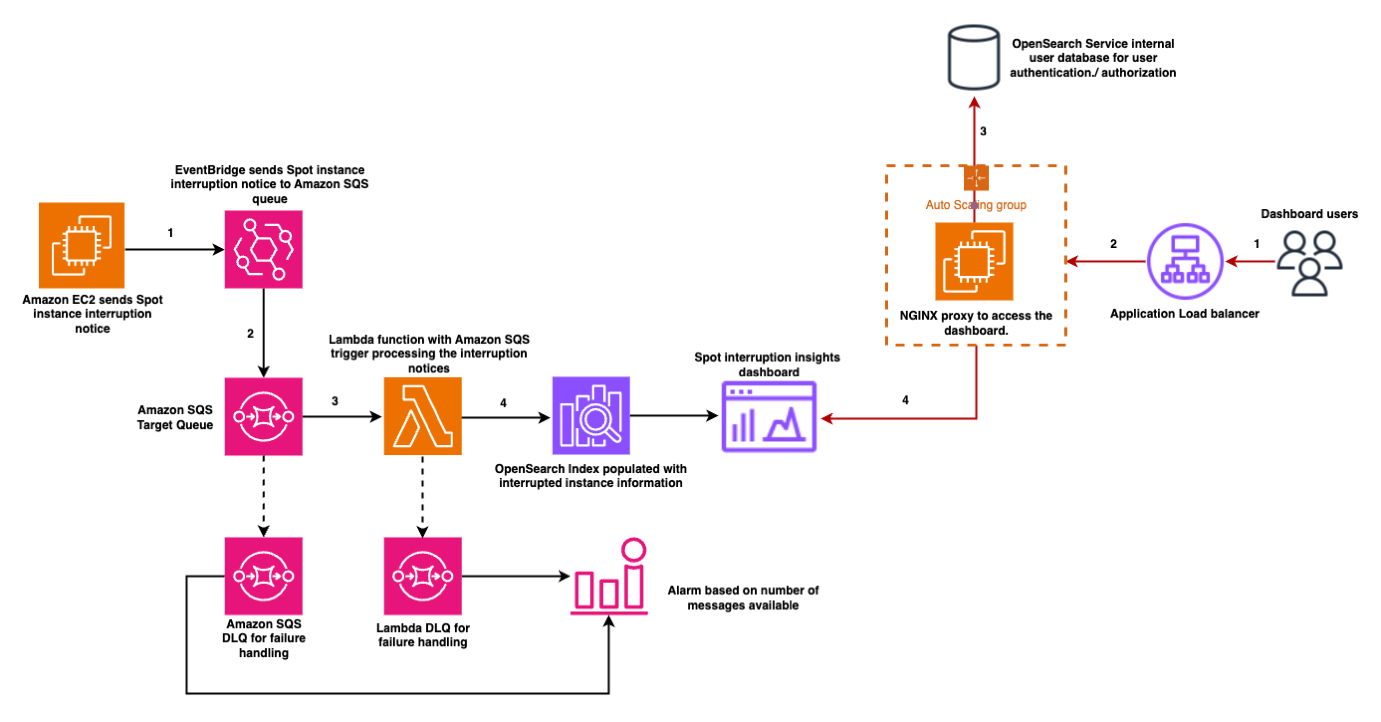
- EC2 Spot interruption notices are captured via an Amazon EventBridge rule.
- The notices are routed to an SQS queue for reliable message handling.
- A Lambda function processes the events, fetching EC2 instance metadata and AWS Auto Scaling Group (ASG) details by making optimized batch calls to the EC2 and Auto Scaling APIs. This design minimizes throttling risks on the control plane APIs, ensuring scalability. The Lambda function is configured with batching and concurrency limits to prevent overwhelming the API endpoints and the OpenSearch Service bulk indexing process.
- After processing, events are bulk-indexed into Amazon OpenSearch Service, enabling near real-time visibility and analytics.
A Dead Letter Queue (DLQ) ensures no data is lost in case of failures, while AWS Identity and Access Management (IAM) roles enforce least-privilege access between all components.
The OpenSearch Service domain is deployed within the private subnets of an Amazon VPC, ensuring it is not publicly accessible.
- Access to OpenSearch Dashboards is routed through an Application Load Balancer (ALB) configured with an HTTPS listener,
- ALB forwards traffic to an NGINX proxy running on EC2 instances in an Auto Scaling group. This setup provides secure and scalable access.
- Authentication and authorization are enforced using OpenSearch Service’s internal user database, ensuring that only authorized users can access the dashboards.
OpenSearch Dashboards visualize interruption metrics, delivering actionable insights to support effective capacity planning and workload placement.
Extensibility and alternative analytics tools
While this solution uses Amazon OpenSearch Service for storing and visualizing Spot Interruption data, the architecture is flexible and can be extended to support other analytics and observability platforms. You can modify the Lambda function to forward data to tools such as Amazon Quick Sight, Amazon Timestream, Amazon Redshift, or external services depending on your analytics and compliance needs. This enables teams to use their preferred tooling for building visualizations, setting alerts, or integrating with existing dashboards.
What you’ll build
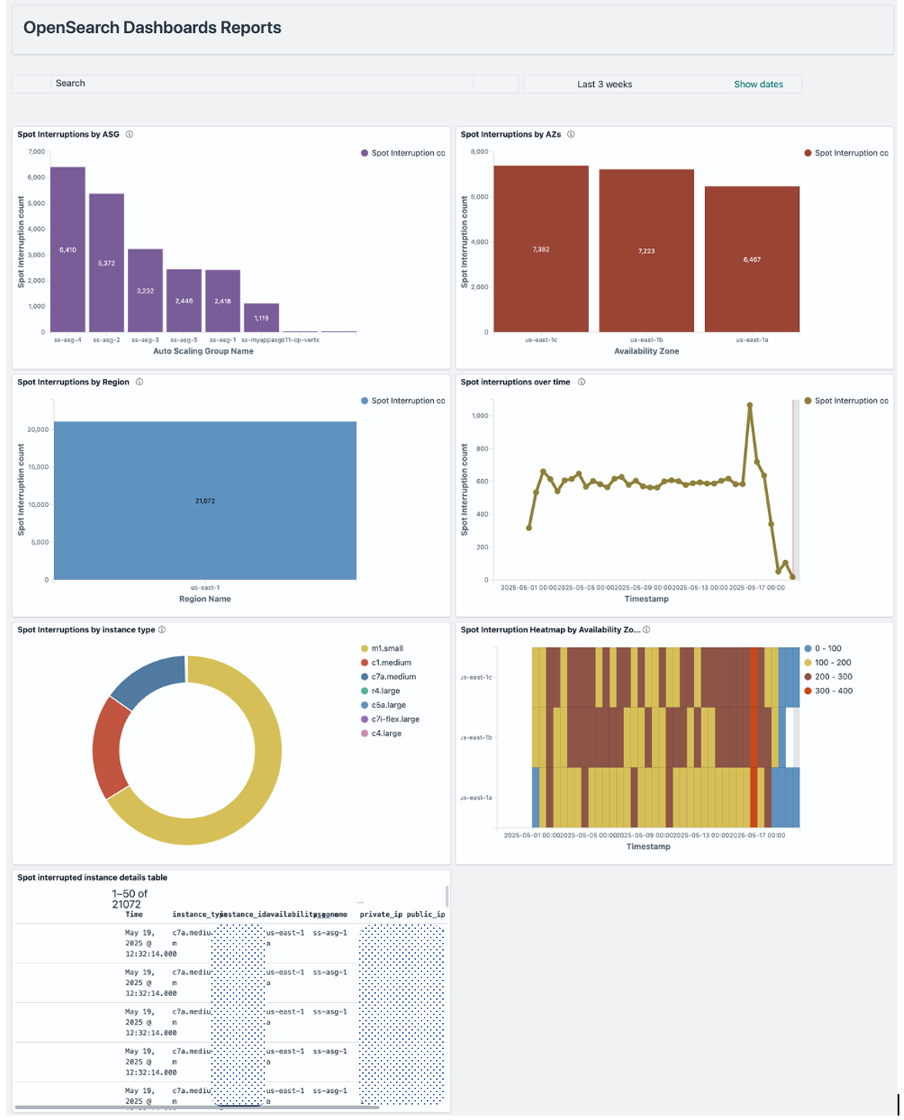
By the end of this post, you’ll have a complete Spot Interruption monitoring system as seen in the following screenshot that automatically captures EC2 Spot Instance interruption events from your Auto Scaling Groups and presents them through interactive dashboards. Your solution will include real-time visualizations showing interruption patterns by availability zone, instance types, and time periods, along with ASG-specific metrics that help you identify optimization opportunities.
The sections of this post walk you through the step-by-step implementation of this solution, from deployment to setting up the event-driven architecture to configuring the analytics dashboards. Remember that you can deploy and customize this solution for your environment.
Prerequisites
You must have access to an AWS account with enough privileges to create and manage the AWS resources discussed in this blog post.You must also have the following software/components installed on your device:
Note: This application utilizes multiple AWS services, and there are associated costs beyond the Free Tier usage. Refer to the AWS Pricing page for specific details. You are accountable for any incurred AWS costs. This example solution does not imply any warranty.
Deployment instructions
Create a new directory, navigate to that directory in a terminal and clone the GitHub repository:
Change directory to the solution directory:
Checklist for deployment
This section lists the setup and configurations that are required before you deploy the solution stack by using AWS SAM.
If you don’t have a VPC, Subnets, NAT Gateway already created and configured you can follow the steps mentioned in the Amazon VPC documentation to create the necessary resources.
- VPC Created – Ensure a VPC exists with DNS hostnames and DNS resolution enabled. You will need the VPC ID during deployment
- Public Subnets (2 or more) – Configure two or more public subnet IDs from different Availability Zones.
- Private Subnets (2 or more) – Configure two or more private subnet IDs from different Availability Zones.
- Outbound Internet Access for Private Subnets – Ensure NAT Gateway access as nginx proxy will be installed on EC2 instance in private subnet. Refer to Example: VPC with servers in private subnets and NAT for more information on setting up NAT for instances in private subnets.
- ALB Access – CIDR IP range allowed to access ALB (such as,
`1.2.3.4/32`). This is for accessing the dashboard. - Certificate ARN for ALB HTTPS Listener – To configure HTTPS listener. Certificate (can be self-signed) for HTTPS port of the load balancer. Refer to Prerequisites for importing ACM certificates for more information on importing self-signed certificate into AWS Certificate Manager (ACM)
- OpenSearch Service-Linked Role – Before deploying this template, ensure the AWS OpenSearch service-linked role exists in your account by running:
Note:
- This command only needs to be run once per AWS account.
- If the role already exists, you’ll see an error message that can be safely ignored.
- This role allows Amazon OpenSearch Service to manage network interfaces in your VPC.
- Without this role, deployments that place OpenSearch Service domains in a VPC will fail with the error: “Before you can proceed, you must enable a service-linked role to give Amazon OpenSearch Service permissions to access your VPC.”
- The service-linked role is named
"AWSServiceRoleForAmazonOpenSearchService"and is managed by AWS.
- AMIId – Valid EC2 AMI ID for the region. Note:- This solution is designed to work exclusively with AMIs that use the DNF package manager. Use the latest Amazon Linux 2023 AMI for optimal compatibility and security.
The following AMIs are confirmed compatible with this solution:
- Amazon Linux 2023
- Fedora (35 and newer)
- RHEL 8 and newer
- CentOS Stream 8 and newer
- Oracle Linux 8 and newer
Build and deploy the solution – From the command line, use AWS SAM to build and deploy the AWS resources as specified in the template.yml file.
During the prompts: Fill-out the following parameters:
- Stack Name: {Enter your preferred stack name}
- AWS Region: {Enter your preferred region code}
- Parameter DomainName: {Enter the name for your new OpenSearch Service domain where the index will be created and data will be pushed for analytics. This will create a new OpenSearch domain with the name you specify – Preferably keep short domain name}
- MasterUsername: {Admin username to login to the OpenSearch dashboard}
- MasterUserPassword: { Must contain lowercase, uppercase, numbers, and special characters (!@#$%^&*). Minimum 12 characters recommended. Avoid common passwords (Password123!, Admin@2024 and more) as these may cause deployment failures due to security validation checks.}
- IndexName: {OpenSearch Index name where Spot interrupted instance related data will be pushed}
- EventRuleName: {Amazon EventBridge rule name to capture EC2 Spot interruption notices}
- CustomEventRuleName: {Amazon EventBridge custom rule name to capture EC2 Spot interruption notices. This will be used for verifying the solution}
- TargetQueueName: {EventBridge Rule target SQS name}
- SQSDLQQueueName: {Target SQS Dead Letter Queue name}
- LambdaDLQQueueName: {Lambda Dead Letter Queue name}
- VPCId: {Enter the VPCId where the resources will be deployed}
- PublicSubnetIds: {Enter 2 or more Public SubnetIDs separated by comma}
- PrivateSubnetIds: {Enter 2 or more Private SubnetIDs separated by comma}
- RestrictedIPCidr: {IP address/CIDR for restricting ALB access in CIDR format (such as
10.2.3.4/32)} - CertificateArn: {Certificate ARN for configuring ALB HTTPS Listener}
- AMIId: {Valid EC2 AMI ID for the region}
- Confirm changes before deploy: Y
- Allow SAM CLI IAM role creation: Y
- Disable rollback: N
- Save arguments to configuration file: Y
- SAM configuration file: {Press enter to use default name}
- SAM configuration environment: {Press enter to use default name}
Note: The complete solution may take approximately 15-20 minutes to deploy. After the deployment is complete, there are a few manual steps that need to be performed to ensure the solution functions as expected.
Post deployment instructions
The following steps need to be performed in OpenSearch Dashboards after logging in. Get the DNS Name of the Application Load Balancer endpoint from the deployment output section of the CloudFormation stack or the ALB console. Access the OpenSearch dashboards using the ALB DNS name as follows –
You will be redirected to the OpenSearch Dashboards login page. Log in using the MasterUsername and MasterUserPassword you specified during deployment.
If this is the first time you are logging in then you may see a Welcome screen.
- Choose ‘Explore on my own’ on the Welcome screen.
- Choose ‘Dismiss’ on the next screen.
- If the ‘Select your tenant’ dialog appears with ‘Global’ preselected, Choose ‘Confirm’. Otherwise, select ‘Global’ first and then and choose ‘Confirm’.
Create index and attribute mapping
This section lists the required steps to create the index and attribute mapping.
- On the Home screen select the Hamburger Menu icon (
 ) on the top left
 - Select ‘Dev Tools’ at the bottom of the menu.
- On the dev tools console, paste the following PUT command and execute the request by choosing ‘Click to send request’.
Note The index name should match what you entered during the deployment. Change the index name accordingly before creating the index.
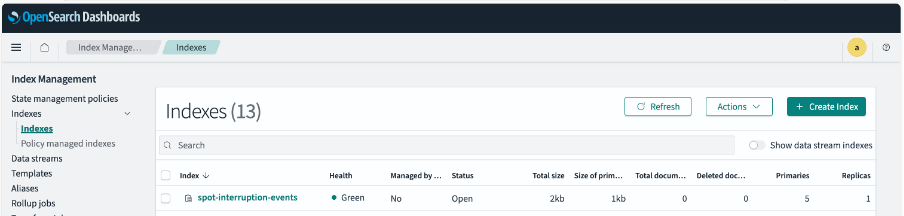
The following is a screenshot of this command in Dev Tools.

- Confirm that the index was created successfully.
Create index pattern
This section lists the required steps to create the index pattern
- Access the Hamburger Menu icon on the top left.
- Select ‘Dashboard Management’ from the bottom of the menu.
- Choose ‘Index Patterns’
- Choose “Create Index Pattern”
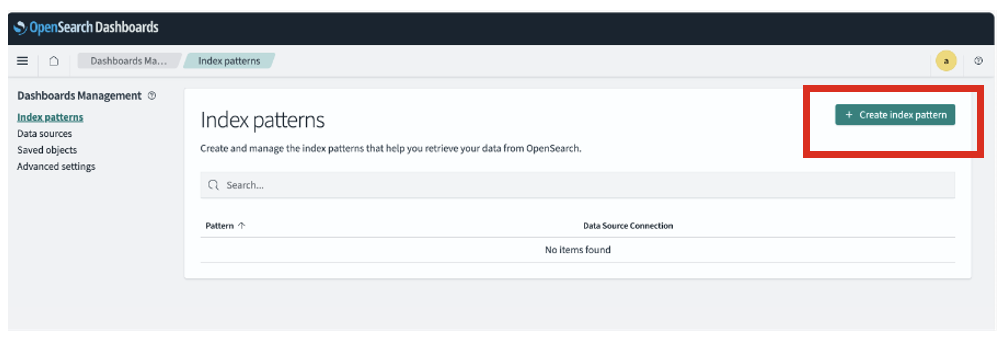
- Enter the Index pattern name and choose “Next step”.
The index pattern name should be the index name you entered during the deployment followed by an asterisk. See the following screenshot for reference.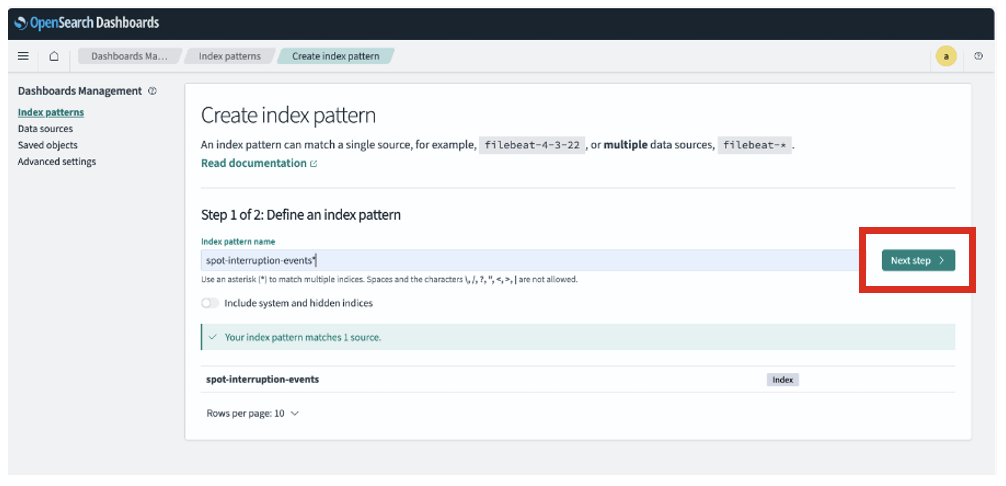
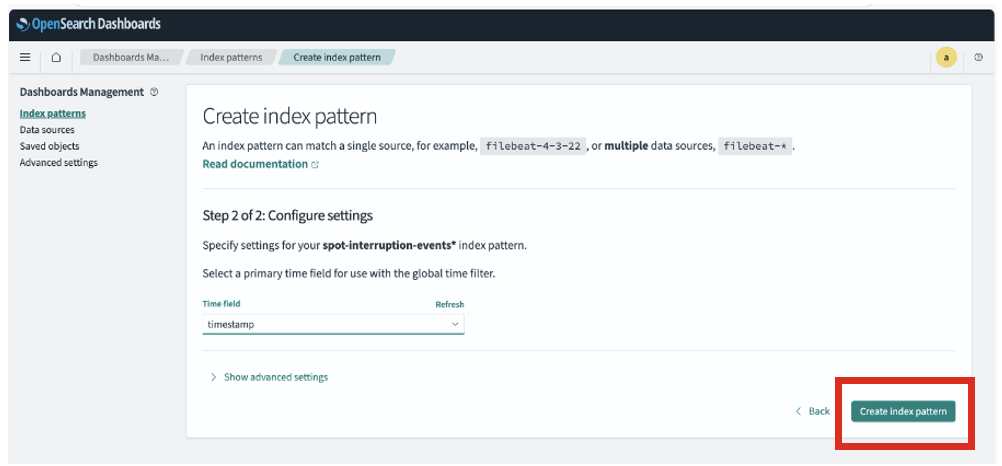
- Select ‘timestamp’ in primary Time field and choose ‘Create index pattern’
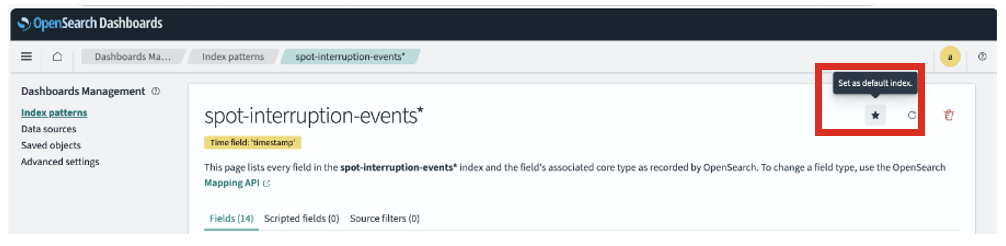
- Choose the star icon to make the index pattern default
Configure Lambda with required access for new index
In this section you will create a role in OpenSearch Service dashboards and will map Lambda execution role to the same to perform operations on the new index.
- Navigate to the Lambda console
- Search for the function beginning with your OpenSearch Service domain name.
- In the function details, go to Configuration > Permissions
- Choose the Role Name in the Execution Role section.
- Copy the Lambda execution role ARN from this function which handles Spot interruption events.
- Access the Hamburger Menu icon on the top left and select ‘Security’ from the bottom of the menu.
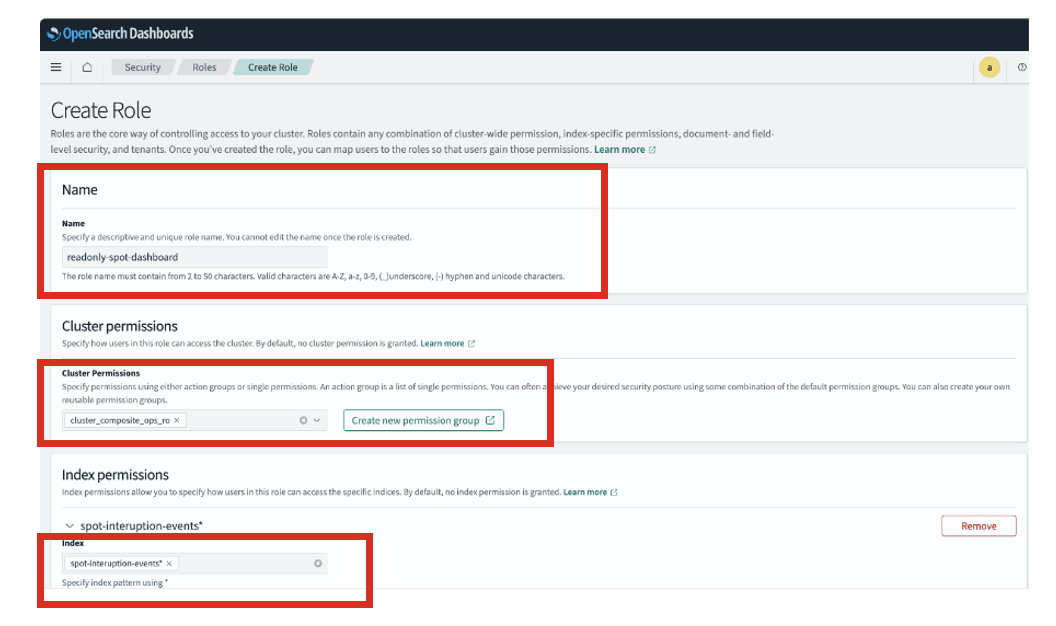
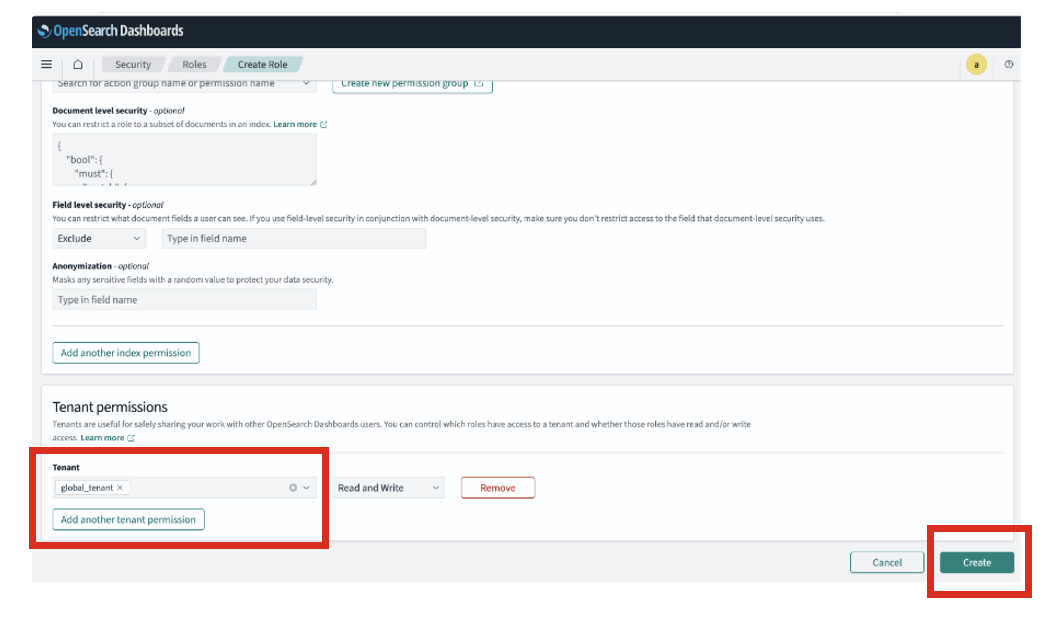
- Now select the ‘Roles’ menu option under ‘Security’ menu and then select ‘Create Role’
- Enter a role name and set Cluster Permissions to “cluster_composite_ops_ro“.
- For Index Permissions, select the index pattern name created during deployment.
See the following screenshot for reference.
- Set the Tenant Permissions to “global_tenant” as seen in the image and Choose “Create”.
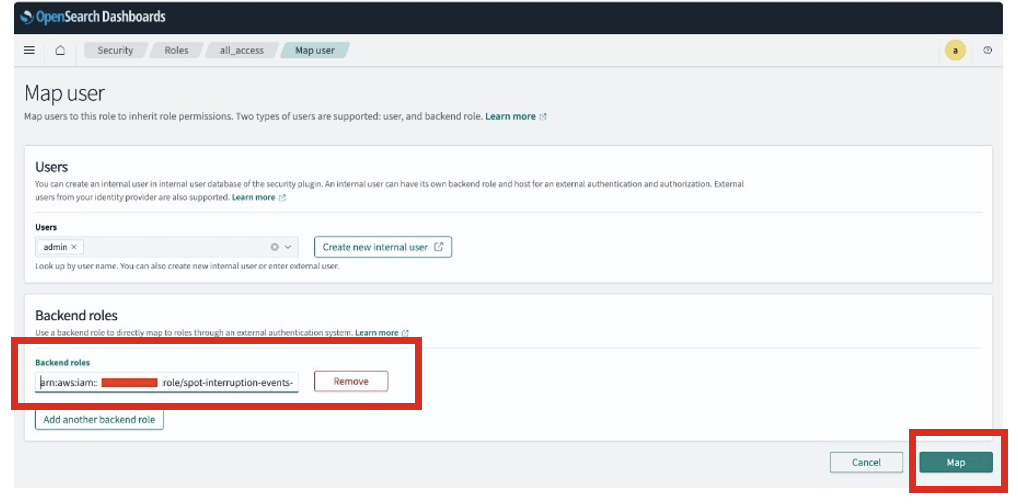
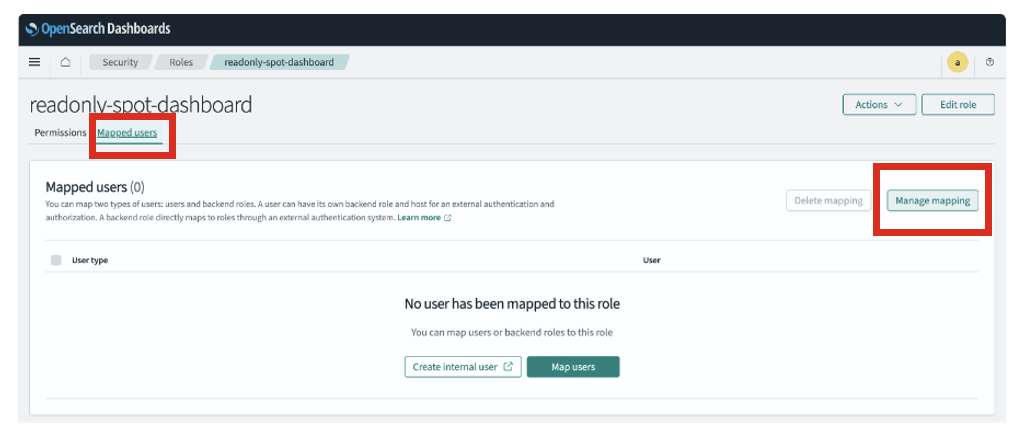
- After the role is created, on the same screen, select the ‘Mapped Users’ tab and choose ‘Manage Mapping’

- Choose ‘Manage Mapping’
- In the ‘Backend roles’ add the Lambda execution role ARN copied earlier and Choose ‘Map’
You can create more users in the internal database and grant appropriate access to the visualisations and dashboards. The following steps show how to create a read only role and to create an internal user and grant read only access.
Manage users and roles
In this section you will create a new user and a role with read-only access, then assign the role to the user to grant them read-only access to the Spot Interruption dashboard and visualizations.
- Access the Hamburger Menu icon on the top left
- Select ‘Security’ from the bottom of the menu
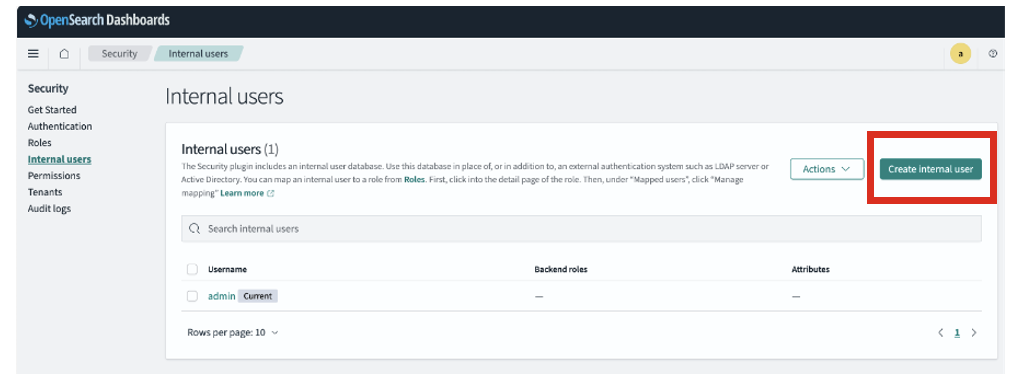
- Select ‘Internal Users’ and then select ‘Create Internal user’
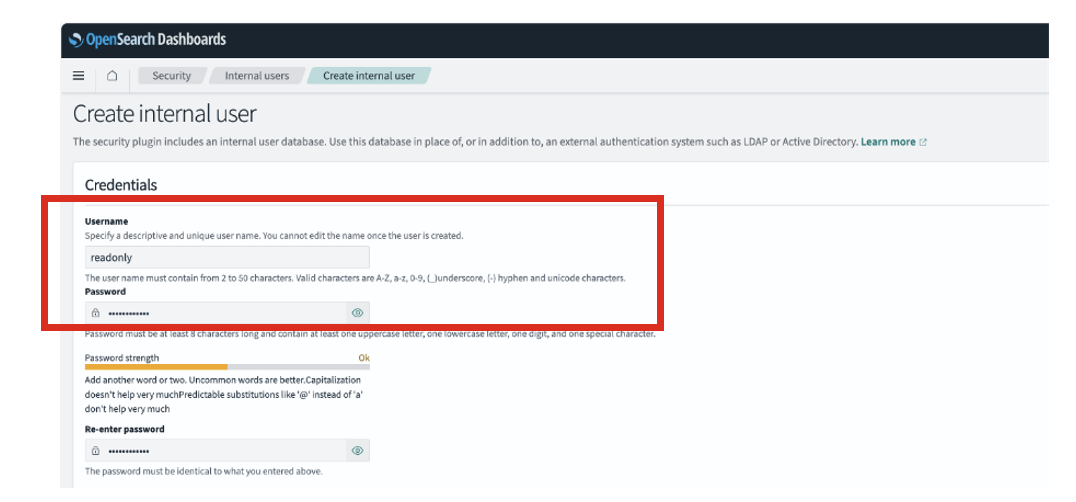
- Enter username and set a Password, then choose “Create”.
- Now select the ‘Roles’ menu option under ‘Security’ menu and then select ‘Create Role’
- Enter the role name and set Cluster Permissions to “cluster_composite_ops_ro“.
- For Index Permissions, select the index pattern name created during deployment.
See the following screenshot for reference.

- Set the Tenant Permissions to “global_tenant” as seen in the image and Choose “Create”.

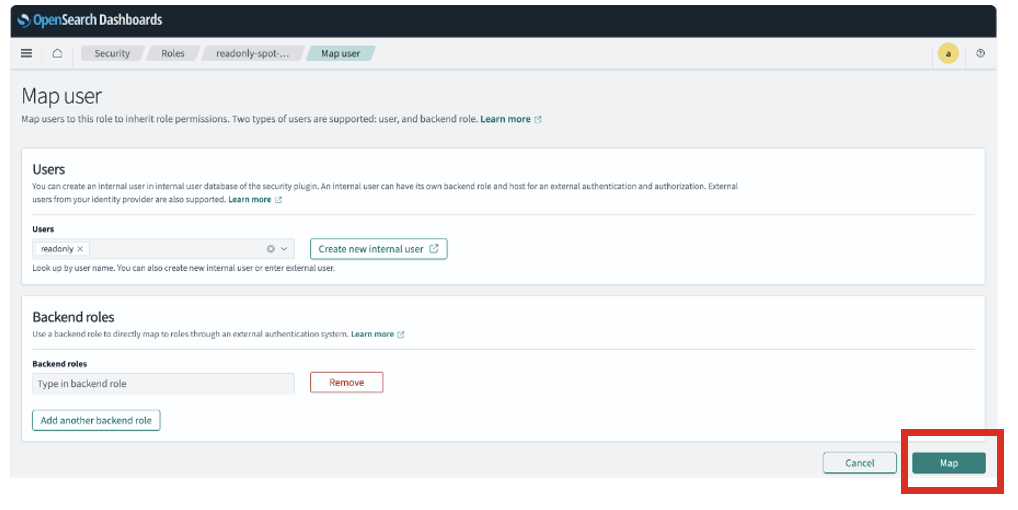
- After the role is created, on the same screen, select the ‘Mapped Users’ tab and choose ‘Manage Mapping’
- Select the user created above in ‘Users’ and choose ‘Map’
Configure and deploy sample visualisations and dashboard
Sample visualizations and a starter dashboard are provided under the data folder of the git repo you cloned earlier. Look for the file named spot-interruption-dashboard-visualisations.ndjson.To import the visualizations:
- Navigate to Saved Objects under Dashboard Management in OpenSearch Dashboards.
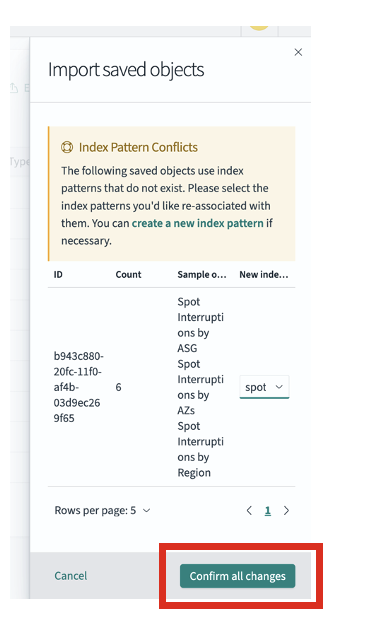
- Import the
spot-interruption-dashboard-visualisations.ndjsonfile. - During the import, you may encounter index pattern conflicts. Select the index pattern you created from the dropdown and choose “Confirm all changes”.
Once imported, the sample visualizations and dashboard linked to your index pattern will be available under Dashboards in the left-side hamburger menu. You can view the Spot Interruption Dashboard, which includes visualizations based on Availability Zones, Regions, Instance Types, Auto Scaling Groups (ASGs), and Interruptions over time. You can further customize by creating your own visualizations using the attributes available in the index or by editing/creating new dashboards. The dashboard will display empty views until Spot interruption data is available to visualize.
Test the solution
A temporary event rule was created during deployment to simulate matching Amazon EC2 Spot interruption notices. The rule name is the name you specified during deployment for the CustomEventRuleName parameter.
To verify the solution, you can send sample events from the EventBridge console as depicted below. In the AWS console,
- Open the Amazon EventBridge console
- In the left menu under ‘Buses’ section choose ‘Event buses’
- Choose the ‘default’ event bus
- Choose the ‘Send events’ button
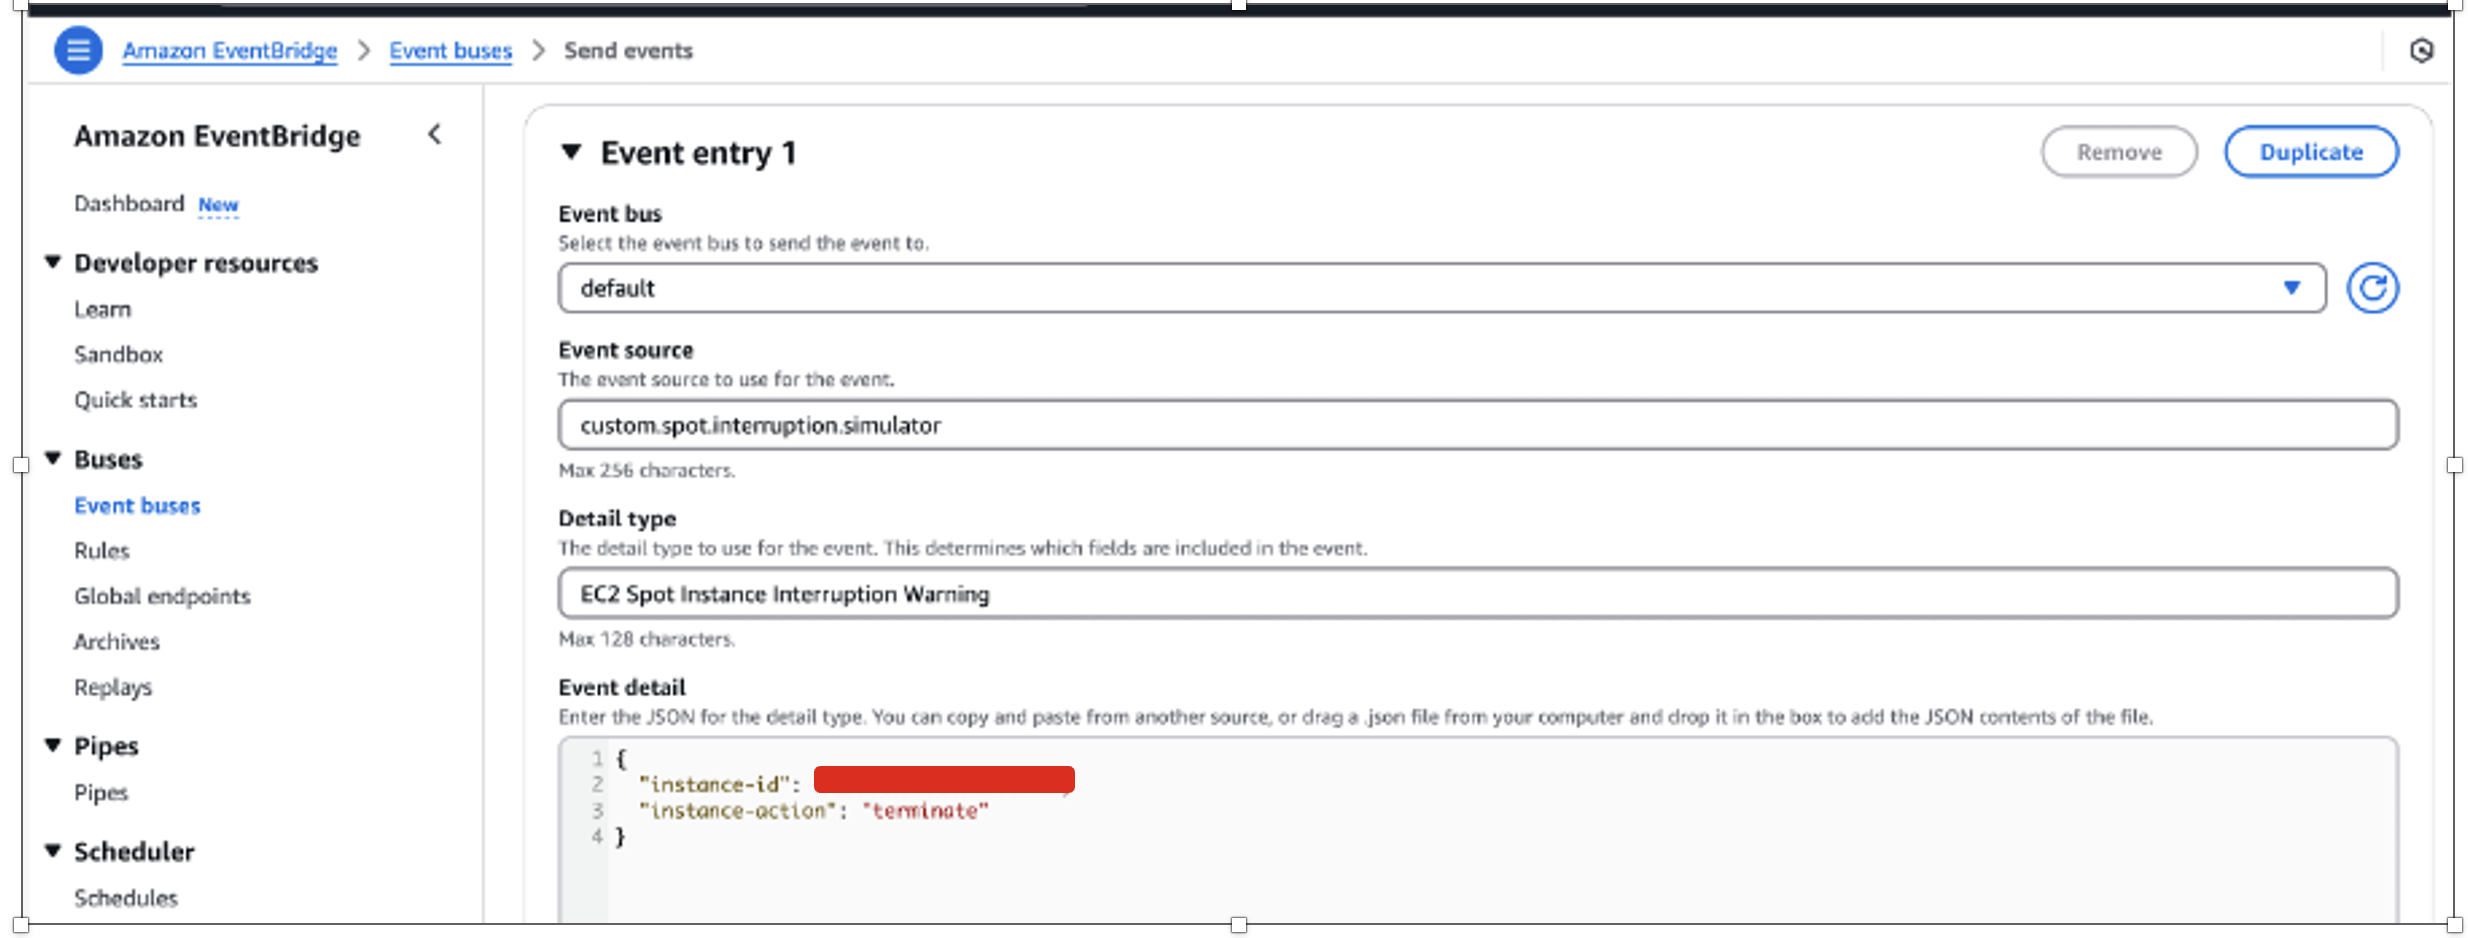
- In the Send events page enter the following details:
- Event bus: default
- Event source: custom.spot.interruption.simulator
- Detail type: EC2 Spot Instance Interruption Warning
- Event detail:
{"instance-id": "<instance-id>", "Instance-action": "terminate"}
Replace the instance-id with an actual instance id that is associated with an Amazon EC2 Auto Scaling group. Refer to the following screenshot.
After the event is sent successfully, you can log in to OpenSearch Dashboards and view the Spot Interruption Dashboard, which has been prebuilt with the indexed event data. This dashboard provides insights across key dimensions such as Availability Zones, Regions, instance types, Auto Scaling groups, and interruption trends over time. Use the dashboard as a starting point to understand the kinds of insights possible and customize or create new visualizations based on your needs and the fields available in the index.
Alternatively, you can navigate to the Discover section in the menu to view the raw event details. Ensure that you select the index pattern you created earlier in this demonstration, and adjust the time range if necessary (such as the last 15 minutes) to view the latest data.
Security and cost optimizations
This solution is designed to be secure and cost-efficient by default, but there are some more optimizations you can apply to further reduce cost and enhance security:
Security best practices
- Amazon Cognito Authentication : Integrate Amazon Cognito with OpenSearch Dashboards to manage user authentication, enable Multi Factor Authentication, and avoid hardcoding admin credentials. More information Configuring Amazon Cognito authentication for OpenSearch Dashboards
- Lambda Layer Versioning: Ensure pinned versions of Lambda Layers are used to avoid unexpected changes. More information Managing Lambda dependencies with layers
- Logging and Threat Detection: Enable AWS CloudTrail and Amazon GuardDuty to monitor for unauthorized activity or anomalies. More information Monitoring Amazon OpenSearch Service API calls with AWS CloudTrail
Cost optimizations
- Bulk Indexing with Throttling Controls: Lambda processes batches and respects throttling limits to avoid excessive OpenSearch usage.
- Short Retention for CloudWatch Logs: Tune log retention periods to avoid unnecessary storage costs.
- Optimize Visualizations: Design saved visualizations to avoid expensive queries (like wide time ranges and large aggregations). More information Optimizing query performance for Amazon OpenSearch Service data sources
- Index State Management (ISM) : Configure ISM policies in OpenSearch to delete or archive older interruption data. More information Index State Management in Amazon OpenSearch Service
Cleanup
Run the following command to delete the resources deployed earlier.
After deleting the stack, make sure to also remove any post-deployment configurations you may have created within the OpenSearch Service dashboards console. While these configurations won’t incur additional costs, it’s considered a best practice to clean up your environment by deleting any resources that are no longer needed. Take some time to review the OpenSearch Service dashboards and identify any custom settings, dashboards, or visualizations you set up during the deployment process. Then, delete these individual configurations to ensure your environment is fully cleaned up.
Conclusion
In this post, you learned how to build and deploy a comprehensive Spot Instance interruption monitoring solution for Auto Scaling groups by using EventBridge, Amazon SQS, Lambda, and OpenSearch Service. You implemented an event-driven pipeline to capture and process Amazon EC2 Spot Instance interruption events, created secure analytics dashboards, and established real-time visibility into interruption patterns across your Auto Scaling group–managed workloads.
This post’s solution empowers your teams with the visibility and agility needed to operate confidently with Amazon EC2 Spot Instances. By combining event-driven architecture with secure, scalable analytics, you can now proactively monitor interruption events, identify interruption trends, and optimize workload strategies for resilience and cost-efficiency.
With real-time data at your fingertips, you’re equipped to make smarter infrastructure decisions and maximize the benefits of Spot Instance capacity while minimizing disruption risks.