AWS DevOps & Developer Productivity Blog
Automate SageMaker HyperPod incident triage and root-cause-analysis with AWS DevOps Agent
Introduction
Large-scale machine learning workloads: training, fine-tuning, and inference run on clusters of hundreds to thousands of GPU instances for days or weeks at a stretch. Keeping operational visibility across a fleet of this size is a constant challenge: hardware health events, node lifecycle transitions, capacity fluctuations, and workload-level issues appear in the event stream around the clock, including nights and weekends.
Amazon SageMaker HyperPod is a purpose-built managed cluster service that lets you run distributed model training, fine-tuning, and inference across hundreds of accelerated instances. It provides built-in resiliency that automatically detects and replaces faulty hardware, so long-running jobs can continue with minimal interruption.
For teams operating these clusters, the scale still creates a fundamental tension: you need continuous visibility into your fleet, but you can’t afford to keep engineers watching the event stream 24/7.
What HyperPod resiliency already handles
SageMaker HyperPod’s built-in resiliency layer automatically detects and self-heals instance-level GPU failures. When the Health Monitoring Agent (HMA) identifies a bad GPU, the HyperPod resiliency layer drains, reboots, or replaces the node depending on the error type, and the job resumes without human intervention. This is exactly what you want: routine hardware failures are handled automatically so your training runs keep going.
This solution does not replace HMA or any part of HyperPod’s resiliency. It adds an autonomous investigation layer on top, using the cluster events and health signals that HMA and HyperPod already produce as its input.
Operational conditions where a human still wants to be in the loop
With that self-healing in place, there are operational conditions where a human still wants to be in the loop or decide:
- Configuration issues: a lifecycle-script change you made, a misconfigured mount, or a networking/security change that causes provisioning failures on every new node.
- Capacity conditions: a replacement waiting on capacity in the pool, where the operator needs to know recovery is in flight and can decide whether to intervene.
- Recurring hardware faults: each fault self-heals correctly, but the same GPU error signature recurring across three or more replacements on one instance group in a week is a pattern worth surfacing to an operator as a single signal.
- Workload-level conditions: Pods stuck in CrashLoopBackOff for hours, nodes sitting NotReady, or GPU allocation chronically low.
Without automation, these conditions push operators into round-the-clock manual triage: correlating events across the SageMaker control plane, Amazon EKS, and Amazon CloudWatch, and deciding whether HyperPod is still recovering or needs a hand.
Opportunity: AWS DevOps Agent as a 24/7 companion
AWS DevOps Agent provides an autonomous incident-response platform that can be taught a domain’s operational model through custom skills. By wiring your HyperPod cluster into DevOps Agent, you get a 24/7 companion that complements HyperPod’s self-healing. It watches for the operational conditions that still need a human decision, triaging them, root-causing them, and delivering a clear verdict with recommended actions.
By design, DevOps Agent is configured to run in observe-and-report mode for this integration – it is not granted SSM, SSH, or action-taking permissions against your cluster or its nodes. The agent reads cluster events, control-plane state, Kubernetes objects, and CloudWatch logs to reconstruct what happened; every corrective action (node reboots, replacements, drains) continues to be performed by HyperPod’s own resiliency layer or by an operator responding to the emailed verdict. This read-only boundary is deliberate: it keeps the agent’s blast radius zero while still delivering the correlation and triage value.
In this post, you will learn how to connect any SageMaker HyperPod cluster (either the EKS or Slurm Orchestrator option) to AWS DevOps Agent. Conditions are auto-detected, triaged, root-caused from cluster state and CloudWatch logs, and emailed as a clear verdict. You will also see how the solution can be extended to detect additional conditions specific to your workloads.
Solution Overview
What this solution delivers
This solution wires any SageMaker HyperPod cluster into AWS DevOps Agent so that operational conditions calling for a human decision are auto-detected, triaged, root-caused, and delivered as a human-readable verdict email. Specifically, you get:
- Autodetection of HyperPod conditions that complement resiliency self-healing, from the live SageMaker event stream and a periodic Kubernetes-state audit.
- Triage + root-cause analysis by the DevOps Agent, taught HyperPod’s operational model via two custom skills. It reconstructs the incident timeline and decides whether HyperPod is still recovering or needs an operator.
- Human-readable verdict emails: Monitor (recovery in flight, here’s the ETA), Escalate (you need to act, here’s why and what to do), or Resolved (auto-recovery closed the loop). Noise is filtered out.
- Extensibility: customize what conditions are detected (by modifying the periodic-audit Lambda) and how the agent reasons about them (by editing the plain-English skills).
The following screenshot shows the DevOps Agent incident response dashboard with example verdict emails for three common fault types:
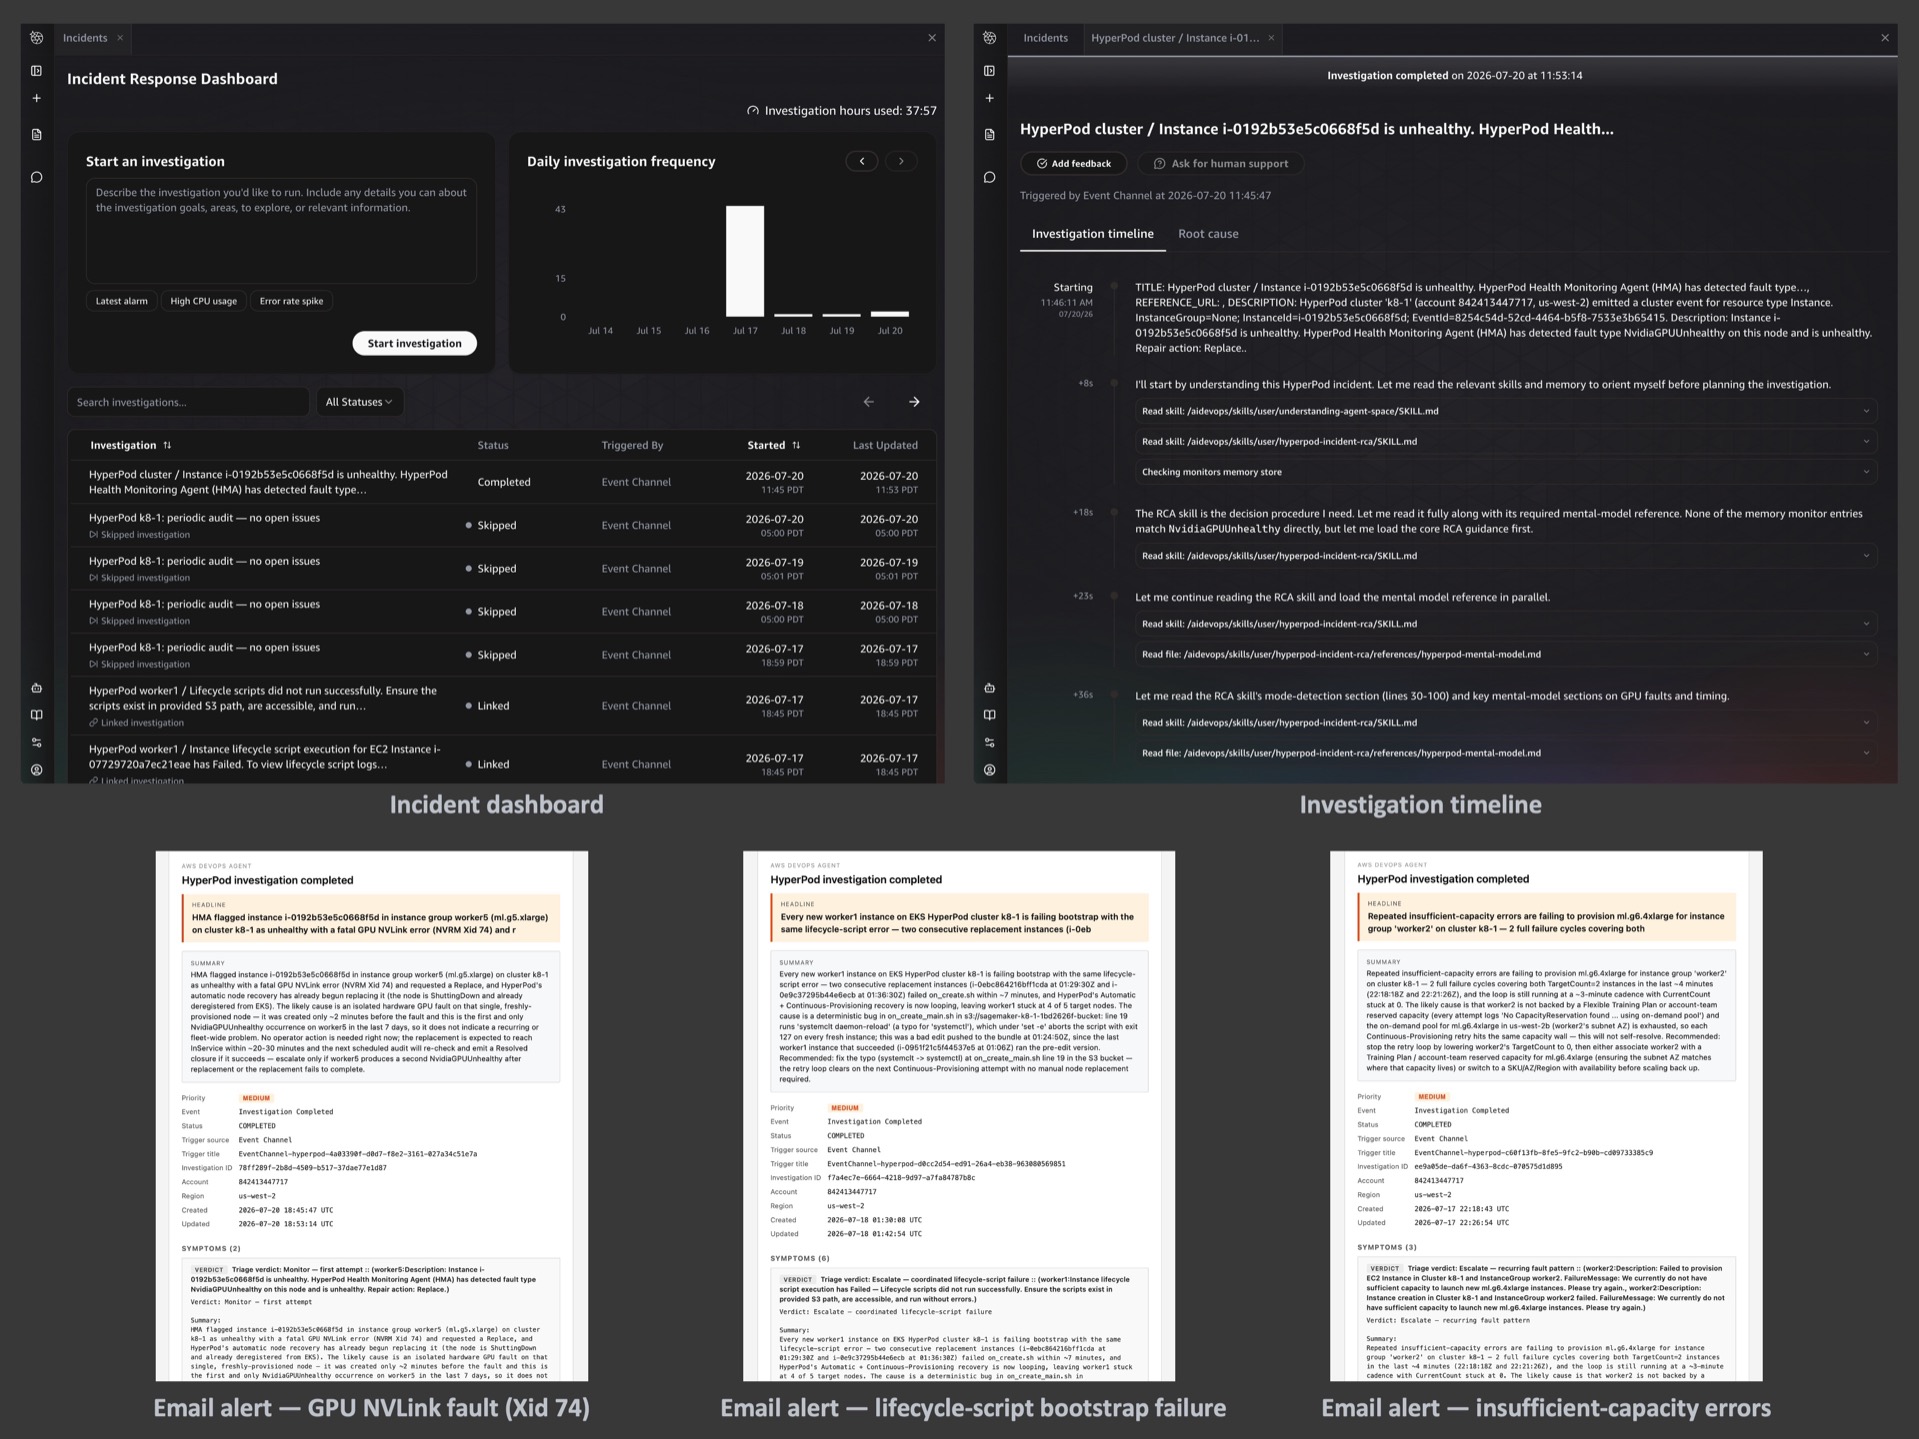
DevOps Agent incident response dashboard showing investigation list and timeline, with three email verdict examples for GPU NVLink fault, lifecycle-script bootstrap failure, and insufficient-capacity errors
Architecture
The whole solution deploys one AWS CloudFormation stack per cluster. Two event paths feed the DevOps Agent, and one path carries its verdicts back out to you.
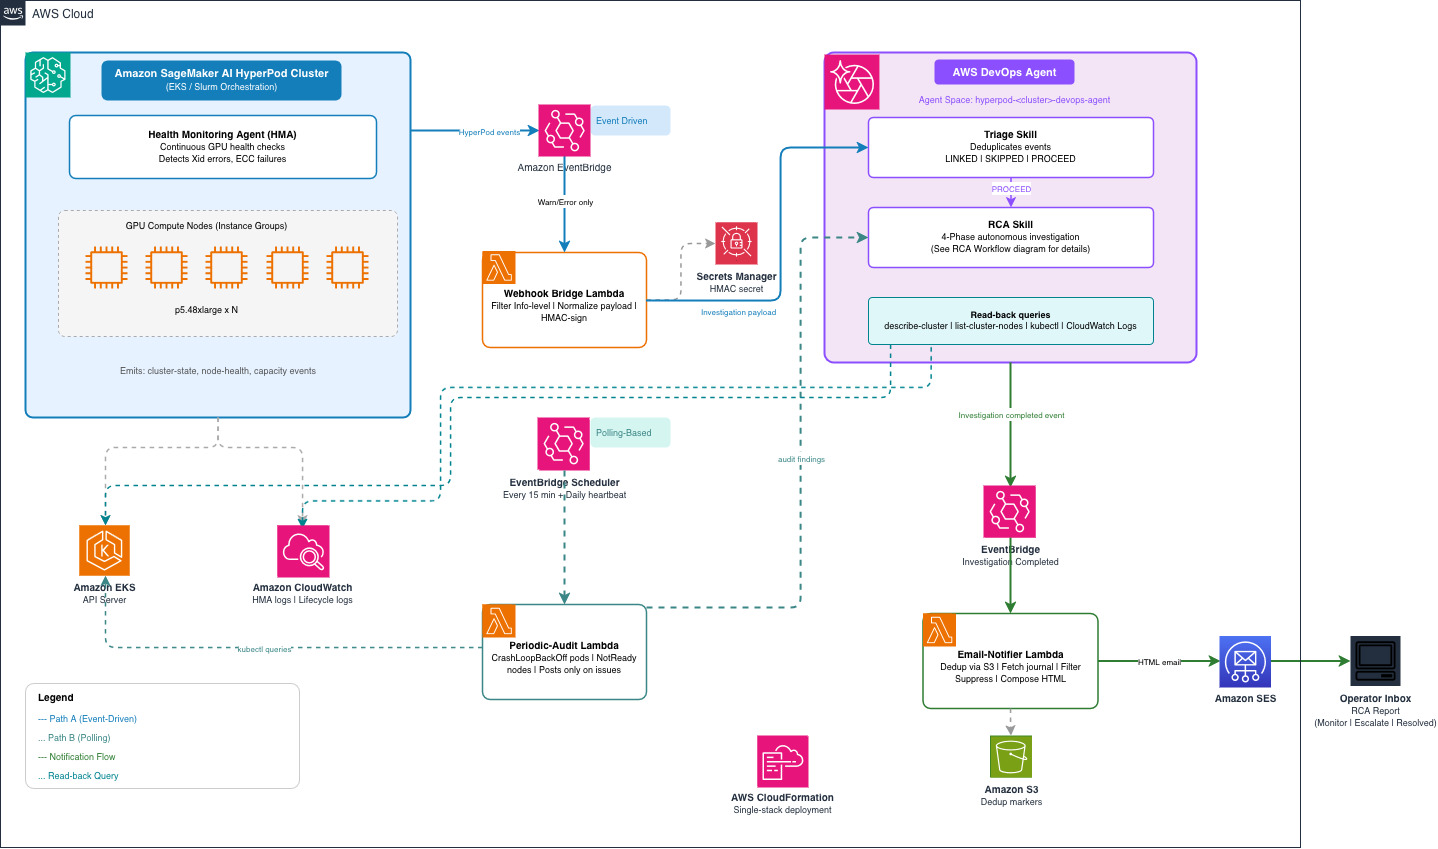
Architecture diagram showing the event flow from HyperPod Health Monitoring Agent through EventBridge to DevOps Agent and email notification
This architecture shows a 1:1 relationship between a HyperPod cluster and a DevOps Agent space, and the deployment instructions in this post follow that model. If you need to associate multiple clusters with a single Agent Space, you can customize the CloudFormation template and the ClusterFilter parameter to widen the allowlist of cluster names forwarded by the webhook bridge.
Event flow
- Event-driven issue detection: HyperPod emits cluster-state, node-health, and capacity events to Amazon EventBridge. The webhook bridge Lambda drops routine Info-level noise, maps the rest into a DevOps Agent investigation payload, signs it with HMAC-SHA256 using a shared secret stored in AWS Secrets Manager, and POSTs it to the agent’s generic webhook.
- Polling-based issue detection: A periodic-audit Lambda checks Kubernetes state (CrashLoopBackOff pods, NotReady nodes) every 15 minutes and fires only when it finds a real issue, plus a daily heartbeat confirming the pipeline is alive. On a healthy cluster, nothing is POSTed, so no investigation runs and no cost is incurred.
- Investigation: DevOps Agent receives the payload and runs two custom skills: the triage skill decides whether to link (duplicate), skip (noise), or proceed (investigate). The RCA skill reconstructs the timeline using describe-cluster, list-cluster-nodes, list-cluster-events, kubectl, and CloudWatch logs (HMA health monitoring, lifecycle scripts), then classifies the incident as Suppress, Monitor, Escalate, or Resolved.
- Notification: An Amazon Lambda function sends notification emails via Amazon SES. It listens on the
aws.aidevopsevent stream for investigation completions, reads the verdict from the agent’s journal, and sends an email with the headline, what happened, likely cause, and recommended action. Suppress verdicts are filtered to avoid noise on healthy clusters.
Getting started
For a step-by-step walkthrough to deploy this solution, visit the DevOps Agent Integration guide. Once you have the solution running, the following sections explain how to customize detection, reasoning, and notifications for your environment.
Prerequisites
- An AWS account with AWS CLI v2 configured for the target region.
- An existing SageMaker HyperPod cluster (EKS or Slurm orchestrator).
- IAM permissions to create roles, deploy CloudFormation, manage Secrets Manager, and call devops-agent:* and eks:CreateAccessEntry.
- For email notifications: a verified Amazon SES sender identity. You can verify an email address in the Amazon SES console or with the AWS CLI. After running the command below, the address owner will receive a verification email and must click the confirmation link:
Recipients must also be verified if your SES account is still in sandbox mode.
Deploying with CloudFormation
The solution deploys as a single CloudFormation stack. Clone the awsome-distributed-ai repository, create a params.json with your cluster name and email settings, and run:
This provisions the Agent Space with read-only EKS access (auto-discovered from the cluster’s orchestrator ARN), the EventBridge rule and webhook bridge Lambda, the periodic-audit scheduler, and the email notifier. For Slurm-orchestrated clusters, the EKS access step is skipped automatically.
The webhook bridge — mapping HyperPod events to DevOps Agent
An EventBridge rule captures HyperPod events and invokes a Lambda function. The Lambda forwards all Warn and Error level events, normalizing each into a DevOps Agent investigation payload. It extracts the failure message, instance group, and event metadata, then signs it with HMAC using a shared secret stored in AWS Secrets Manager, and POSTs it to the agent’s generic webhook endpoint. Info-level events are dropped at the bridge to avoid creating investigations for routine status updates.
A cluster allowlist parameter lets you scope which HyperPod clusters trigger investigations, useful when multiple clusters share the same account and region.
How the skills are defined — teaching the agent HyperPod’s operational model
AWS DevOps Agent skills are plain-English instructions that teach the agent how to reason about a domain. This solution includes two complementary skills:
Triage skill — LINKED / SKIPPED / PROCEED (view the skill document)
The triage skill runs first on every incoming task. It decides whether to link the event to an existing investigation, skip it, or proceed to a full investigation.
- Why triage matters — a concrete example: When a single node fails, HyperPod’s replacement process emits multiple events in quick succession: “lost orchestration-ready status,” “provisioning started,” “capacity request initiated.” Without triage, each event would spawn a separate investigation. The triage skill recognizes these events belong to the same incident (same instance group + overlapping time window) and links them, so only one investigation runs. This saves investigation compute and avoids duplicate emails.
- When to SKIP: When a node is already being replaced and a follow-up “lost orchestration-ready status” event arrives with a generic “Request to service failed” message, the triage skill recognizes that a replacement is already in progress for that instance group and skips the event. No new investigation is created for what is simply a progress update of an existing recovery.
RCA skill — timeline reconstruction and verdict (view the skill document)
When triage produces PROCEED, the RCA skill takes over. It reads cluster state, events, and logs, reconstructs an incident timeline, and classifies the situation into one of four verdicts:
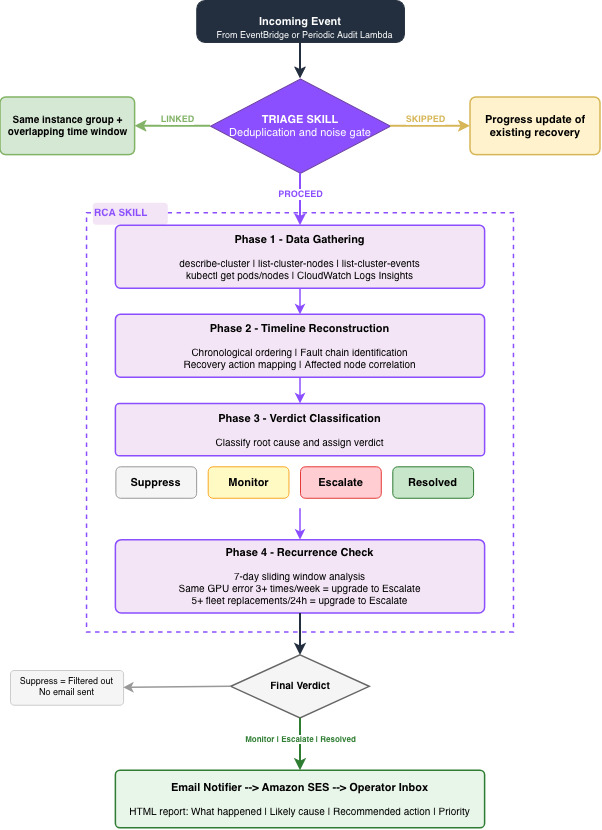
RCA Flowchart showing the four phases of root-cause analysis: data gathering, timeline reconstruction, classification, and recurrence check
- Phase 1 — Data gathering: The skill reads describe-cluster, list-cluster-nodes, list-cluster-events, and CloudWatch log streams (HMA health monitoring, lifecycle scripts) to collect the raw facts.
- Phase 2 — Timeline reconstruction: It orders events chronologically and identifies the fault chain: what triggered what, which nodes were affected, and what recovery actions HyperPod took.
- Phase 3 — Classification: Based on the timeline, recurrence statistics, and HyperPod’s resiliency behavior, it assigns a verdict:
- Suppress — a non-issue (for example, a transient event that has already resolved).
-
- Monitor — recovery is in flight; here’s the expected resolution window.
-
- Escalate — you need to act; here’s the root cause and recommended action.
- Resolved — auto-recovery closed the loop; no action needed.
- Phase 4 — Recurrence check: The skill computes sliding-window statistics over the one week cluster event history. When thresholds are crossed, the verdict escalates to alert the operator of a systemic pattern. For example, the same GPU error signature on the same instance group three or more times in a week, or five or more replacements fleet-wide in 24 hours.
The verdict is written to the agent’s investigation journal along with a human-readable report containing what happened, the likely cause, and recommended operator actions.
The periodic-audit Lambda — Kubernetes state monitoring
The periodic-audit Lambda fires every 15 minutes and inspects Kubernetes Pod/Node state directly (via the EKS API server). It checks for:
- Pods in CrashLoopBackOff (default: flagged when restart count reaches five and the last crash is within 15 minutes)
- NotReady nodes (default: flagged when a node has been NotReady for at least 15 minutes and at least 10% of nodes are affected)
Namespace-aware filtering controls which pods are checked:
- Pods in
kube-publicandkube-node-leaseare ignored entirely by default.
- Pods in
kube-system,aws-hyperpod, andamazon-cloudwatchare tagged as system-workload issues (distinct from user-workload issues in the verdict).
All thresholds and namespace lists are configurable via the CloudFormation stack parameters.
The Lambda POSTs a webhook event to DevOps Agent only when a real issue is found. On a healthy cluster, nothing is POSTed, so no investigation runs and no cost is incurred. A separate daily heartbeat schedule confirms the monitoring pipeline itself is alive. The heartbeat is visible in the DevOps Agent console but deliberately not emailed on healthy runs — so silence in your inbox means the cluster is healthy, not that the pipeline is broken.
Note: HyperPod infrastructure faults (node health, capacity errors, lifecycle-script failures) are handled event-driven by the webhook bridge. They come from the native HyperPod event stream in EventBridge. The periodic audit deliberately does not duplicate that path; it only covers Kubernetes workload state, which is not in the HyperPod event stream.
Closing the loop — the email notifier
An EventBridge rule on the aws.aidevops event stream captures investigation lifecycle events. The email-notifier Lambda processes these events through the following steps:
- Event filtering: Only “Investigation Completed” events are processed (one email per investigation lifecycle). The event payload contains the agent_space_id, task_id, and execution_id.
- Dedup: The Lambda checks an S3 marker at
s3://<bucket>/emailed/<execution_id>. If present, this investigation has already been emailed and the event is dropped. This prevents duplicate emails when the same completion event is re-emitted. - Fetching the investigation context: The Lambda calls two DevOps Agent APIs:
get_backlog_task(agentSpaceId, taskId)— retrieves the task metadata (title, priority, timestamps).list_journal_records(agentSpaceId, executionId)— retrieves the investigation’s findings, symptoms, and investigation gaps from the agent’s journal.
- Suppress-verdict filtering: If the investigation produced a Suppress verdict or no findings at all, no email is sent.
- Email composition: The Lambda composes a single HTML email from the journal records: a short headline followed by a one-paragraph summary covering what happened, the likely cause, and the recommended action.
- Send via SES: The formatted email is sent to the configured recipients. After successful delivery, the S3 dedup marker is written.
The operator also has access to the full investigation in the DevOps Agent web console (see following “Viewing investigations” section).
Viewing investigations in the DevOps Agent console
For readers new to AWS DevOps Agent, here’s how to navigate to your investigations:
- Open the AWS DevOps Agent console.
- Select your Agent Space (named
hyperpod-<cluster-name>-devops-agentby default). - From the Launch web app drop-down, choose an option to open the DevOps Agent web app.
- Select Incidents from the left navigation pane to open the Incident Response Dashboard. It lists all investigations with their subject, status, and timestamp.
- Select any investigation to see its full timeline, journal records, and the verdict report.
Asking the agent directly — the DevOps Agent Chat UI
Beyond the automated emails, you don’t have to wait for the next investigation to get answers about your cluster. You can open the DevOps Agent’s AI chat at any time and ask follow-up questions in plain English. The agent answers from the live cluster state, the investigation history, and the skills it has been taught.
For example:
- “I got an email about a GPU failure in my cluster. Did it get resolved now with HyperPod’s resiliency?” — The agent checks the current cluster state, confirms whether the replacement succeeded, and provides a timeline of what happened (HMA detection → replacement initiated → node back in service), along with anything to watch for.
- “Are there unhealthy Pods on my cluster?” — The agent inspects the Kubernetes state and reports any CrashLoopBackOff pods or NotReady nodes.
- “I just triggered scaling up. Check if it is progressing well.” — The agent looks at the cluster’s current node counts vs. target counts and reports whether provisioning is on track.
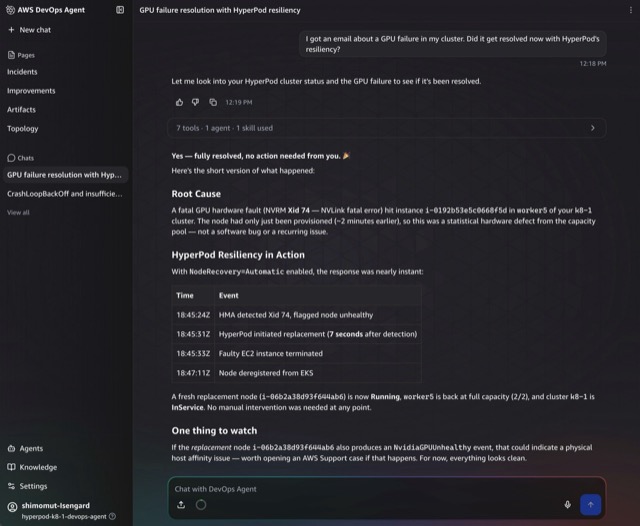
AWS DevOps Agent chat interface showing a natural language query about cluster health
The chat conversations are stored per Agent Space, so you can revisit past interactions alongside the automated investigations. This makes the Agent Space a single pane of glass for both automated incident response and ad-hoc troubleshooting of your HyperPod cluster.
Extending the solution — detection vs. reasoning
The solution has two extension points, which serve different purposes:
- Extending detection (what conditions are caught):
- Event-driven path: The webhook bridge Lambda drops Info-level events and forwards all
WarnandErrorlevel HyperPod events to DevOps Agent. This typically does not need modification. It already catches all actionable events. - Polling-based path: The periodic-audit Lambda checks Kubernetes state. To detect additional conditions (for example, GPU allocation below a threshold or specific Pod labels stuck in error states), add that logic to the Lambda code.
- Event-driven path: The webhook bridge Lambda drops Info-level events and forwards all
- Extending reasoning (how the agent investigates and classifies): edit the plain-English skill definitions. For example, you can teach the RCA skill new classification rules, add domain-specific context about your workload’s expected behavior, or adjust the recurrence thresholds.
Detection is code; reasoning is natural language. Both are in the repo and designed to be customized independently.
Investigation feedback
After each investigation completes, a Feedback button appears in the DevOps Agent console. Clicking it opens the Investigation feedback dialog, where you can:
- Rate whether the root cause was correct
- Indicate whether human steering was needed during the investigation
- Provide written feedback explaining what could be improved
This structured feedback is stored per investigation. An auto-learning mechanism that uses this feedback to improve future investigations is actively being developed.
DevOps Agent APIs used by this solution
For readers interested in the programmatic integration, here are the key DevOps Agent APIs this solution calls:
| Component | API | Purpose |
| Webhook provisioner (deployment) | register_service | Register the generic webhook service with DevOps Agent |
| Webhook provisioner (deployment) | associate_service | Associate the webhook with the Agent Space |
| Skill uploader (deployment) | list_assets | Check if a skill already exists |
| Skill uploader (deployment) | create_asset / update_asset | Upload or update the triage and RCA skill definitions |
| Email notifier (runtime) | get_backlog_task | Retrieve task metadata (title, priority, timestamps) |
| Email notifier (runtime) | list_journal_records | Retrieve findings, symptoms, and gaps from the investigation journal |
| Teardown | disassociate_service / deregister_service / delete_asset | Clean up on stack deletion |
Cleaning up
To remove all resources created by this solution, run:
This deletes the CloudFormation stack, removes the Agent Space, EKS access entries, secrets, and email configuration.
Additionally, if you no longer need the prerequisite resources, you can revert their setup, for example, deleting the verified Amazon SES email address identities you created for notifications.
Cost considerations
This solution is designed to be near-zero cost on a healthy cluster and scales proportionally with fault volume. Cost scales with fault volume, not node count directly. At large scale (100+ nodes), the triage skill becomes critical. A single hardware fault can generate 5-10 correlated EventBridge events, most of which are filtered by the webhook bridge Lambda before reaching the agent. Where triage adds value is linking and deduplicating across similar faults that affect multiple instances, or repeated faults on the same instance over time, consolidating them into a single investigation instead of many. As an example, a 500-node training cluster might see 20-50 investigations per month after filtering and deduplication.
- Filtering and triage are your cost savers at scale. The webhook bridge filters correlated events from a single node failure (5-10 EventBridge events reduced to 1 forwarded event), eliminating redundant investigations at the source. Triage then links similar faults across multiple instances into a single investigation. For example, if 5 nodes hit the same GPU error in a window, triage consolidates them into 1 investigation instead of 5 (saving 4 × $4 = $16). The bigger the cluster, the more both layers save.
- Investigation duration grows sub-linearly. A 1000-node cluster investigation doesn’t take 100x longer than a 10-node one. The agent queries describe-cluster and list-cluster-events once regardless of size. The data returned is bigger, but the API call count is similar.
- CloudWatch Logs queries are the variable. On large clusters, the agent may query more HMA log streams, which takes longer agent-seconds AND incurs CloudWatch Logs Insights charges on your account (not part of DevOps Agent pricing).
DevOps Agent (the primary cost driver): Estimates based on 2 accelerator instances in a cluster
| Component | Pricing | Your cluster estimate |
| Investigations | $0.0083/agent-second | ~$4/investigation (at 8 min avg) |
| Chat (on-demand SRE tasks) | $0.0083/agent-second | ~$0.25/chat query (at 30 sec avg) |
| Daily heartbeat | $0.0083/agent-second | ~$1-2/day (short investigation confirming health) |
On a healthy cluster with no faults, only the daily heartbeat fires, approximately $30-60/month in DevOps Agent time. On a cluster experiencing 5 real faults per week (typical for a large GPU fleet), expect ~20 investigations/month × $4 each = $80/month in investigation costs.
Free tier and credits:
New DevOps Agent customers receive a 2-month free trial (20 hours of investigations, 20 hours of chat per month). Enterprise Support customers receive monthly credits equal to 75% of their AWS Support charge toward DevOps Agent usage.
Supporting infrastructure (secondary costs):
| Component | Monthly Cost Estimates |
| Lambda invocations | ~96/day (15-min audit) + event-driven = well within free tier |
| S3 (skills + dedup markers) | < $0.01 (a few MB total) |
| Secrets Manager (1 secret) | $0.40 |
| EventBridge rules | Negligible (per-event pricing) |
| SES emails | $0.10/1000 emails — at most 1 per investigation |
| CloudWatch Logs (Lambda) | < $1 (minimal log volume) |
Total estimated monthly cost:
| Scenario | DevOps Agent | Infrastructure | Total |
| Healthy cluster (no faults) | ~$30-60 (heartbeat only) | < $2 | ~$32-62/month |
| Moderate faults (5/week) | ~$80-120 | < $2 | ~$82-122/month |
| Heavy faults (20/week) | ~$320-400 | < $5 | ~$325-405/month |
How cluster size impacts cost
| Factor | Small cluster (1-10 nodes) | Large cluster (100-1000 nodes) |
| Fault frequency | Rare (maybe 1-2/week) | Constant (NVIDIA reports ~1 fault/2-3 hours at 10K GPU scale) |
| Events per fault | Few (1 node replacement = 3-5 events) | More (cascading replacements, capacity queuing) |
| Investigation duration | Shorter (less state to read, fewer events in timeline) | Longer (more nodes to describe, more events to correlate, larger CloudWatch log groups to query) |
| Triage value | Low (few duplicates) | High (one fault generates many correlated events — triage links them into 1 investigation) |
| Periodic audit | Fast (few pods/nodes to check) | Slower (more K8s state to inspect) |
| Cluster Size | Faults/month | Investigations | Est. Agent Cost |
| 1-10 nodes (your test) | 2-5 | 2-5 + heartbeat | $8-20/mo + ~$30 heartbeat |
| 10-50 nodes (typical prod) | 5-20 | 5-15 (triage dedup) | $20-60/mo + ~$30 heartbeat |
| 100-500 nodes (large training) | 50-200 | 20-50 (heavy triage) | $80-200/mo + ~$45 heartbeat |
| 1000+ nodes (frontier) | 200-700 | 50-100 (massive dedup) | $200-500/mo + ~$60 heartbeat |
Cost control levers:
- Disable the periodic audit (EnablePeriodicAudit: false) to eliminate the heartbeat cost. Live event bridging still works.
- Triage (LINK/SKIP decisions) runs at task creation time. No investigation cost is billed for deduplicated or skipped events.
- Suppress verdicts filter email notifications but the investigation still runs. If you want to eliminate that cost, tune your EventBridge rule to drop more event types at the bridge level.
Comparison to manual monitoring:
Without automation, each fault requires an on-call engineer to manually correlate events across CloudWatch, EKS, and the SageMaker console, typically 30-45 minutes of triage before they even know whether HyperPod is self-healing or needs intervention. This solution delivers a root-caused verdict in minutes at ~$4 per investigation, while providing 24/7 coverage without human wake-ups. The cost savings compound with cluster scale: at 20 faults per month, that’s 10-15 hours of engineering triage replaced by automated verdicts.
Conclusion
In this post, we showed how to build an end-to-end agentic incident-response pipeline for SageMaker HyperPod using AWS DevOps Agent. The solution complements HyperPod’s built-in resiliency by watching for the operational conditions where a human still wants to be in the loop: configuration issues affecting provisioning, capacity-bound recoveries, recurring hardware fault patterns, and workload-level conditions. It delivers clear, root-caused verdicts to the operator’s inbox.
The broader takeaway is a reusable pattern: teaching an AI agent a domain’s operational model through plain-English skills, so it can distinguish “the system is recovering on its own” from “this needs a human decision.” This pattern applies beyond HyperPod to any event-driven AWS service where operational conditions benefit from automated correlation and triage.
What’s next
To deploy the solution, follow the step-by-step instructions in the DevOps Agent Integration guide on the AI on SageMaker HyperPod site. Once it’s running, you can customize it for your environment:
- Adjust the CloudFormation parameters: tune the periodic-audit schedule, CrashLoopBackOff thresholds, NotReady node percentages, namespace filtering, and email recipients. No code changes required.
- Extend detection: modify the periodic-audit Lambda to check for additional Kubernetes conditions specific to your workloads (for example, GPU allocation below a threshold, specific Pod labels stuck in error states).
- Extend reasoning: edit the triage or RCA skill definitions to adjust classification rules, add domain context about your expected cluster behavior, or tune the recurrence thresholds.
- Add notification channels: connect Slack or PagerDuty via DevOps Agent’s built-in integrations or via a sibling EventBridge rule on the same
aws.aidevopsevent stream.
The skills are plain English. Iterate on them the same way you’d iterate on a runbook.