AWS DevOps & Developer Productivity Blog
Monitoring and management with Amazon QuickSight and Athena in your CI/CD pipeline
One of the many ways to monitor and manage required CI/CD metrics is to use Amazon QuickSight to build customized visualizations. Additionally, by applying Lean management to software delivery processes, organizations can improve delivery of features faster, pivot when needed, respond to compliance and security changes, and take advantage of instant feedback to improve the customer delivery experience. This blog post demonstrates how AWS resources and tools can provide monitoring and information pertaining to their CI/CD pipelines.
There are three principles in Lean management that this artifact enables and to which it contributes:
- Limiting work in progress by establishing constraints that drive process improvement and increase throughput.
- Creating and maintaining dashboards displaying key quality information, productivity metrics, and current status of work (including defects).
- Using data from development performance and operations monitoring tools to enable business decisions more frequently.
Overview
The following architectural diagram shows how to use AWS services to collect metrics from a CI/CD pipeline and deliver insights through Amazon QuickSight dashboards.
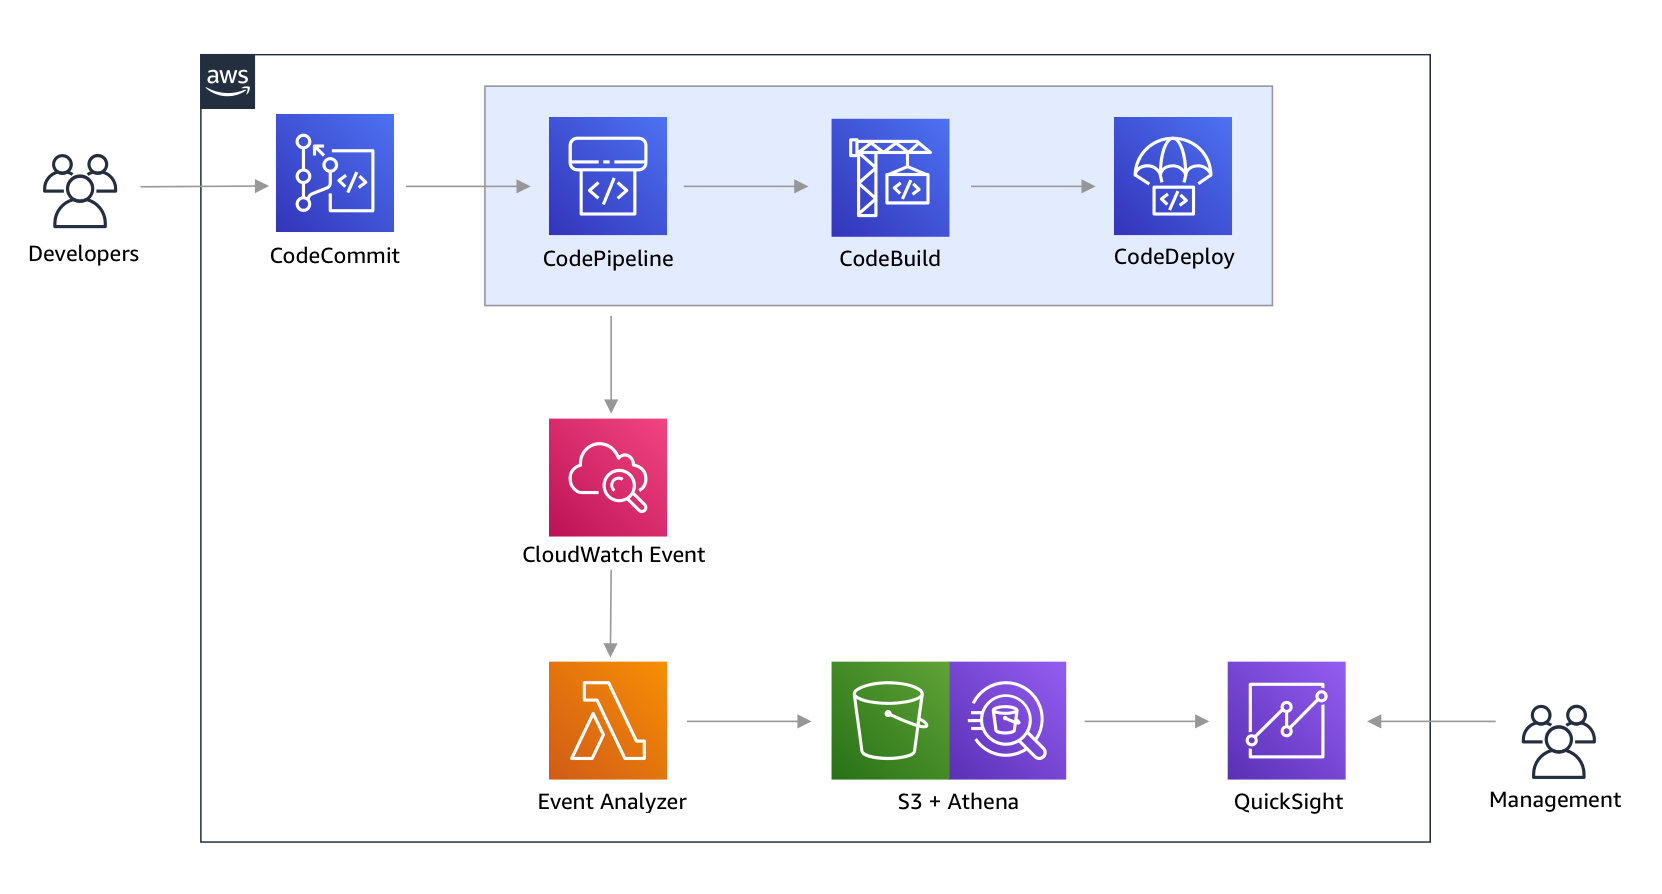
In this example, the orchestrator for the CI/CD pipeline is AWS CodePipeline with the entry point as an AWS CodeCommit Git repository for source control. When a developer pushes a code change into the CodeCommit repository, the change goes through a series of phases in CodePipeline. AWS CodeBuild is responsible for performing build actions and, upon successful completion of this phase, AWS CodeDeploy kicks off the actions to execute the deployment.
For each action in CodePipeline, the following series of events occurs:
- An Amazon CloudWatch rule creates a CloudWatch event containing the action’s metadata.
- The CloudWatch event triggers an AWS Lambda function.
- The Lambda function extracts relevant reporting data and writes it to a CSV file in an Amazon S3 bucket.
- Amazon Athena queries the Amazon S3 bucket and loads the query results into SPICE (an in-memory engine for Amazon QuickSight).
- Amazon QuickSight obtains data from SPICE to build dashboard displays for the management team.
Note: This solution is for an AWS account with an existing CodePipeline(s). If you do not have a CodePipeline, no metrics will be collected.
Getting started
To get started, follow these steps:
- Create a Lambda function and copy the following code snippet. Be sure to replace the bucket name with the one used to store your event data. This Lambda function takes the payload from a CloudWatch event and extracts the field’s pipeline, time, state, execution, stage, and action to transform into a CSV file.
Note: Athena’s performance can be improved by compressing, partitioning, or converting data into columnar formats such as Apache Parquet. In this use-case, the dataset size is negligible therefore, a transformation from CSV to Parquet is not required.
import boto3
import csv
import datetime
import os

 # Analyze payload from CloudWatch Event
 def pipeline_execution(data):
     print (data)
     # Specify data fields to deliver to S3
     row=['pipeline,time,state,execution,stage,action']

     if "stage" in data['detail'].keys():
         stage=data['detail']['execution']
     else:
         stage='NA'

     if "action" in data['detail'].keys():
         action=data['detail']['action']
     else:
         action='NA'
     row.append(data['detail']['pipeline']+','+data['time']+','+data['detail']['state']+','+data['detail']['execution']+','+stage+','+action)
     values = '\n'.join(str(v) for v in row)
     return values

 # Upload CSV file to S3 bucket
 def upload_data_to_s3(data):
     s3=boto3.client('s3')
     runDate = datetime.datetime.now().strftime("%Y-%m-%d_%H:%M:%S:%f")
     csv_key=runDate+'.csv'
     response = s3.put_object(
         Body=data,
         Bucket='*<example-bucket>*',
         Key=csv_key
     )

 def lambda_handler(event, context):
upload_data_to_s3(pipeline_execution(event))- Create an Athena table to query the data stored in the Amazon S3 bucket. Execute the following SQL in the Athena query console and provide the bucket name that will hold the data.
CREATE EXTERNAL TABLE `devops`(
   `pipeline` string,
   `time` string,
   `state` string,
   `execution` string,
   `stage` string,
   `action` string)
 ROW FORMAT DELIMITED
   FIELDS TERMINATED BY ','
 STORED AS INPUTFORMAT
   'org.apache.hadoop.mapred.TextInputFormat'
 OUTPUTFORMAT
   'org.apache.hadoop.hive.ql.io.HiveIgnoreKeyTextOutputFormat'
 LOCATION
   's3://**<example-bucket>**/'
 TBLPROPERTIES (
   'areColumnsQuoted'='false',
   'classification'='csv',
   'columnsOrdered'='true',
   'compressionType'='none',
   'delimiter'=',',
   'skip.header.line.count'='1',
'typeOfData'='file') - Create a CloudWatch event rule that passes events to the Lambda function created in Step 1. In the event rule configuration, set the Service Name as CodePipeline and, for Event Type, select All Events.
Sample Dataset view from Athena.

Amazon QuickSight visuals
After the initial setup is done, you are ready to create your QuickSight dashboard. Be sure to check that the Athena permissions are properly set before creating an analysis to be published as an Amazon QuickSight dashboard.
Below are diagrams and figures from Amazon QuickSight that can be generated using the event data queried from Athena. In this example, you can see how many executions happened in the account and how many were successful.
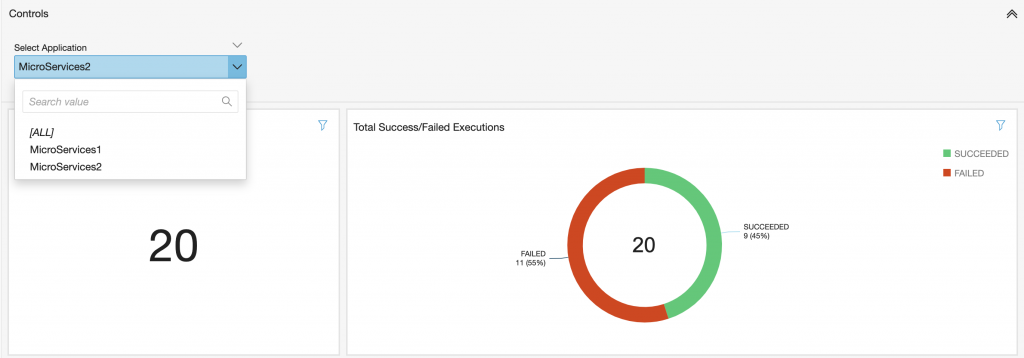
The following screenshot shows that most pipeline executions are failing. A manager might be concerned that this points to a significant issue and prompt an investigation in which they can allocate resources to improve delivery and efficiency.

The visual for this solution is dynamic in nature. In case the pipeline has more or fewer actions, the visual will adjust automatically to reflect all actions. After looking at the success and failure rates for each CodePipeline action in Amazon QuickSight, as shown in the following screenshot, users can take targeted actions quickly. For example, if the team sees a lot of failures due to vulnerability scanning, they can work on improving that problem area to drive value for future code releases.

Day-over-day visuals reflect date-specific activity and enable teams to see their progress over a period of time.

Amazon QuickSight offers controls that can be configured to apply filters to visuals. For example, the following screenshot demonstrates how users can toggle between visuals for different applications.
Cleanup (optional)
In order to avoid unintended charges, delete the following resources:
- Amazon CloudWatch event rule
- Lambda function
- Amazon S3 Bucket (the location in which CSV files generated by the Lambda function are stored)
- Athena external table
- Amazon QuickSight data sets
- Analysis and dashboard
Conclusion
In this blog, we showed how metrics can be derived from a CI/CD pipeline. Utilizing Amazon QuickSight to create visuals from these metrics allows teams to continuously deliver updates on the deployment process to management. The aggregation of the captured data over time allows individual developers and teams to improve their processes. That is the goal of creating a Lean DevOps process: to oversee the meta-delivery pipeline and optimize all future releases by identifying weak spots and points of risk during the entire release process.
___________________________________________________________
About the Authors
 |
Umair Nawaz is a DevOps Engineer at Amazon Web Services in New York City. He works on building secure architectures and advises enterprises on agile software delivery. He is motivated to solve problems strategically by utilizing modern technologies. |
 |
Christopher Flores is an Engagement Manager at Amazon Web Services in New York City. He leads AWS developers, partners, and client teams in using the customer engagement accelerator framework. Christopher expedites stakeholder alignment, enterprise cohesion and risk mitigation while ensuring feedback loops to close the engagement lifecycle. |
 |
Carol Liao is a Cloud Infrastructure Architect at Amazon Web Services in New York City. She enjoys designing and developing modern IT solutions in the cloud where there is always more to learn, more problems to solve, and more to build. |