Artificial Intelligence
Monitoring GPU Utilization with Amazon CloudWatch
Deep learning requires a large amount of matrix multiplications and vector operations that can be parallelized by GPUs (graphics processing units) because GPUs have thousands of cores. Amazon Web Services allows you to spin up P2 or P3 instances that are great for running Deep Learning frameworks such as MXNet, which emphasizes speeding up the deployment of large-scale deep neural networks.
As data scientists and developers fine-tune their network, they want to optimize their GPU utilization so that they are using appropriate batch sizes. In this blog post, I’ll show you how you can monitor your GPU and memory usage using Amazon CloudWatch metrics. For an Amazon Machine Image (AMI), we recommend that your instance uses the Amazon Deep Learning AMI.
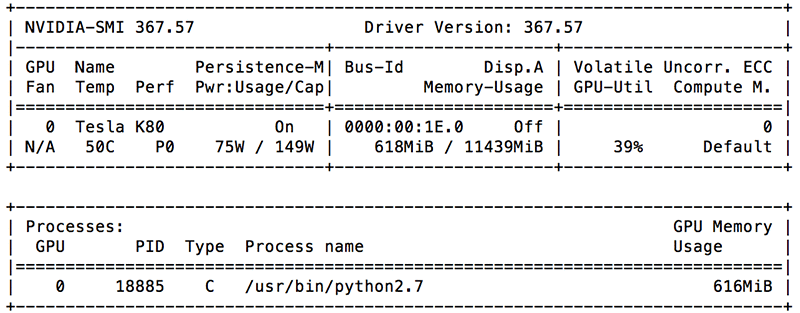
The current common practice to help with monitoring and management of GPU-enabled instances is to use NVIDIA System Management Interface (nvidia-smi), a command line utility. With nvidia-smi, users query information about the GPU utilization, memory consumption, fan usage, power consumption, and temperature of their NVIDIA GPU devices.

Because nvidia-smi is based on the NVIDIA Management Library (NVML), we can use this C-based API library to capture the same data points to send to Amazon CloudWatch as a custom metric. For more information on this library, go to the reference manual. For this post, we will use pyvnml, a Python wrapper for the library.
Amazon CloudWatch is great for monitoring your workload on your EC2 instances without needing to set up, manage, or scale the systems and infrastructure around it. By default, CloudWatch provides metrics such as CPUUtilization, DiskReadOps and DiskWriteOps, NetworkIn and NetworkOut, and so on. (Full list of metrics for your instances here)
Beyond these metrics, we have the ability to push our own data-points through the Amazon CloudWatch custom metrics using the API, SDK, or CLI. We will be using the Python Boto3 SDK.
Within Amazon CloudWatch, you can create custom dashboards to view your resources. You can also create alarms for your metrics. There are other features and services that you can use along with CloudWatch. You can use Amazon CloudWatch Logs if you want access and store the logs themselves from your Amazon EC2 instances. Additionally, Amazon CloudWatch Events enables you to get a stream of data describing changes within your AWS resources, such as getting an alert when someone tries to terminate your instance before you have finished training your model.
Setting it up
By default, your instance is enabled for basic monitoring. We will enable detailed monitoring so that the Amazon EC2 console displays monitoring with a 1-minute period for your instance.
Note: Although basic monitoring is free, there is a charge for detailed monitoring. New and existing customers receive 10 metrics, 10 alarms, and 1 million API requests (including PutMetricData) per month for free.
Given that your instance is already running on the Deep Learning AMI, we need to create an IAM role that grants your instance the permission to push metrics to Amazon CloudWatch. As described in the documentation, we need to create an EC2 service role. Make sure your role allows for the following policy.
Next, download the Python code onto your instance. Using the script, we will push GPU usage, memory usage, temperature, and power usage as custom CloudWatch metrics.
Install the necessary packages for the code:
For Ubuntu:
Make sure you change the namespace and interval to fit your workload. You also have the option to use high-resolution metrics down to 1 second by changing store_reso to give you sub-minute insight to your GPU usage.
By default, these are the parameters at the top:
Run the script:
For Ubuntu
Stop the script by pressing ctrl-z or ctrl-c after the training has been completed.
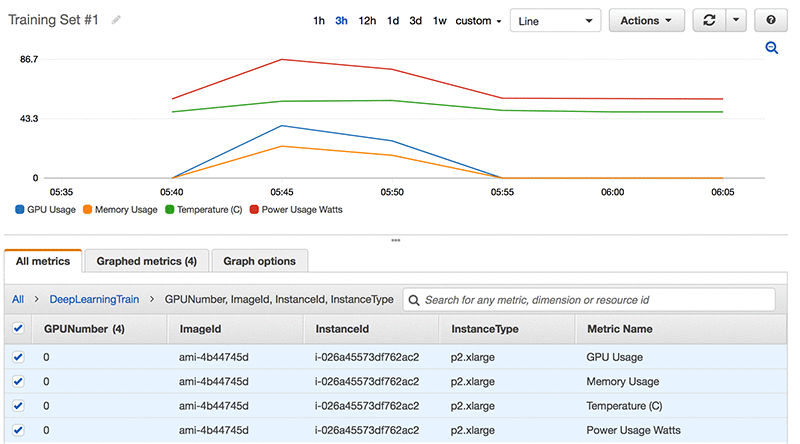
Here is an example Amazon CloudWatch view of a training run. Observe how all the metrics correlate to each other during computation.

Conclusion
In this blog post, I’ve provided a way to easily monitor not only your GPU utilization, but also the memory, temperature, and power usage of your NVIDIA GPU device. I have provided the code that you can modify if you want to add or remove different custom metrics. Next steps, try to create CloudWatch Alarms on your metrics as mentioned in the introduction. For example, you can set up an Amazon SNS notification to email you when the GPU utilization is lower than 20% for the duration of model training.
Additional Reading
Get started with Deep Learning using the AWS Deep Learning AMI!
About the Author
 Keji Xu is a Solutions Architect for AWS in San Francisco. He helps customers understand advanced cloud-based solutions and how to migrate existing workloads to the cloud to achieve their business goals. In his spare time, he enjoys playing music and cheering for his New England sports teams.
