AWS Cloud Operations Blog
Investigate security data in place with Amazon CloudWatch and 7AI
Security teams don’t struggle to get alerts. They struggle to get the context needed to act on them. Consider a common scenario: an AWS Security Hub finding reports a critical vulnerability in a container image in Amazon Elastic Container Registry. The finding says that a package is vulnerable, but not whether the image is running, which workloads use it, or whether anyone exploited it or can exploit it. Answering those questions takes deployment logs, workload inventory, and threat findings. If the team moved its raw logs out of the security information and event management (SIEM) tool to control cost, that evidence now sits in several places, and the investigation waits until someone collects it.
Because many SIEMs charge by ingested volume, teams often shorten retention, sample logs, or drop sources to control cost. Moving high-volume telemetry into a store the team controls lower the cost, but it creates a new problem; analysts and automated tools lose access to that data during an investigation, unless something queries it where it sits.
This post shows you how to send AWS and third-party security telemetry to Amazon CloudWatch, then let an AI-driven investigation tool, often can AI security operations center (AI SOC) platform, query it on demand whenever Amazon GuardDuty or AWS Security Hub reports a finding. The walkthrough uses 7AI as the example, but the AWS-side setup applies to any tool that can read findings and query CloudWatch Logs. With logs and findings centralized in a single Security Tooling account, one connection gives 7AI visibility across every account and Region in your organization.
Solution overview
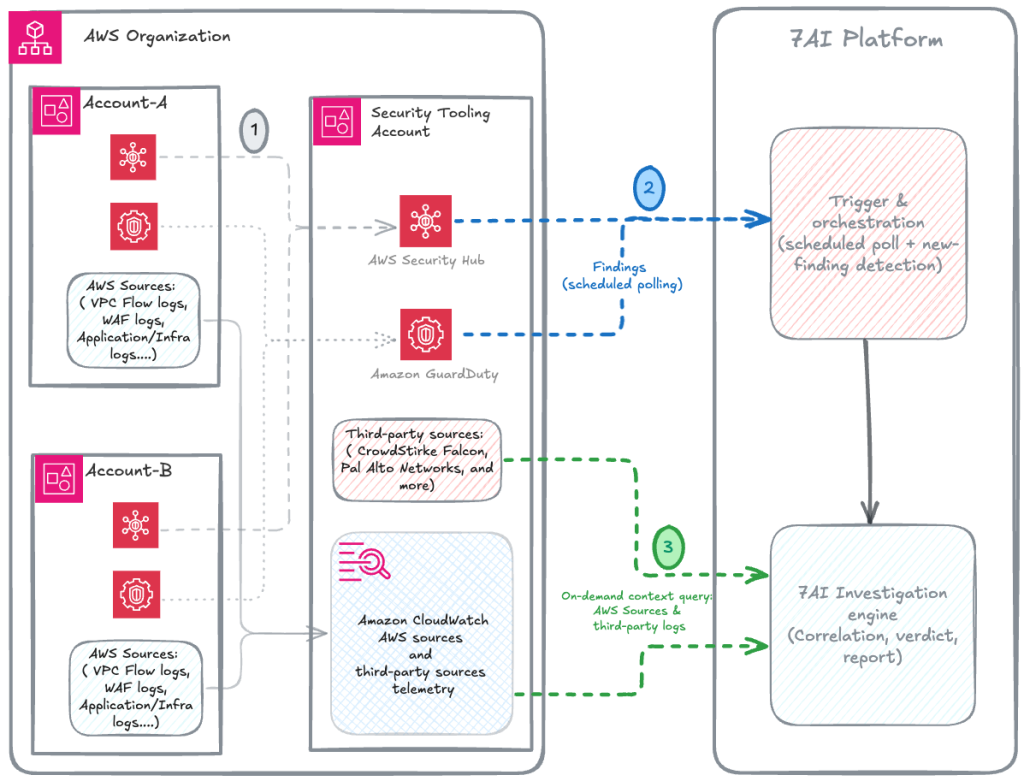
Figure-1: Architecture Overview
The solution separates where evidence is stored from where the investigation runs. Telemetry flows into CloudWatch once; findings tell the 7AI when to start an investigation, and 7AI pulls only the evidence it needs. Figure 1 shows the flow. Member accounts centralize their logs and findings to a Security Tooling account, so the 7AI needs access to only that one account.
The architecture has four parts:
- Telemetry sources: Telemetry enablement rules support 32 AWS sources, including AWS CloudTrail and Amazon Virtual Private Cloud (Amazon VPC) Flow Logs. CloudWatch also supports 49 third-party sources, including CrowdStrike Falcon and Palo Alto Networks next-generation firewall and more.
- CloudWatch centralization: Logs from multiple sources are sent to Security Tooling Account using Centralization rules. Refer to this blog for guidance on log centralization.
- GuardDuty and Security Hub: These services detect threats and vulnerabilities and generate the findings that start each investigation.
- 7AI platform: A trigger and orchestration component polls GuardDuty and Security Hub for findings at regular intervals and detects new ones. An investigation engine then correlates evidence, reaches a verdict, and writes a report.
Figure 1 shows three connections. The numbers in the following list match the callouts in the figure:
- Telemetry ingest (grey lines- dashed/solid). Telemetry enablement rules configure collection for AWS sources, and CloudWatch pipelines transform AWS sources.
- Findings (dashed blue lines). 7AI polls GuardDuty and Security Hub for new findings at a fixed interval and starts an investigation when it finds one.
- Context queries (green line). The investigation engine queries CloudWatch on demand, only when an investigation needs evidence.
Findings travel as pointers, and evidence stays in the store until an investigation asks for it. That design keeps one copy of each log, under your retention and access controls.
Prerequisites
You need the following:
- An AWS account with permissions to create CloudWatch telemetry enablement rules and pipelines, and to manage AWS Identity and Access Management (IAM) roles. To create rules at the organization or organizational unit (OU) scope, use the AWS Organizations management account or a CloudWatch delegated administrator account.
- AWS Organizations, with the member accounts and a Security Tooling account in the same organization, and trusted access turned on for CloudWatch.
- The Security Tooling account set up as the delegated administrator for GuardDuty and Security Hub, so findings from all member accounts and Regions are aggregated there.
- An existing VPC with at least one Amazon Elastic Compute Cloud (Amazon EC2) instance. Enablement rules configure collection for existing resources in scope without modifying those resources.
- For third-party data sources: prerequisites vary by vendor, typically either a staging path through AWS services such as a Amazon S3 bucket and a Amazon SQS queue (often requiring a vendor license or support to enable), or direct API access using an endpoint and credentials.
- A tenant on the 7AI platform, available through an AWS Marketplace subscription if needed.
- This walkthrough creates billable resources. See Considerations section below before you start, and Clean up when you finish.
Walkthrough
In this walkthrough, you configure Telemetry enablement rules, ingest third-party telemetry with pipelines, verify that the data arrives, and connect to the 7AI platform. Each part builds on the one before it.
Configure Telemetry enablement rules
Do not turn on logging separately in each service. A telemetry enablement rule configures log collection for resources matching its scope, both existing resources and any you create later, so coverage is consistent and automatic. Scope a rule to an organization, an OU, or a single account, and refine it with resource tags. Existing resources are handled with a few exceptions so that current workflows keep working. See the How rules work documentation for details.
Create one rule for each of the three AWS sources that matter to this investigation:
| Rule name | Data source | Why the investigation needs it |
| security-vpc-flow-logs | Amazon VPC Flow Logs | The network connections behind a finding |
| security-waf-logs | AWS WAF Logs | Probing of the web tier from the same address |
| security-cloudtrail-events | CloudTrail Data and Management Events | The API activity around the finding |
- Open the CloudWatch console. To create organization or OU rules, use the management account or the CloudWatch delegated administrator account.
- In the navigation pane, choose Ingestion.
- Choose the Enablement rules tab and then choose Add rule.
- Find the data source you are looking for and choose Configure telemetry.
- Configure the rule:
- Rule name: for example, security-vpc-flow-logs.
- Scope: Account, Organizational unit, or Organization. OU and Organization scopes apply the rule to every account within them and are available only from the management or delegated administrator account.
- Destination details: the log group name and the retention period.
- Data options: settings specific to the data source, such as which traffic to log for VPC Flow Logs or which event types to ingest for CloudTrail.
- (Optional) Add tags to limit the rule to a subset of resources, for example Environment: Production. Tag filters apply only to resource types that support tags. They don’t apply to CloudTrail, for example.
- Choose Create rule and repeat for the other two data sources.
Set the data options to match what your investigations need. For example, for the VPC Flow Logs rule, log all traffic, accepted and rejected. A rejected-only configuration is smaller, but it can’t show whether a connection from a suspicious address was accepted. An accepted connection shows only that an attempt reached the instance, not that a login succeeded, so investigations also rely on host and firewall evidence.
Enablement rules extend to many other AWS sources as well, such as Network Load Balancer access logs and Amazon Route 53 Resolver query logs, with 32 data sources supported in total.
Centralize logs into the Security Tooling account
Enablement rules create log groups in each member account. To give investigations one place to query, centralize those logs into the Security Tooling account with a CloudWatch Logs centralization rule.
- Open the CloudWatch console in the management account or the CloudWatch delegated administrator account.
- Choose Settings, choose the Organization tab, and then choose Configure rule.
- Enter a rule name, and choose the source accounts (specific accounts, OUs, or the entire organization) and the source Regions.
- For the destination account, choose the Security Tooling account.
- Set the destination log group name pattern to
/centralized/${source.accountId}/${source.region}${source.logGroup}, so that every record keeps its source account and Region. - Review the rule, and then create it.
Note: Centralization copies only log data that arrives after you create the rule. Existing logs stay in the source accounts until their retention period ends.
Create pipelines for AWS source and third-party telemetry
CloudWatch pipelines is a fully managed collector that ingests, transforms, and routes telemetry to CloudWatch Logs. In this solution, you use pipelines for two jobs:
- Normalize AWS sources to OCSF. Use a CloudWatch Logs source, such as the log groups that your enablement rules created, and add the parse-to-OCSF processor. CloudTrail, VPC Flow Logs, and AWS WAF events then share the same field names, so one query works across sources. Not every AWS source supports the OCSF processor. Application Load Balancer logs, for example, don’t.
- Ingest third-party telemetry. When using 3rd party data sources, CW pipelines use either S3 to stage artifacts for ingestion or configure direct API access See Third-party data sources integration for the prerequisites and settings for each source.
Create one pipeline for each source:
- Open the CloudWatch console.
- In the navigation pane, choose Ingestion, and then choose Pipelines.
- Choose Create pipeline.
- Under Getting started, Pipeline settings, choose the data source from the drop down and fill the remaining steps.
- Most of the data sources ask from Log source name, type, pipeline name, and Service access role which have permissions to access CloudWatch logs.
- Choose Next to access Configure processors – optional page and choose OCSF processor.
- For a CloudWatch vended log source, you can also turn on Keep original log to store a copy of each raw event in the
@original_messagefield before processors change it.
- For a CloudWatch vended log source, you can also turn on Keep original log to store a copy of each raw event in the
- Choose the Default destination and proceed to Review and create.
- Check the configuration and then choose Create pipeline. Creation takes up to 5 minutes, depending on the source type.
- Repeat for each source.
Important: CloudTrail records pipeline processor configurations for auditing. Do not put passwords, API keys, or other secrets in a processor configuration.
Validating Log Ingestion
Before you connect the 7AI platform, confirm that each rule and pipeline delivers data to its log group. A log group receives events only after its data source produces activity, and a new rule’s first resource discovery can take up to 24 hours, so allow time before you troubleshoot.
- In the CloudWatch console, open Logs, Log Management, Log groups and find the groups that your rules and pipelines created.
- Open each group and confirm that recent events are present.
- In the CloudWatch console, choose Logs Analytics.
- Select the VPC flow log group and a time range of the last hour.
- Enter the following query and then choose Run query.
The result lists the source addresses that connected to port 22, with a count for accepted and rejected connections. If the result is empty, check that traffic reached the VPC and that the rule is active. If you customized the flow log format in the rule, adjust the field names to match.
Connect the 7AI platform
7AI is an agentic security operations platform, available in AWS Marketplace, whose AI agents investigate security alerts end to end. To investigate in place with CloudWatch, 7AI needs read-only access to your findings and to the log groups that hold your evidence. You set this up through two connectors, using the documentation and AWS CloudFormation templates provided in your 7AI console.
If your logs and findings are centralized, you only need to onboard the Security Tooling account. If they’re spread across multiple accounts, onboard each of those accounts:
- Login to 7AI console
- Choose Configuration, Connector Directory and search for “AWS”.
- Select the AWS CloudWatch connector and follow the steps to configure it. This connector adds steps to configure an IAM role and exchange authentication details.
- Repeat for the AWS connector. Note that its configuration steps differ.
Example: from an AWS Security Hub finding to a verdict
This example shows why context matters more than the alert itself. Vulnerability findings are among the most common items in a security queue, and they rarely say whether the risk is real. Here, the investigation answers that question by correlating the finding with workload logs in CloudWatch, the account’s function inventory, and SecurityHub findings. The investigation ran in a test AWS account connected to 7AI, and some identifiers are masked.
Amazon Inspector reported CVE-2026-27171, a vulnerability in the zlib library, in the container image voltverse/payment:b2 in Amazon ECR. Inspector sends its findings to Security Hub, which aggregates them with findings from GuardDuty and other services. A vulnerability finding says that a package is vulnerable. It does not say whether the image is running, or whether anyone exploited it.
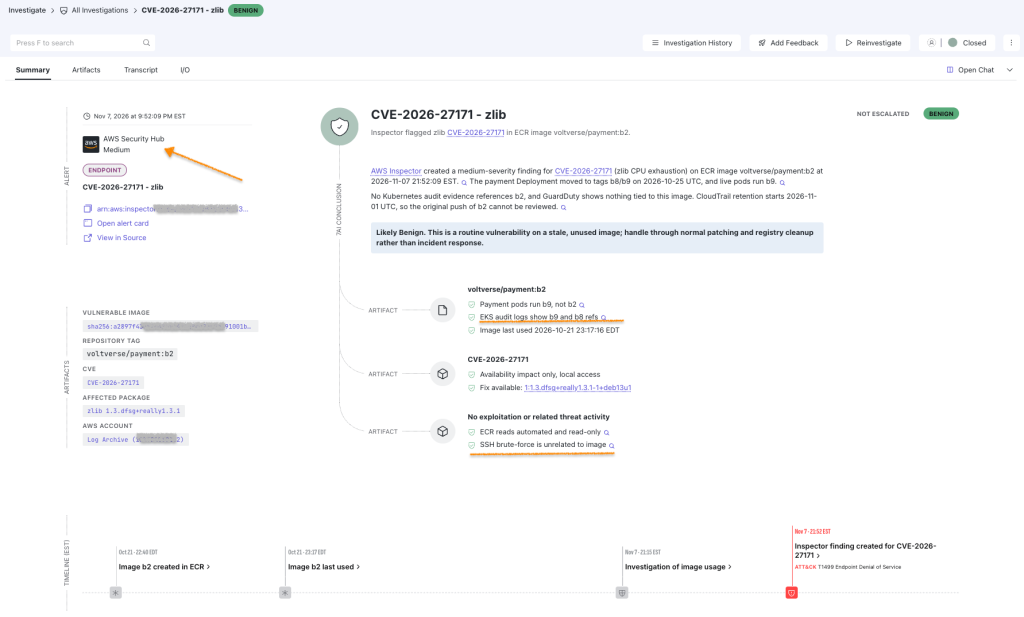
Figure 2. The 7AI Investigation report
The trigger component detected the new Security Hub finding at its next poll. The investigation engine the queried CloudWatch logs to get CloudTrail events and Application logs it needed to build the context around the finding.
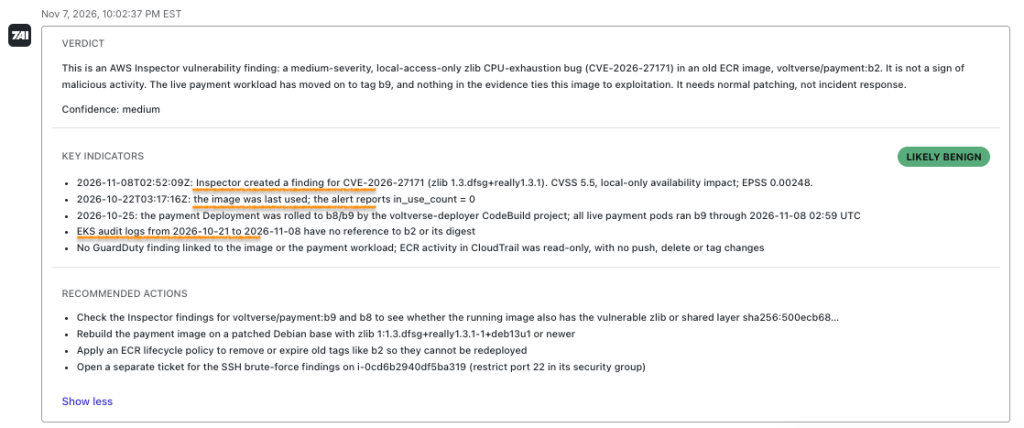
Figure 3: The 7AI investigation Verdict
- It read the finding’s raw fields. The image had an in-use count of 0 and was last used on 2026-10-22, more than two weeks before the finding (as show in Figure 3).
- It queried the Amazon Elastic Kubernetes Service (Amazon EKS) logs in CloudWatch for 2026-10-25 to 2026-10-29. Payment pods ran image tags b8 and b9 only. Tag b2 did not appear.
- It checked GuardDuty for container, ECR, or zlib findings and found none. The CVE’s Exploit Prediction Scoring System (EPSS) score was 0.00592.
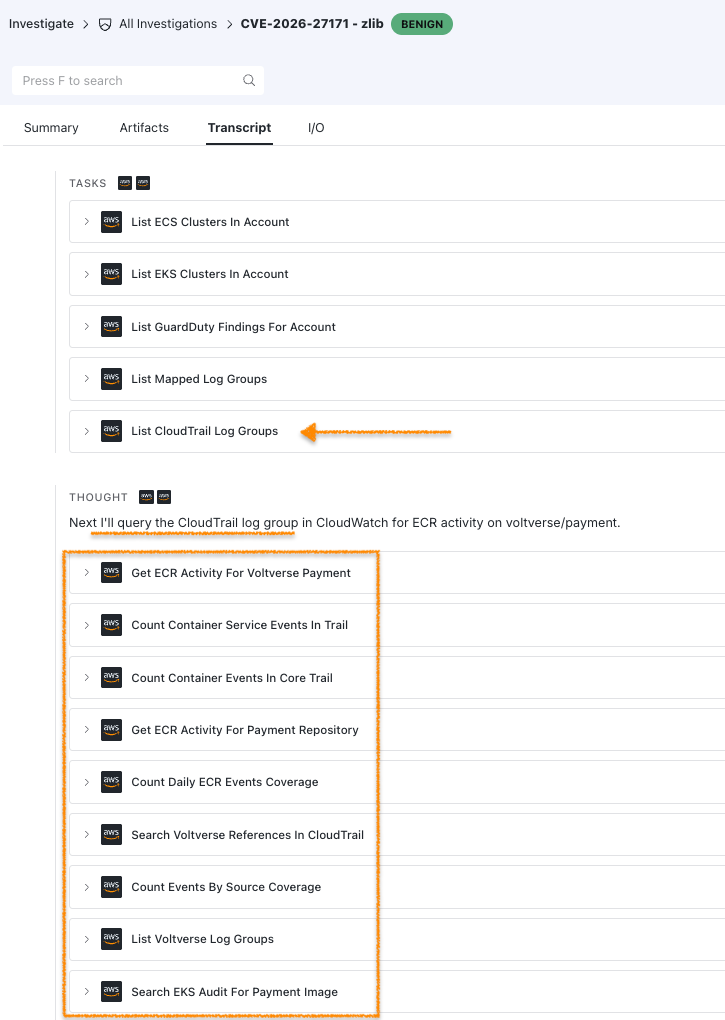
Figure 4: The investigation transcript
The engine correlated the results and returned a verdict of likely benign, with medium confidence: nothing suggests that the old image is running or was exploited, so the finding is a vulnerability-management item, not an incident. Figure4 shows the report.
The report also corrected an earlier step that had labeled the finding a false positive. The raw fields showed the installed build (1:1.3.dfsg+really1.3.1-1) is older than the fixed build (1:1.3.dfsg+really1.3.1-1+deb13u1), so the report confirmed the vulnerability as real and recommended normal patching: rebuild the image with the fixed zlib, check tags b8 and b9 first since those are the deployed images, expire stale tags with an Amazon ECR lifecycle policy, and use kubectl or the Amazon EKS API to confirm no running workload uses the old image digest. It also surfaced with an unrelated SSH brute-force finding against an EC2 instance with port 22 open to the internet, and recommended tracking that in a separate ticket.
The difference from a finding-only workflow is the context. From the finding alone, an analyst sees a vulnerable package. With deployment logs, the function of inventory, and threat findings in reach, the investigation can say whether the image is running, which images to patch first, and what to do next.
The Transcript tab shows the complete list of tasks the investigation performed.
You can further investigate details of connectors used for a given investigation and number of queries executed per each investigation from the I/O section of the investigation panel in 7AI.
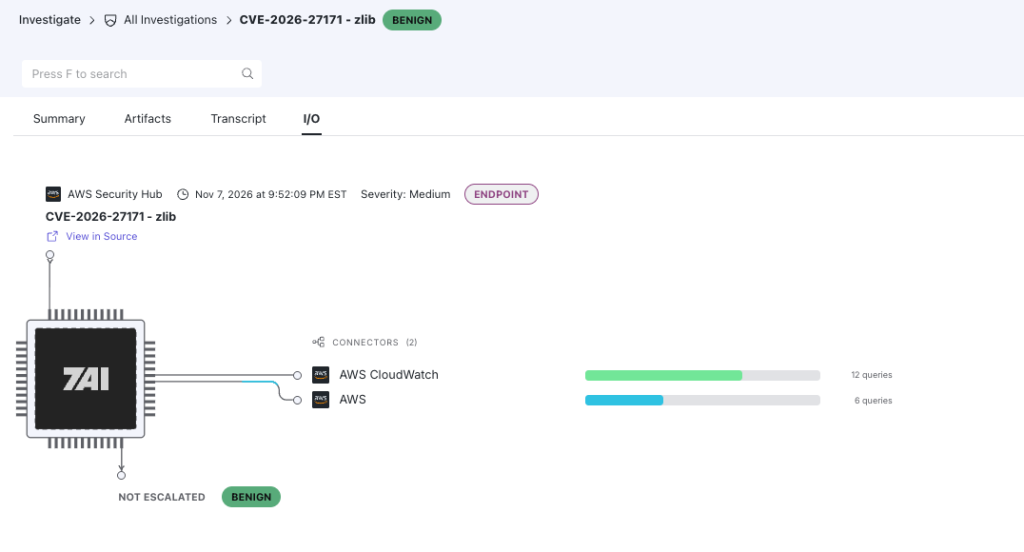
Figure 5: AWS Connectors used for an investigation.
Each piece of context came from data that stays in CloudWatch and in your account: deployment history from the Amazon EKS logs, the function inventory, and threat findings from GuardDuty. 7AI queried those sources only when the investigation needed them, so a vulnerability finding became a prioritized patching decision without anyone collecting logs by hand.
Considerations
Cost. The resources in this walkthrough generate charges: CloudWatch Logs ingestion and storage, the data that your enablement rules and pipelines collect. Set a retention period on every log group, and review Amazon CloudWatch pricing for your volumes.
Centralization. Centralization rules copy only new log data, so existing logs stay in the source accounts. If source or destination log groups use customer managed AWS KMS keys, tag the destination key with LogsManaged = true, or set the rule not to centralize log groups encrypted with customer managed keys.
Original records. Pipeline processors change log events. For CloudWatch vended log sources, turn on Keep original log to keep each raw event in the @original_message field. CloudWatch doesn’t retain the original record for third-party sources, so keep the vendor’s copy, for example in its S3 staging bucket under a lifecycle policy that matches your retention requirements.
Trigger latency. The trigger path polls on a schedule, so the time to the first investigation step depends on the polling interval.
Beyond finding-driven investigation. 7AI also describes detection rules that run against connected sources, and plain-language search across them. See the 7AI Federated SIEM page. This post covers the finding-driven path only.
Clean up
To stop charges, remove the resources in this order. Stop the data sources first, and delete the log groups last.
- In the 7AI platform, remove the integration for the account.
- Delete the SevenAI-AWS-Role CloudFormation stack that the 7AI connector setup deployed. In the CloudFormation console, select the stack and choose Delete, or run the following command:
- Delete the IAM policy and role you created for the 7AI platform outside the stack above
- In the CloudWatch console, delete the enablement rules that you created for this blog, from the Enablement rules tab
- In the CloudWatch console, delete the pipelines that you created, from the Pipelines page.
- Delete the log groups that the rules and pipelines created.
Deleting a log group removes its stored data. If you need to keep the records for audit or legal reasons, export them first or keep the log groups and their retention settings.
Conclusion
Moving security logs out of a SIEM saves cost only if the team can still investigate them. In this post, you used enablement rules and pipelines to send AWS and third-party telemetry to CloudWatch, used GuardDuty and Security Hub findings as triggers, and gave the 7AI platform read-only, on-demand access to the evidence. Findings carry the signal, the store holds the logs under your retention policy, and the investigation reads only what it needs.
As a next step, pick one finding type that your team triages by hand today, such as UnauthorizedAccess:EC2/SSHBruteForce. List the log sources an analyst opens for it and bring those sources into CloudWatch with a rule or a pipeline. Then compare the time to a verdict with and without the evidence in one place.
To learn more, read the documentation on telemetry enablement rules, creating pipelines, and third-party data source integration. Also read the Amazon CloudWatch Omni announcement to learn about Observability for the AI Era and see the Monitoring and Observability sessions at AWS re:Invent 2026.