AWS Big Data Blog
A public data lake for analysis of COVID-19 data
April 2024: This post was reviewed for accuracy.
As the COVID-19 pandemic continues to threaten and take lives around the world, we must work together across organizations and scientific disciplines to fight this disease. Innumerable healthcare workers, medical researchers, scientists, and public health officials are already on the front lines caring for patients, searching for therapies, educating the public, and helping to set policy. At AWS, we believe that one way we can help is to provide these experts with the data and tools needed to better understand, track, plan for, and eventually contain and neutralize the virus that causes COVID-19.
Today, we are making a public AWS COVID-19 data lake available – a centralized repository of up-to-date and curated datasets on or related to the spread and characteristics of the novel corona virus (SARS-CoV-2) and its associated illness, COVID-19. Globally, there are several efforts underway to gather this data, and we are working with partners to make this crucial data freely available and keep it up-to-date. Hosted on the AWS cloud, we have seeded our curated data lake with COVID-19 case tracking data from Johns Hopkins and The New York Times, hospital bed availability from Definitive Healthcare, and over 45,000 research articles about COVID-19 and related coronaviruses from the Allen Institute for AI. We will regularly add to this data lake as other reliable sources make their data publicly available.
The breakthroughs that can win the battle against this disease arrive faster when it’s easy for everyone to access and experiment with this vital information. The AWS COVID-19 data lake allows experimenters to quickly run analyses on the data in place without wasting time extracting and wrangling data from all the available data sources. They can use AWS or third-party tools to perform trend analysis, do keyword search, perform question/answer analysis, build and run machine learning models, or run custom analyses to meet their specific needs. Since every stakeholder in this battle brings their own perspective, users can choose to work with the public data lake, combine it with their own data, or subscribe to the source datasets directly through AWS Data Exchange.
We imagine local health authorities could build dashboards to track infections and collaborate to efficiently deploy vital resources like hospital beds and ventilators. Or epidemiologists could complement their own models and datasets to generate better forecasts of hotspots and trends.
For example, at Chan Zuckerberg Biohub, a nonprofit where leaders in science and technology collaborate to cure, prevent, or manage disease, scientists are using the AWS COVID-19 data lake for new epidemiological insights. “Our team of researchers is now analyzing trends in disease spread, its geography, and time evolution by leveraging datasets from the AWS COVID-19 data lake, combined with our own data, in order to better predict COVID epidemiology,” said Jim Karkanias, Vice President of Data Science and Information Technology at Chan Zuckerberg Biohub.
This post walks you through examples of how to use the AWS COVID-19 data lake for analysis. This data lake is comprised of data in a publicly readable Amazon S3 bucket (s3://covid19-lake). The post shows how to set up the definitions for that data in an AWS Glue Data Catalog to expose it to analytics engines. You can then query the AWS COVID-19 data lake with Amazon Athena, a serverless SQL query engine.
Prerequisites
This post assumes you have the following:
- Access to an AWS account
- Permissions to create an AWS CloudFormation stack
- Permissions to create AWS Glue resources (catalog databases and tables)
Configuring access to the data using a CloudFormation template
To make the data from the AWS COVID-19 data lake available in the Data Catalog in your AWS account, create a CloudFormation stack using the following template. If you are signed in to your AWS account, the following link fills out most of the stack creation form for you. All you need to do is choose Create stack. For instructions on creating a CloudFormation stack, see Get Started in the Cloud Formation documentation.
This template creates a covid-19 database in your Data Catalog and tables that point to the public AWS COVID-19 data lake. You do not need to host the data in your account, and you can rely on AWS to refresh the data as datasets are updated through AWS Data Exchange.
Exploring the data through the Data Catalog in your AWS account
When the CloudFormation stack shows a status of CREATE_COMPLETE, access the Glue Data Catalog to see the tables that the template created. You should see the following tables:
- Global Coronavirus (COVID-19) Data – Tracks confirmed COVID-19 cases in provinces, states, and countries across the world with a breakdown to the county level in the US.
| Table Name | Description | Source | Provider |
enigma_jhu |
Confirmed COVID-19 cases | Johns Hopkins | Enigma |
- Coronavirus (COVID-19) Data in the United States – Tracks confirmed cases and deaths in the US by state and county.
| Table Name | Description | Source | Provider |
nytimes_states |
Data on COVID-19 cases at US state level | NY Times | Rearc |
nytimes_counties |
Data on COVID-19 cases at US county level |
- Coronavirus Disease (COVID-19) Testing Data – Tracks the number of people tested, pending tests, and positive and negative tests for COVID-19.
| Table Name | Description | Source | Provider |
covid_testing_states_daily |
USA total test daily trend by state | COVID Tracking Project | Rearc |
covid_testing_us_daily |
USA total test daily trend | ||
covid_testing_us_total |
USA total tests |
- USA Hospital Beds – COVID-19 – Data on hospital beds and their utilization in the US.
| Table Name | Description | Source | Provider |
hospital_beds |
Hospital beds and their utilization in the US | Definitive Healthcare | Rearc |
- COVID-19 Open Research Dataset (CORD-19) – A collection of over 45,000 research articles (over 33,000 with full text) about COVID-19, SARS-CoV-2, and related coronaviruses. AWS has preprocessed and enriched these with annotations extracted from Amazon Comprehend Medical.
| Table Name | Description | Source/Provider |
alleninstitute_metadata |
Metadata on papers pulled from the CORD-19 dataset. The sha column indicates the paper ID, which is the file name of the paper in the data lake. | Allen Institute for AI |
alleninstitute_comprehend_medical |
Results from Amazon Comprehend Medical run against the CORD-19 dataset. |
- Lookup tables to support visualizations.
| Table Name | Description |
country_codes |
Lookup table for country codes |
county_populations |
Lookup table for the population for each county based on recent census data |
us_state_abbreviations |
Lookup table for US state abbreviations |
In addition, you can see descriptions of the columns in these tables. For example, the following screenshot shows the metadata of the table containing COVID-19 cases from Johns Hopkins.
Querying data via Amazon Athena
This section demonstrates how to query these tables using Athena. Athena is a serverless interactive query service that makes it easy to analyze the data in the AWS COVID19 data lake. Athena supports SQL, a common language that data analysts use for analyzing structured data. To query the data, complete the following steps:
- Sign in to the Athena console.
If this is the first time you are using Athena, you must specify a query result location on Amazon S3.
- From the drop-down menu, choose the
covid-19database. - Enter your query.
The following query returns the growth of confirmed cases for the past 7 days joined side-by-side with hospital bed availability, broken down by US county:
The following screenshot shows the results of this query.

Athena also allows you to run these queries through REST APIs, for example, for building your own visualizations. Moreover, Athena is just one of the many engines that you can use on the data lake. For example, you can use Amazon Redshift Spectrum to join lake data with other datasets in your Redshift data warehouse, or use Amazon QuickSight to visualize your datasets.
We have also created a public Amazon QuickSight dashboard from the COVID-19 case tracking data, testing data, and hospital bed data. You can track daily updates with this dashboard. You can also drill-down to see breakdowns by country, province, and county without having to write a line of SQL. The following is a recent screenshot of the dashboard.

CORD-19 research articles
The CORD-19 dataset is a collection of metadata and full-text of research articles about COVID-19, SARS-CoV-2, and related coronaviruses. You can index this data with Amazon Kendra for question/answer exploration, or enrich the data with Amazon Comprehend Medical. We have already done the latter and put it in the table called alleninstitute_comprehend_medical.
The alleninsitute_metadata table provides detailed fields for each paper, such as the title, authors, journal, and URL. The alleninstitute_comprehend_medical table contains key medical concepts such as medical condition, medication, dosage, strength, and frequency. With this metadata, you can quickly query over concepts, analyze or aggregate over authors and journals, and locate papers.
Aggregating over journals
Using IL-6 inhibitors is a possible therapy for COVID-19, and clinical trials are underway. To demonstrate how to use these tables, this post presents a use case in which you want to understand which journals discuss IL-6 the most by counting the papers they published. You can do this by running the following query:
The following screenshot shows an example of the results. The data provider updates this dataset over time, so your results may look different (here, we notice that the second highest count has no journal information).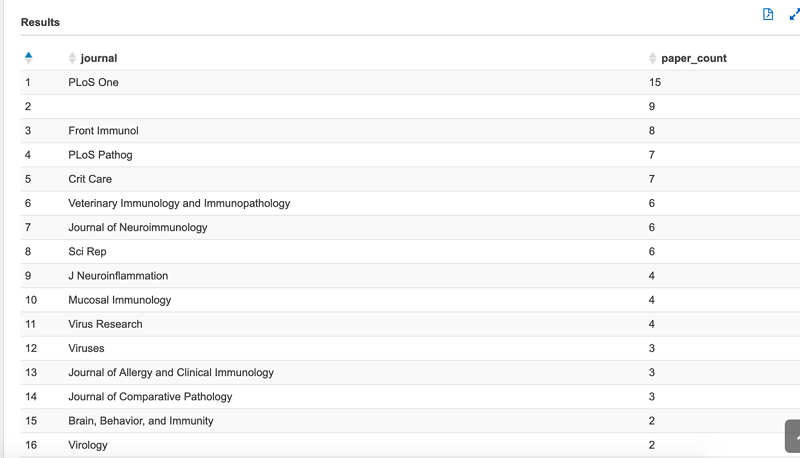
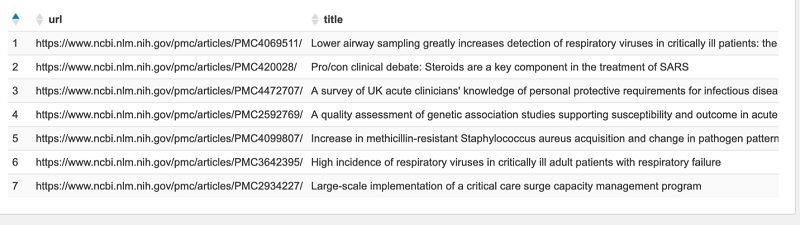
Drilling down into papers
To see the URLs and the titles of the papers in one of these journals, you simply query both these tables again. For example, to drill into IL-6 related papers in the Crit Care journal, enter the following query:
The following screenshot shows an example of the results.
 These examples are a few of the innumerable analyses you can run on the public data lake. You incur no additional cost for accessing the AWS COVID-19 data lake beyond the standard charges for the AWS services that you use. For example, if you use Athena, you will incur the costs for running queries and the data storage in the S3 query result location, but incur no costs for accessing the data lake. In addition, if you want this data in raw form, you can subscribe to, download, and stay up-to-date through AWS Data Exchange. We encourage you to try using the public AWS COVID-19 data lake yourself.
Conclusion
Combining our efforts across organizations and scientific disciplines can help us win the fight against the COVID-19 pandemic. With the AWS COVID-19 data lake, anyone can experiment with and analyze curated data related to the disease, as well as share their own data and results. We believe that through an open and collaborative effort that combines data, technology, and science, we can inspire insights and foster breakthroughs necessary to contain, curtail, and ultimately cure COVID-19.
To learn more, visit aws.amazon.com/covid-19-data-lake/. For daily updates on how AWS is addressing the crisis, see Amazon’s COVID-19 blog.
About the Authors
The AWS Data Lake Team members are Roy Ben-Alta, Jason Berkowitz, Chris Casey, Patrick Combes, Lucy Friedmann, Fred Lee, Megan Maxwell, Rourke McNamara, Herain Oberoi, Stephen Orban, Brian Ross, Nikki Rouda, Noah Schwartz, Noritaka Sekiyama, Mehul A. Shah, Ben Snively, and Ying Wang.
Audit History
Last reviewed and updated in April 2024 by Priyanka Chaudhary | Sr. Solutions Architect