AWS Partner Network (APN) Blog
How to Proactively Monitor Amazon RDS Performance with Datadog
By Emily Chang, Technical Content Editor at Datadog
By Yaniv Bossem, Partner Solutions Architect at AWS
 |
 |
Amazon Relational Database Service (Amazon RDS) automates time-consuming administration tasks such as hardware provisioning, database setup, patching, and backups. It lets you scale your database with only a few mouse clicks or an API call, often with no downtime.
However, when managing data at great scale, it can be challenging to pinpoint errors in your Amazon RDS environment and their root causes. At scale, it’s also important to take proactive measures to identify and remediate potential errors to avoid interrupting production workloads.
To take those proactive measures, you need deep visibility into your entire Amazon RDS environment. Datadog, a monitoring service for cloud-scale applications, can do that. Datadog is an AWS Partner Network (APN) Advanced Technology Partner with AWS Competencies in DevOps, Containers, Microsoft Workloads, and Migration.
Datadog recently attained the Amazon RDS Service Ready designation. That means you can rely on Datadog to find products and solutions that integrate with Amazon RDS database engines, including Amazon Aurora, PostgreSQL, MySQL, MariaDB, Oracle Database, and SQL Server.
In this post, we explain how to shift from reactive to proactive monitoring of your Amazon RDS environment. We show you how Datadog can fetch data from Amazon CloudWatch and your Amazon RDS database instances to give you a comprehensive view of your cloud environment.
We also dive into how you can automatically detect performance anomalies, abnormal throughput behavior, and forecasting storage capacities.
Four Ways to Integrate Amazon RDS with Datadog
You can integrate Amazon RDS with Datadog in four different ways, depending on the type of data you’re trying to collect:
- Amazon RDS metrics
- Amazon RDS logs
- Enhanced Amazon RDS monitoring metrics
- Native Amazon RDS metrics
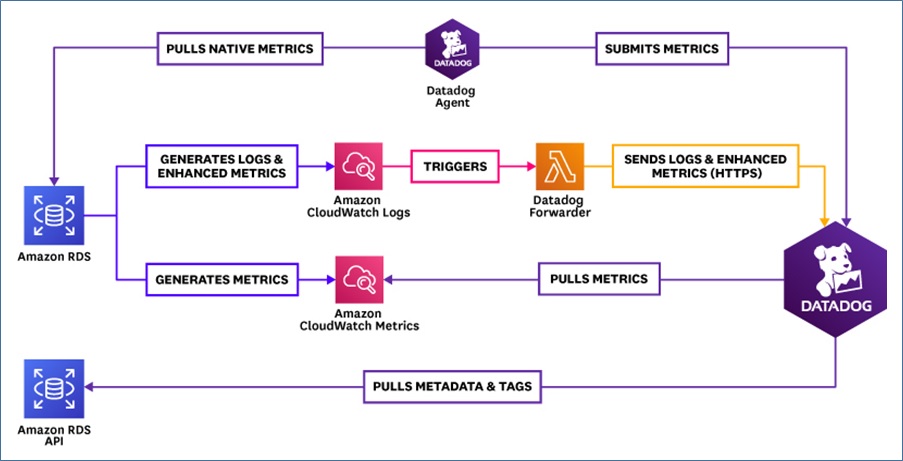
Figure 1 – Four ways to integrate Datadog with Amazon RDS.
Choose the integrations that suit your needs. For instance, to collect Amazon RDS metrics, integrate with Amazon CloudWatch. To visualize and analyze database logs, integrate with AWS Lambda functions.
Once Datadog is aggregating all of your Amazon RDS metrics and logs, you can start visualizing your environment with out-of-the-box dashboards—and use all of this data to pinpoint the root cause of performance issues and errors.

Figure 2 – Datadog’s dashboard displays an overview of your Amazon RDS environment.
Each of these integrations is described following. If you have already integrated Amazon RDS with Datadog, skip ahead to troubleshooting performance issues.
To Collect Amazon RDS Metrics
Integrate with Amazon CloudWatch to collect metrics from all of your AWS services and use Datadog to visualize, analyze, and set alerts. Datadog collects tags from AWS and enriches your Amazon RDS metrics with metadata, including dbinstanceclass, engine, dbname, and any custom tags you’ve added to your resources.
This integration also collects events such as backups from the Amazon CloudWatch API.
- Follow these instructions in the Datadog documentation.
To Collect Amazon RDS Logs
If you’re publishing database logs to Amazon CloudWatch Logs, you can use Datadog’s Lambda forwarder to automatically forward those logs to Datadog. That way, you can monitor and correlate them with all of the metrics and events you’re collecting from Amazon RDS (through the CloudWatch integration) and any other services running in your environment.
- Follow these instructions in the Datadog documentation.
To Collect Enhanced Amazon RDS Monitoring Metrics
Enhanced monitoring metrics provide detailed visibility into your database instances’ workloads, and are higher resolution than standard Amazon RDS metrics. With our Enhanced RDS metrics integration, you can forward those metrics directly to Datadog to get more context around the other Amazon RDS metrics, events, and logs you’re already collecting.
- Follow these instructions in the Datadog documentation.
To Collect Native Amazon RDS Database Metrics
Datadog’s native Amazon RDS database integration helps you directly query your database instances for metrics that are not available through Amazon CloudWatch. Whether you’re running MySQL, PostgreSQL, or SQL Server engine, you can configure the Datadog Agent to query metrics directly from your instances.
- Follow these instructions in the Datadog documentation.
How to Troubleshoot Performance Issues
This section walks through troubleshooting slow performance on an Amazon RDS database. Although this example focuses specifically on PostgreSQL, the general investigation flow should be similar regardless of which database engine you’re running.
Database logs provide rich insights into query performance issues and errors. Datadog automatically parses key attributes from your database logs so you can track errors, performance trends such as query execution time, and more.
Use log analytics to track trends in database query performance or throughput, broken down by database, availability zone, or any combination of tags. For example, the log data visualized in Figure 3 indicates that query latency has increased recently on a specific PostgreSQL database instance.

Figure 3 – Query latency has increased on a particular PostgreSQL database instance.
To investigate if this performance problem is correlated with any resource bottlenecks, you can pivot to view metrics collected from this instance.
In the visualization presented in Figure 4, it looks like the majority of updates have occurred on the employees table. It also appears these updates were not heap-only tuple (HOT) updates, meaning they were slower and more IO-intensive.

Figure 4 – Pivot to view metrics collected from this database instance.
The ratio of tuples updated to heap-only tuples updated has increased, and correlates with a spike in the Amazon RDS metric DiskQueueDepth. That is an indication this database instance cannot keep up with its IO load.
DiskQueueDepth measures the number of queued IO operations. Because it increased for this instance, it indicates the database instance could not keep up with the number of read/write operations. When this occurs over a sustained period of time, it can lead to slow query performance.
To resolve this issue, you could either revise your queries to be less IO-intensive by, for example, avoiding updating indexed columns wherever possible. Or, you can upgrade your database instances to Provisioned IOPS to better handle the load.
This is just one example of how you could use real-time monitoring data to investigate the root cause of an Amazon RDS performance issue. As part of a more comprehensive monitoring strategy, you can proactively monitor your databases to get ahead of performance degradations and errors before they affect your user experience.
How to Proactively Monitor Amazon RDS Performance
In highly dynamic environments, it can be challenging to distinguish between normal and abnormal fluctuations in performance and throughput. Datadog’s machine learning-powered features can help you continuously analyze your database’s health and performance in real-time—and notify you about problematic trends before they snowball into larger issues.
In this section, we cover examples showing how you to shift from reactive to proactive Amazon RDS monitoring by:
- Auto-detecting performance anomalies in your infrastructure.
- Using forecasts to avoid running out of storage.
- Getting notified of abnormal changes in throughput or performance.
Auto-Detecting Performance Anomalies in Infrastructure
Watchdog for Infra detects anomalies in the health and performance of infrastructure technologies like PostgreSQL without any setup. This means you can automatically be notified of issues that are of interest to you—such as the increase in the ratio of PostgreSQL updates to heap-only tuple updates that we described previously.
Watchdog for Infra reports the scope of the issue (such as the relevant table or database), and recommends follow-up actions.
In the following example, Watchdog for Infra detected an increase in the ratio of PostgreSQL updates to heap-only tuple updates on a specific table, which indicates the database is running more IO-intensive queries.
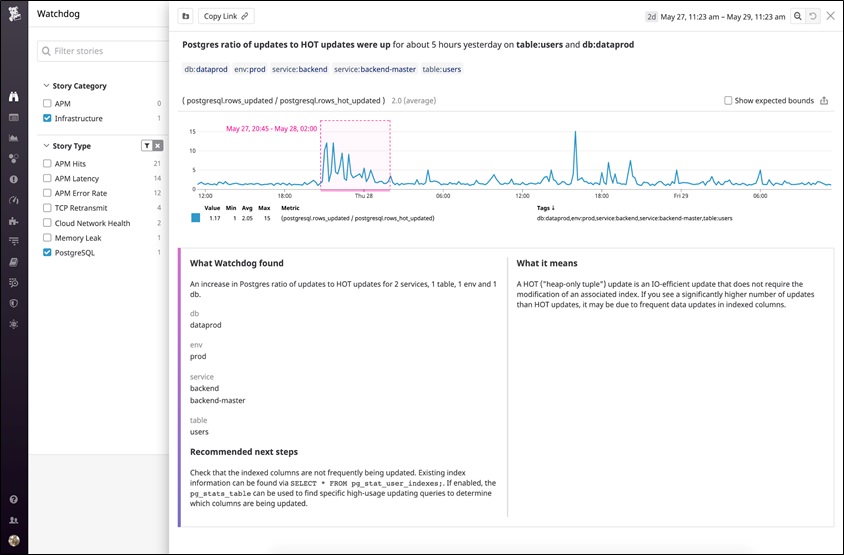
Figure 5 – Example of Watchdog for Infra detection.
Using Forecasts to Avoid Running out of Storage
As you scale your Amazon RDS databases, you need to keep an eye on the amount of storage available on each of your instances. If you are using Storage Auto Scaling, AWS can help automatically scale this resource for you.
Datadog forecast monitors can also help you manage your storage by notifying you before a shortage is predicted to occur. You can configure how far ahead of time to be notified.

Figure 6 – Example of Datadog metric forecast.
Datadog’s metric forecasts can help predict when your Amazon RDS instances are likely to run out of storage, based on real-time usage patterns. This ensures you will have enough time to either free up resources or scale up the amount of storage—before any of your database instances hit “storage-full” status and become unavailable.
Getting Notified of Abnormal Changes
Amazon RDS workloads vary widely according to your use case. This means traditional threshold-based monitors cannot accurately capture issues, such as the typical traffic for a Thursday afternoon not being normal for a Sunday morning.
Datadog’s anomaly detection uses field-tested algorithms to analyze the predicted range for a metric, and automatically alerts you about any abnormal deviations. It continuously analyzes the predicted range for a metric, based on historical data.
In the following graph, the gray bands indicate the expected range of values for this metric, while the orange area highlights the abnormal dip that extended outside that normal range. The graph shows that Datadog detected an unusual dip in write throughput.
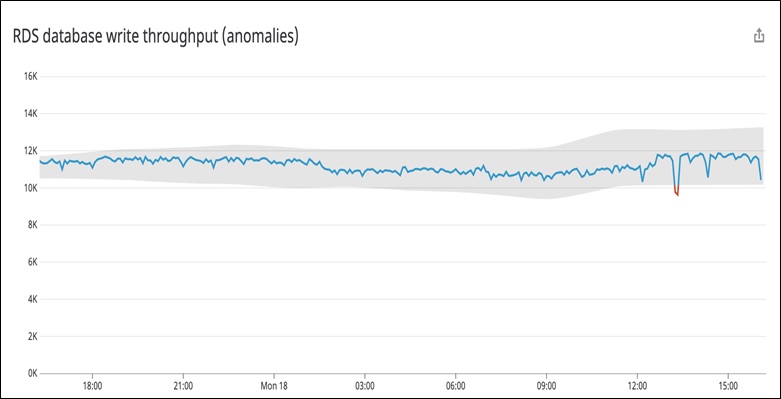
Figure 7 – Example of Datadog anomaly detection.
To investigate this anomalous drop in throughput, you could click on the dip and run a Metric Correlations search. This would find out whether other components in your environment could also be affected, and identify candidates for the potential root cause of this particular issue.
Read more about anomaly detection in the Datadog documentation.
Conclusion
To effectively investigate Amazon RDS performance issues, you need deep visibility into real-time monitoring data from your databases.
By integrating Datadog with Amazon RDS, you’ll be able to automatically collect metrics and logs from Amazon CloudWatch and directly from your database instances. Datadog uses those metrics and logs to give you comprehensive visibility into your RDS clusters as well as other key services in your environment.
Once you are collecting data from Amazon RDS, Datadog’s algorithmic features, such as anomaly detection and forecasting, help you proactively monitor your environment in minutes.
If you’re a current Datadog customer, learn more about monitoring your Amazon RDS clusters.
You can also try Datadog with a 14-day trial.
.

.
Datadog – APN Partner Spotlight
Datadog is an Amazon RDS Service Ready Partner. A monitoring service for cloud-scale applications, Datadog brings together data from servers, databases, tools, and services to present a unified view of your entire stack.
Contact Datadog | Solution Overview | AWS Marketplace
*Already worked with Datadog? Rate this Partner
*To review an APN Partner, you must be an AWS customer that has worked with them directly on a project.