AWS Architecture Blog
Deploy open source Regional availability tools in your VPC
When you build multi-Region architectures on AWS, one question comes up early: “What services are available in each AWS Region?” The answer shapes architecture decisions, from which AWS Regions to expand into, to how you design for resilience. For teams navigating data residency requirements and compliance reporting, getting the answer wrong has real consequences: deployment failures, compliance gaps, and delayed launches.
AWS publishes Regional availability data covering services, features, APIs, and AWS CloudFormation resource types across all AWS Regions. You can explore this data on the AWS Capabilities by Region page, access it through Amazon Simple Storage Service (Amazon S3) for pipeline integration, or query it using the AWS Knowledge MCP server. These options work well for exploration and automation. However, teams told us they need this data deployed as infrastructure they own, refreshing on their schedule, inside their network, filtered to their workload. That means running availability data the same way you run the rest of your stack: in your Amazon Virtual Private Cloud (Amazon VPC), under your governance.
In this post, we introduce two open source solutions that deliver that ownership. Capability Insights for AWS deploys a Regional availability dashboard into your VPC that auto-refreshes every 24 hours. The dashboard, its API, and availability data all run in your own account, and the scheduled refresh makes the only call that leaves your account when it reads the dataset that AWS publishes. Workload Analysis scans your AWS CloudTrail logs and CloudFormation stacks, then narrows 200+ services to the 20–30 your account actually runs, significantly reducing the scope of a Regional gap analysis.
Together with the Capabilities by Region S3 Access Point, you now have three levels of control: consume from Amazon S3, deploy into your VPC, or filter to your workload. We walk through how to deploy each solution, run a workload analysis, and view personalized results during your Regional expansion planning. Whether you’re building multi-Region recovery strategies, standardizing compliance reporting, or accelerating expansion timelines, these solutions put the data and the decisions it drives inside your perimeter.
Figure 1 shows how Capability Insights for AWS integrates with the VPC and subnets in your existing AWS account. A client in the public subnet accesses the dashboard through an S3 gateway endpoint and calls the private API through an API Gateway VPC endpoint.
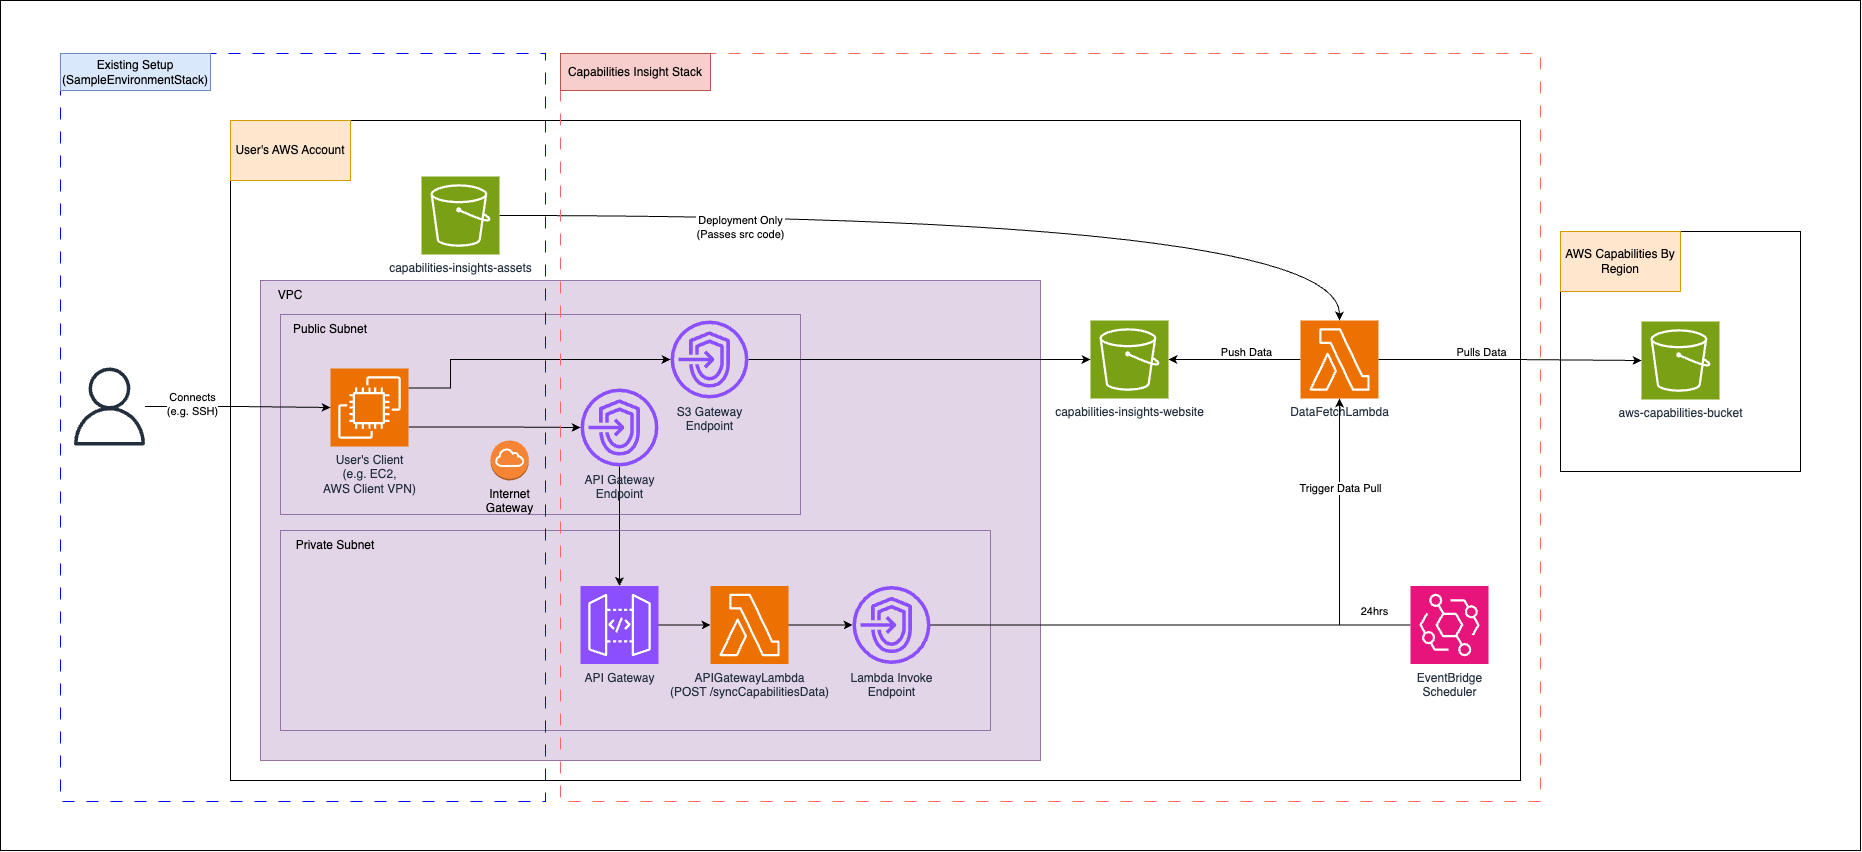
Figure 1: Capability Insights for AWS architecture, including private dashboard access and scheduled Regional availability data refreshes.
An Amazon EventBridge schedule invokes the data-fetch Lambda function every 24 hours. The data-fetch function runs outside your VPC, so it reads the S3 access point published by AWS over the AWS network. The function pulls Regional availability data from the Capabilities by Region S3 bucket published by AWS and writes it to the website bucket within your account. The dashboard application accesses the data within the website through the S3 gateway endpoint from your VPC. The API Lambda can also invoke the data-fetch function on demand through the Lambda VPC endpoint. The deployment assets bucket supplies the Lambda code during deployment only.
Prerequisites
To follow along, you need:
- An AWS account with permissions to deploy the CloudFormation stacks, including permission to create named AWS Identity and Access Management (IAM) roles. At runtime, the roles created by the stacks use scoped permissions for Amazon S3 object read and write access, AWS CloudFormation read operations, Amazon Athena queries, AWS Glue and AWS Lake Formation catalog access, AWS Lambda invocation, and AWS Step Functions execution. For starting-point deployment policies, see the documentation folder in the repository.
- AWS Command Line Interface (AWS CLI) installed and configured.
- A VPC with DNS resolution and DNS hostnames enabled, one public subnet (routed to an internet gateway) for dashboard and API access, and one private subnet (no internet route) for the in-VPC Lambda function. Both subnets need a route to Amazon S3 through a gateway VPC endpoint.
- Node.js v24.18.0 (includes npm and npx) for automated deployment.
- An S3 bucket for deployment assets.
- An active CloudTrail configuration where you store logs in an S3 bucket (required for Part 2).
Part 1: Deploy a self-hosted dashboard (Capability Insights for AWS)
Capability Insights for AWS deploys a searchable Regional availability dashboard into your own AWS account. The solution pulls data from the AWS Capabilities by Region S3 bucket, stores it inside your VPC, and serves it through a static website backed by Amazon API Gateway, AWS Lambda, and Amazon EventBridge.
If your organization has access to additional data sources beyond the public dataset, the solution incorporates those as well, giving you a unified view across all AWS partitions you have access to. To learn more about accessing additional data, work with your AWS representative.
The dashboard covers:
- Services and features: availability status, expected launch dates, and expansion plans per Region.
- API operations: individual API action availability per Region for each AWS service.
- CloudFormation resource types: which resource types each Region supports.
You provide your own VPC, subnets, and S3 bucket so the solution integrates with your existing infrastructure and security controls.
Clone and install
Create a deployment assets bucket
Create an S3 bucket with public access blocked to store the Lambda code package during deployment. We recommend naming it capability-insights-assets-<ACCOUNT_ID>-<REGION>.
Deploy the stack
Automated deployment:
The script builds all assets, prompts for parameters, deploys the CloudFormation stack, uploads the website, and triggers an initial data sync. You will be prompted for SourceFolders, a comma-separated list of data sources to pull from. The default is public.
To skip interactive prompts, pass all parameters as flags:
| Flag | Description |
| –private-vpc-id | VPC ID with DNS resolution and DNS hostnames enabled |
| –backend-subnet-id | Private subnet with no internet route. Needs a route to Amazon S3 through a gateway VPC endpoint. |
| –api-access-subnet-id | Public subnet routed to an internet gateway (user access, API Gateway VPC endpoint) |
| –deployment-assets-bucket-name | S3 bucket for deployment assets |
| –source-access-point-arn |
Public Capabilities by Region S3 access point ARN published by AWS. Account ID 686591367145 identifies the account managed by AWS that hosts the public dataset. Use the ARN as shown. For details on the public dataset, see Building automated AWS Regional availability checks with Amazon S3. |
| –source-folders | Comma-separated data sources (default: public) |
Manual deployment:
If your organization requires deploying with native AWS tooling only, download build-assets.zip from the latest release and follow these steps:
Access the dashboard
The solution hosts the website on S3, accessible only from within your VPC:
Because the solution you deploy hosts the website without public access, you need connectivity to the VPC. Common options:
- Existing VPN or AWS Direct Connect: use your organization’s existing connectivity.
- AWS Client VPN: set up a Client VPN endpoint in the VPC.
- EC2 instance with SOCKS proxy: SSH into an instance in the VPC and proxy browser traffic through it.
Explore the dashboard
Once connected, the dashboard provides:
- Search and filter: find services by name across all Regions.
- Expandable service details: select any service to see individual feature availability per Region.
- Status indicators: Available, Planning, Not Expanding, and projected dates (for example, “2026 Q3”)
- Export: download the current view as JSON or CSV for sharing or further analysis.
- Settings: view last sync time and trigger manual data refreshes.
Figure 2 shows the Capability Insights for AWS dashboard and its controls for comparing service availability across Regions.
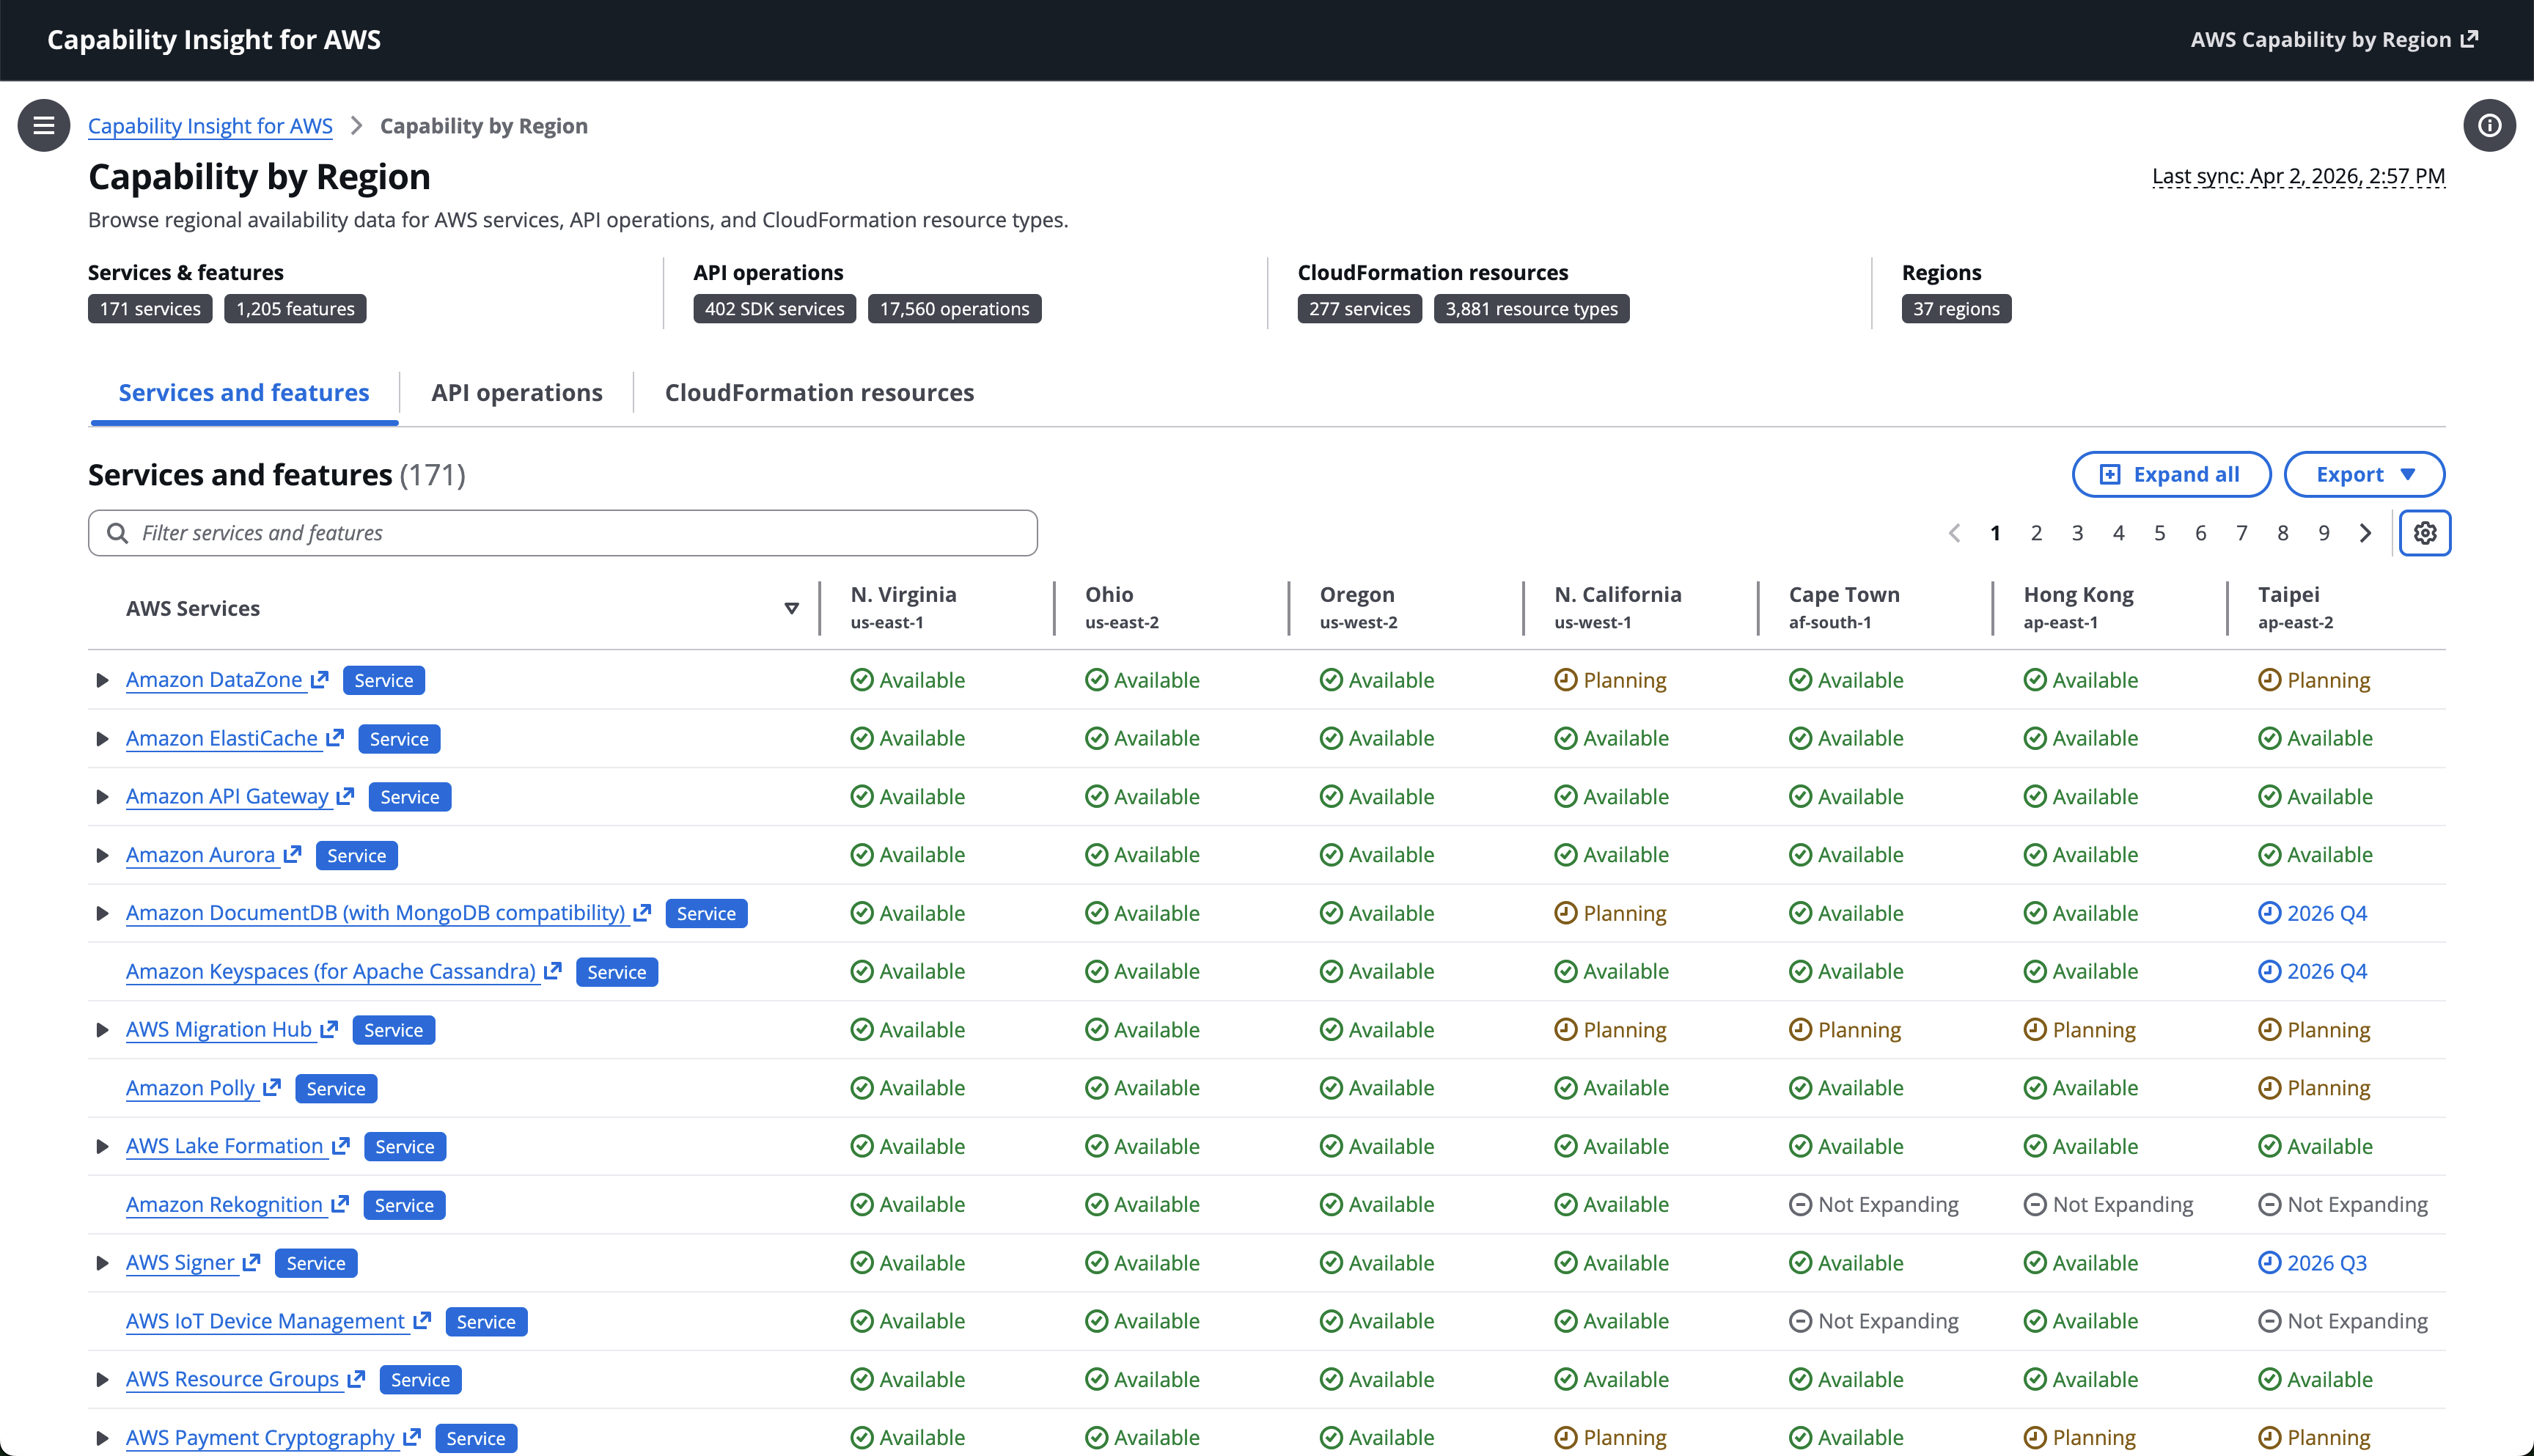
Figure 2: Dashboard overview showing service availability across Regions with status indicators and export options.
Summary counts show coverage for services and features, API operations, CloudFormation resources, and Regions. Tabs switch between catalog views, while filtering, Region columns, status values, and the expand and export controls help you inspect and download availability data.
At this point you have a working dashboard inside your VPC, refreshing daily, with no external dependencies during normal operation.
Part 2 adds personalization by filtering this catalog to the specific services your account runs. You can view the workload analysis results through the dashboard or access them through dedicated API endpoints.
Part 2: Personalize the catalog with Workload Analysis
The catalog covers 200+ services across 35+ Regions. When you plan expansion to a new Region, you don’t need to evaluate all of them. You need to evaluate the 20–30 your account runs. Without that filter, a gap analysis is a multi-week project. With it, it’s a 30-minute review.
Workload Analysis deploys as an additive CloudFormation stack alongside the Capability Insights stack. The pipeline runs as an AWS Step Functions state machine with three stages:
- Parallel analyzers (two branches run in parallel):
- CloudTrail Analyzer: Creates an AWS Glue Data Catalog table pointing at your CloudTrail log bucket, then runs an Amazon Athena query that extracts distinct service/API/Region/account combinations from the last N days (configurable, default 30). This identifies services your account has called.
- CloudFormation Analyzer: Calls
ListStacksandGetTemplatefor every active stack in the account. ExtractsAWS::resource types and scalar property values (strings, numbers, booleans), maps them to service names, and records which stack contributed each resource. This identifies what your account deploys, not only what it calls.
- Usage Decorator runs after both analyzers complete. It reads the primary capability catalogs (
products.json,apis.json,cfn_resources.json) from the website bucket, intersects them with the analyzer outputs, and writes personalized files back to the bucket for the dashboard to consume. - Scheduled execution through an Amazon EventBridge rule triggers the state machine daily (configurable schedule expression), keeping personalized data fresh without manual intervention.
Figure 3 shows how the Workload Analysis components coordinate scheduled and on-demand analysis.
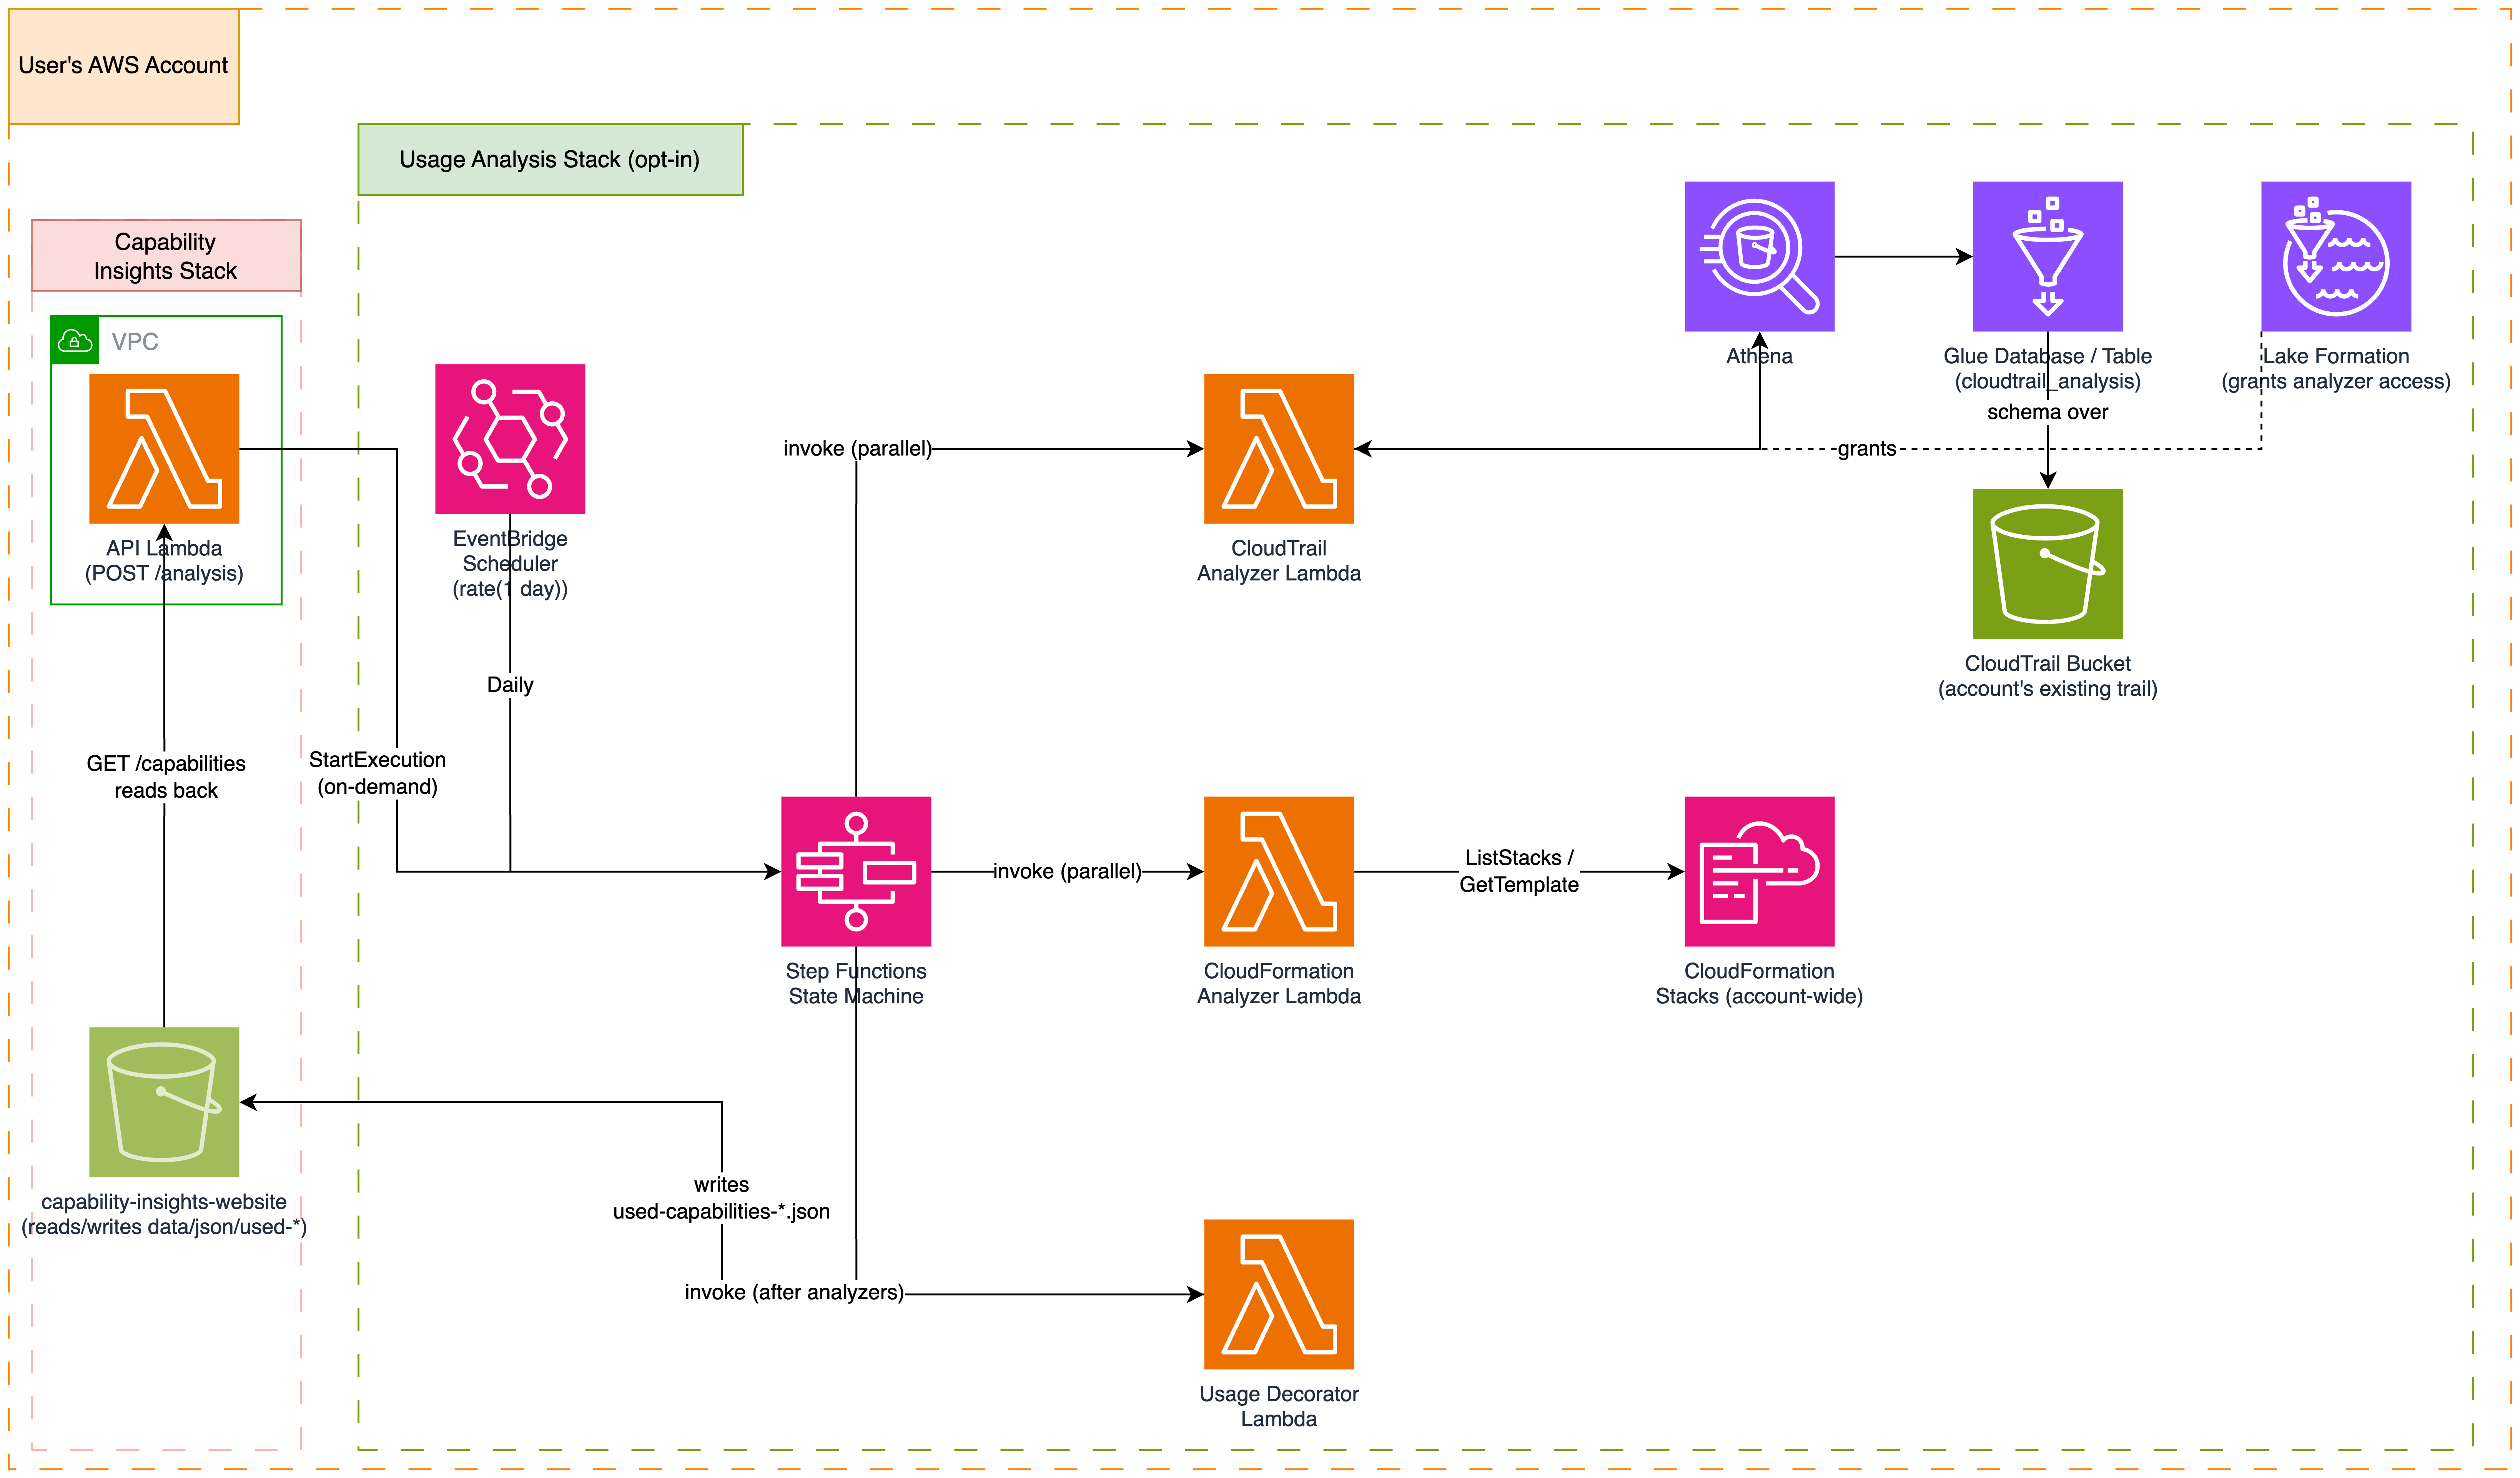
Figure 3: Workload Analysis infrastructure components.
An Amazon EventBridge schedule or an on-demand API request starts the AWS Step Functions state machine. The workflow runs two branches in parallel: the CloudTrail analyzer uses Amazon Athena with AWS Glue Data Catalog and AWS Lake Formation catalog access to query activity, while the CloudFormation analyzer inspects active stacks. After both branches complete, the Usage Decorator combines their results with the primary capability catalogs and writes personalized data to the Capability Insights website bucket for the dashboard and API to consume.
Deploy Workload Analysis
Verify that CloudTrail is active and your logs land in an S3 bucket. Then deploy with the usage analysis flag:
This deploys both the core Insights stack and the Usage Analysis stack, then wires them together so the API Lambda can trigger analysis and serve personalized results.
| Additional flag | Description |
--enable-usage-analysis |
Enables the Workload Analysis pipeline |
--cloudtrail-bucket |
S3 bucket containing your CloudTrail logs |
A typical first run completes in 2–5 minutes depending on account size and the number of active CloudFormation stacks.
Retrieve API endpoint
Use the following command to retrieve the API base URL from the API configuration file on the dashboard bucket:
The command returns output similar to the following:
Use apiBaseUrl as the base URL for the dedicated API endpoints. You must run API requests from within the VPC because the API Gateway endpoint is private.
Run an analysis
Start an analysis by calling POST /analysis through the API Gateway endpoint:
The Amazon EventBridge rule triggers subsequent runs daily. You can also trigger ad-hoc runs through the dashboard’s Settings page.
View personalized results
After an analysis completes, the dashboard toggles between the full catalog and your personalized My Stuff view, showing only services and resources your account uses.
Through the API:
The response contains filtered products, APIs, and CloudFormation resources with usage attribution, including which stacks deploy each resource type and which property configurations you use:
Practical example
Consider an account running a typical web application. Without Workload Analysis, the dashboard shows all 200+ services across 35 Regions. With the combined filter applied:
- Before: 200+ services, thousands of features, hundreds of CloudFormation resource types.
- After: 28 services your account uses, with per-stack attribution showing which CloudFormation stacks deploy each resource type.
The CloudFormation resource view goes deeper. For each resource type your stacks deploy, you can see which property configurations are in use and which stacks contributed them. For example, your AWS::EC2::Instance resources might show InstanceType: t3.medium from your application stack and InstanceType: m5.xlarge from your data processing stack, each traced back to its source.
This targeted view means your Regional expansion gap analysis focuses on the 28 services you care about rather than the full catalog. For example, if you plan to deploy into the Europe (Zurich) Region (eu-central-2), the dashboard shows which 28 services are available there, which have planned launch dates, and which have no roadmap entry yet. These results highlight service-availability gaps to consider during Regional expansion. From here, you can evaluate your options: wait for planned launches, architect around unavailable features, or evaluate a different target Region. You’re not evaluating 200+ services against a Region matrix. You’re scanning a personalized list where every row is something your stacks deploy.
Clean up
To remove the resources created in this walkthrough:
Workload Analysis (if deployed): Delete the Usage Analysis stack first:
Self-hosted dashboard: Empty the website bucket (static assets, capability data, and usage analysis output), then delete the stack:
Optionally delete the deployment assets bucket you created during setup. This solution uses standard AWS service pricing for Lambda, S3, API Gateway, Athena, and Step Functions. There is no additional charge for the solution itself.
Automated cleanup: Run npm run teardown to remove both stacks and empty the website bucket in one step.
Conclusion
Knowing which services are available in your target Region is the first step in designing for resilience. You can’t build a multi-Region recovery strategy for services that aren’t there yet. With Capability Insights for AWS and Workload Analysis, you own that data inside your VPC, filtered to what your account runs, refreshing on your schedule.
Start here:
- Clone the Capability Insights for AWS repository and run
npm run deployto deploy a working dashboard in under 10 minutes. - Add
--enable-usage-analysisto personalize the catalog to your account’s real footprint. - For CloudFormation concepts and deployment guidance, see the AWS CloudFormation User Guide.
- For zero-infrastructure programmatic access to the raw data, see Building automated AWS Regional availability checks with Amazon S3.
- For automated expansion analysis using this data, see Accelerate Region expansion with the AWS Knowledge MCP server.