AWS Database Blog
Build an organization-wide Amazon RDS posture dashboard with Kiro
Deletion protection on an Amazon Relational Database Service (Amazon RDS) database is a single setting, and anyone with permission to modify the database can switch it off. Across hundreds of AWS accounts, there is no single place to answer the question: which databases still run without it? That gap matters when a change window deletes the wrong database, and it matters when an audit asks for the list. In this post, we show you how to track Amazon RDS posture organization-wide with one Amazon CloudWatch dashboard. Our solution shows which databases miss deletion protection, Multi-AZ, or backups. Detail rows add the engine and version for each supported resource. The dashboard also shows who switched a protection off and when, and which engines approach the end of standard support. It uses Amazon EventBridge, Amazon CloudWatch, and the AWS services that already evaluate your databases, with Kiro building and verifying every piece against a live account.
The request came from a cloud infrastructure team at a global financial services company. The Amazon Elastic Kubernetes Service (Amazon EKS) Dashboard already gives them one organization-wide view of their clusters, and they wanted the same for their databases. Amazon CloudWatch Database Insights gives them fleet health and load across accounts, and this solution complements it with a protection view: which databases run without deletion protection, Multi-AZ, or backups.
AWS Trusted Advisor, AWS Security Hub CSPM (Cloud Security Posture Management), AWS CloudTrail, AWS Config, and AWS Health already watch your databases. All five deliver events to Amazon EventBridge. The missing piece was the pipe that collects those events from every account into one view.
The complete solution lives in the accompanying repository on GitHub. It contains AWS CloudFormation templates, functionally identical Terraform configurations, and a harness that deploys, seeds, tests, and verifies the dashboard through the AWS Command Line Interface (AWS CLI). This post focuses on the result and the reasoning. The code is there when you want it.
What this post covers, and what it does not
This post covers an organization-wide, near real-time view of Amazon RDS and Amazon Aurora posture. The walkthrough deploys one account in about 10 minutes, then rolls out to organizations with service-managed AWS CloudFormation StackSets.
It doesn’t cover the Amazon RDS console recommendations or AWS Compute Optimizer rightsizing, which reach you through their consoles and APIs rather than through Amazon EventBridge events.
For cost enrichment, the Cloud Intelligence Dashboards read the same sources on a schedule and complement this deployment. The dashboard tells you and alerts you, and it changes nothing. AWS Security Hub CSPM and AWS Config remain the authoritative current inventory. We validated the walkthrough in one account across two AWS Regions. The repository includes the second-account validation procedure.
Solution overview
Every member account forwards the events it already receives to one custom event bus in the central account, which stores them, derives metrics and alarms, and renders the dashboard. The design has no AWS Lambda function to maintain, and no database of your own to operate. The following diagram shows the flow.
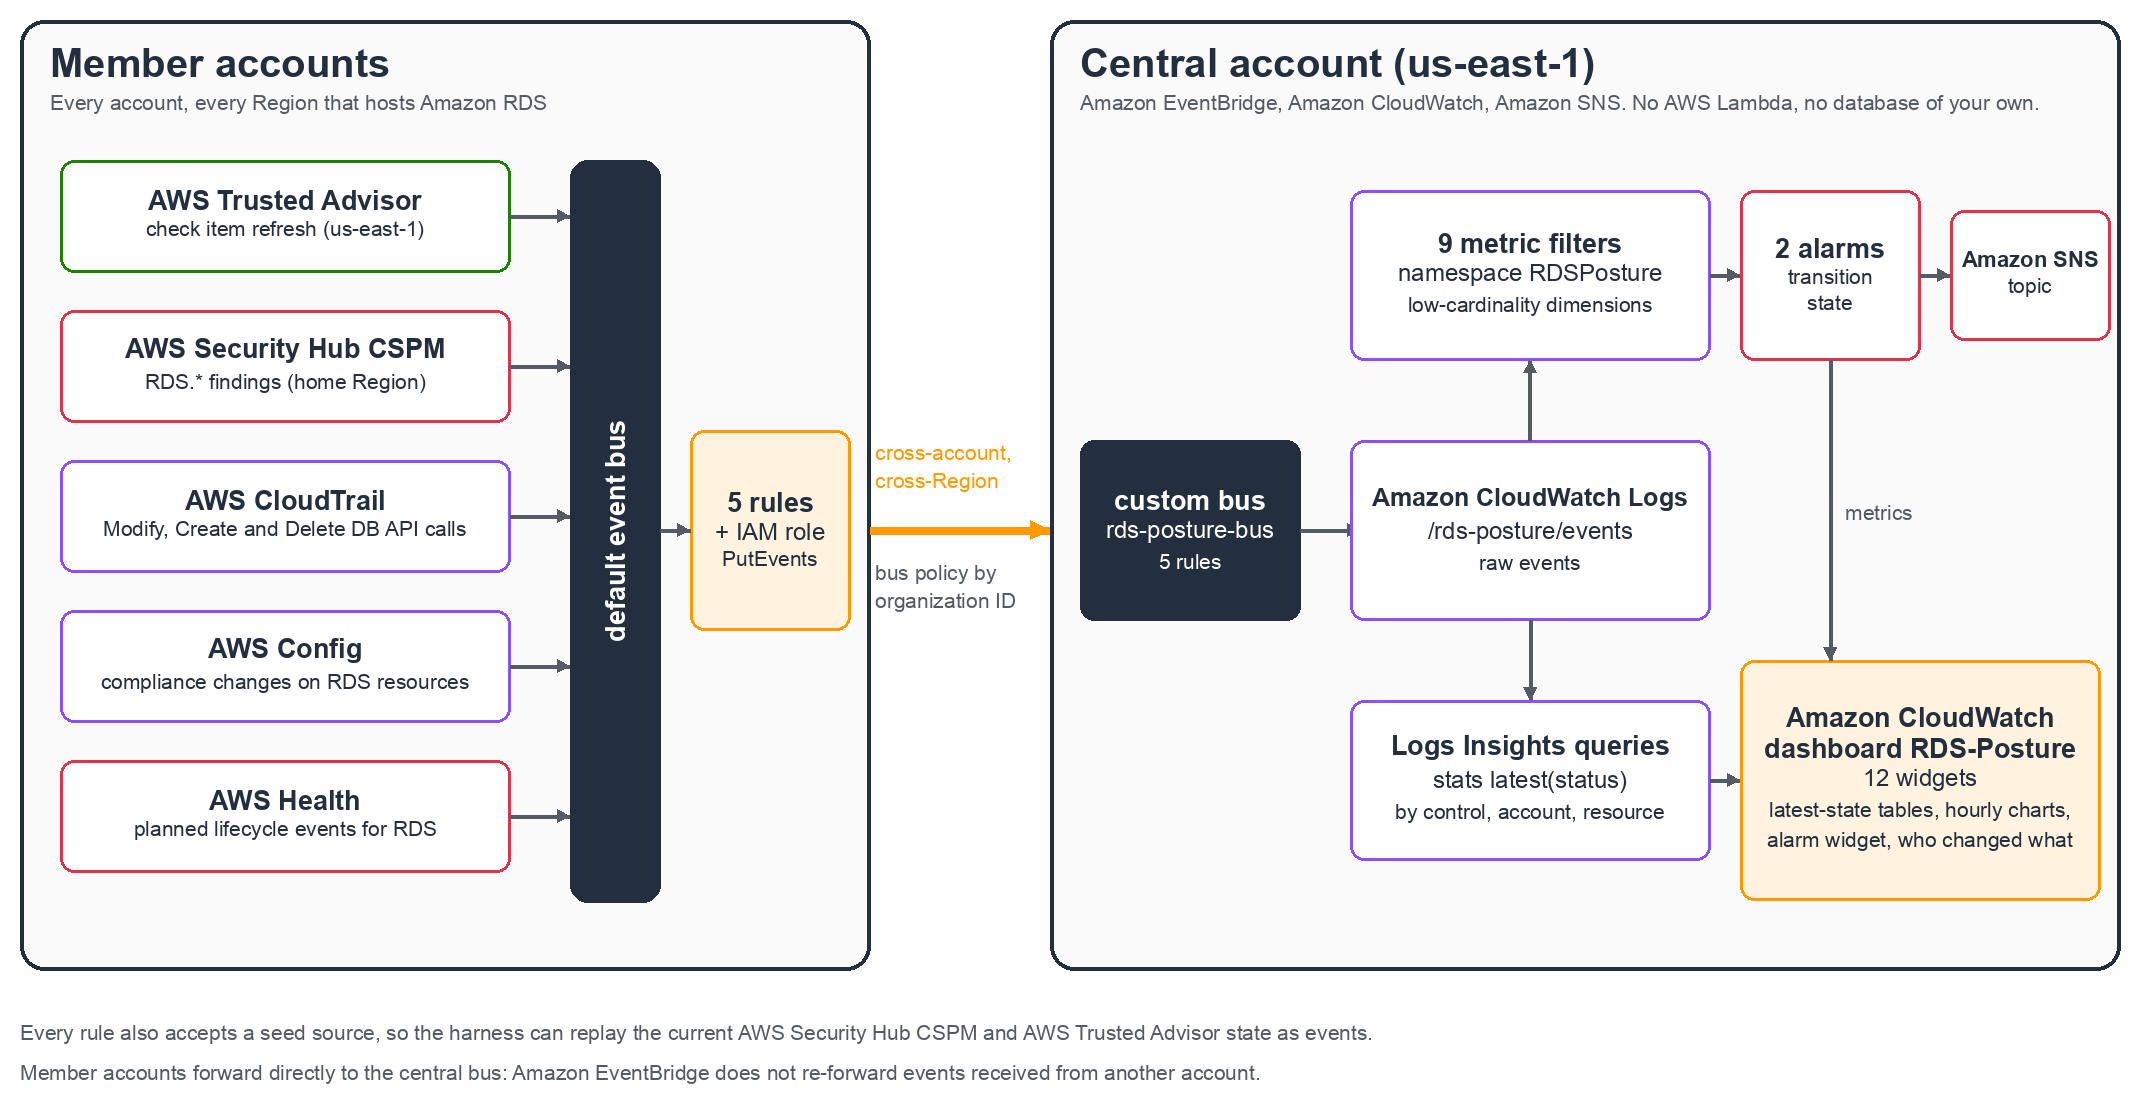
Figure 1: Member accounts forward Amazon RDS events to a central bus. The central account turns them into a log, metrics, alarms, and one dashboard
The following table lists the five feeds. The last column determines where the member rules must exist.
| Feed | Event (source and detail-type) | What it tells you | Where the event appears |
| AWS Trusted Advisor | aws.trustedadvisor, Trusted Advisor Check Item Refresh Notification |
Status changes of the Amazon RDS and Amazon Aurora checks | The US East (N. Virginia) AWS Region (us-east-1) only, for accounts with a Business Support+, Enterprise Support, or Unified Operations plan |
| AWS Security Hub CSPM | aws.securityhub, Security Hub Findings – Imported |
New and updated RDS.* control findings: deletion protection, Multi-AZ, backups, and more |
The delegated administrator’s home Region (every member account and linked Region) |
| AWS CloudTrail | aws.rds, AWS API Call via CloudTrail |
Deletion protection off, unprotected create, and delete, with principal and source IP | The Region of the API call, in every account with a trail logging management events |
| AWS Config | aws.config, Config Rules Compliance Change |
Compliance changes of your own rules on Amazon RDS instances and clusters | The Region of the rule |
| AWS Health | aws.health, AWS Health Event |
Planned lifecycle events, such as end of standard support notices, and scheduled changes | The Region of the affected resource, plus a copy to a backup Region |
The custom bus rds-posture-bus accepts events from the central account and from every organization ID you list. Five rules on that bus write matching events to the Amazon CloudWatch Logs log group /rds-posture/events. Nine metric filters derive counts into the RDSPosture namespace, two alarms watch two of those metrics, and a dashboard with 12 widgets reads the log group and the metrics. The following capture shows one of the metric widgets after the baseline seed.
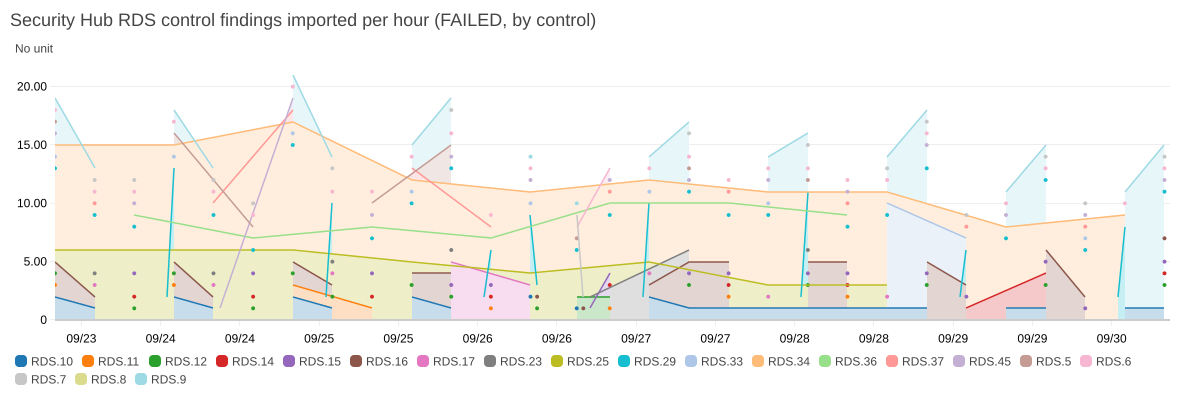
Figure 2: AWS Security Hub CSPM RDS.* findings per hour, by control, in the test account
Design decisions
Five decisions in the templates determine what the dashboard shows, when it alerts, and what it costs.
Tables show the latest state per resource, not counts of events
A count of failed findings in the last 7 days tells you how busy AWS Security Hub CSPM was, not how many databases lack protection. AWS Security Hub CSPM re-evaluates each control periodically, so a single unprotected database produces a new FAILED finding on every pass. Over 7 days, that one database can account for seven or more findings, which means the raw event count reflects evaluation frequency, not the size of your problem. The tables therefore keep the most recent status per control, account, and resource, and only then filter and count. Amazon CloudWatch Logs Insights expresses that in one line:
The detail table also reads Engine and EngineVersion from AWS Security Finding Format (ASFF) resource details for DB instances, clusters, and snapshots. Unsupported resource types leave those columns blank, and the other event feeds don’t expose one consistent current-version field.
A database that fails in the morning and passes in the afternoon drops out of the table. By design, the tables only read events inside the dashboard time range: the view shows which databases lack protection now, not which ever lacked it. The dashboard therefore opens on the last 7 days. Keep the range at 7 days or more.
A transition alarm for paging, a state alarm for repeat reminders
Two alarms watch deletion protection and answer different questions. The transition alarm fires when someone switches deletion protection off, from the AWS CloudTrail event for ModifyDBInstance or ModifyDBCluster. The matching event in the log group, and the change table at the bottom of the dashboard, record the principal and the source IP.
The state alarm fires whenever AWS Security Hub CSPM imports a FAILED finding for control RDS.7 (clusters) or RDS.8 (DB instances). AWS Security Hub CSPM re-evaluates both controls when the resource changes and at least once every 24 hours. The alarm therefore returns to ALARM at each re-evaluation while an unprotected database exists. Treat the state alarm as a reminder, and route the transition alarm to the on-call responders.
The AWS CloudTrail rule uses a single event pattern with three alternatives:
The second alternative matters more than it looks. A CreateDBInstance call that omits deletionProtection creates an unprotected database, so the pattern matches an absent key too. In the test account, a real modify-db-instance --no-deletion-protection on a throwaway instance moved the transition alarm from OK to ALARM within 5 minutes, and the alarm history is the proof.
Every rule also accepts a seed source, so the view is not empty on first deployment
An event-driven view knows nothing about the state before you deployed it, so the harness seeds a baseline. It reads the current RDS.* findings from AWS Security Hub CSPM and the flagged resources of every Amazon RDS and Amazon Aurora check from AWS Trusted Advisor. It reshapes them into the live event formats and puts them on the central bus. Custom events can’t use a source that begins with aws.. Every rule therefore also accepts a configurable seed source, and the metric filters key on the detail-type rather than the source. The two alarm filters also require the AWS service source, so a seeded event can’t raise an alarm. Live events then supersede seeded ones per resource.
Metric cost stays bounded because dimensions never name a resource
Amazon CloudWatch prices custom metrics per unique combination of metric name and dimension values. The metric filters therefore use control ID, check name, and status as dimensions, and never the account or the resource. The number of metric series doesn’t grow with the size of your estate. The default publishes AWS Security Hub CSPM metrics for FAILED findings only. A parameter switches to all statuses.
Events cross accounts once, with a role, and never twice
The central bus policy grants events:PutEvents to principals whose aws:PrincipalOrgID matches an organization ID you list. Narrow the policy to specific accounts if organization-wide write access matters in your environment. Each member rule targets the central bus through an AWS Identity and Access Management (IAM) role whose only permission is PutEvents on that bus. The role keeps your service control policies in force. Amazon EventBridge doesn’t forward an event it received from one account on to a third account. Every member account therefore targets the central bus directly. Member rules outside the central Region also cross Regions to reach the bus.
Three things to check before you trust your copy
Three details of the feeds cost us time during the build, and the templates now handle each one.
AWS Health and AWS Trusted Advisor emit events in different Regions
AWS Trusted Advisor, a global service, emits everything in the US East (N. Virginia) Region (us-east-1). AWS Health delivers each event in the Region of the affected resource and copies it to a backup Region. The US West (Oregon) Region (us-west-2) backs up every other Region. If your member Regions include a backup Region, set the member stack’s ExcludeHealthBackupEvents parameter to true, or the table shows two copies of each event.
AWS Health organizational view is optional here. If you turn it on, set EnableHealthRule to false everywhere except the management or delegated administrator account.
Deploy the AWS Security Hub CSPM forwarding rule in one place
The delegated administrator’s home Region feed already carries findings from every member account and, with cross-Region aggregation, every linked Region. A member rule in every account duplicates those events, so set EnableSecurityHubRule to false in the organization-wide stack set and leave the default in the administrator account’s own deployment.
Since March 2026, Amazon CloudWatch can also ingest AWS Security Hub CSPM findings organization-wide into Amazon CloudWatch Logs directly. For a single organization, that native path can carry this feed: deliver findings to a log group and adapt the metric filters and widget queries to the finding format. The forwarding rule remains the fit when several organizations feed one bus, and the other four feeds have no native equivalent.
New rules can miss events for a short time
The Amazon EventBridge documentation warns that new rules might not match immediately. The first test injection from Kiro, 1 second after deployment, produced zero matches. The same events 4 minutes later flowed end to end. The harness command that injects test events therefore waits and counts the events in the central log group. A propagation delay then reads as a retry rather than a broken deployment.
Prerequisites
You need the following before you begin:
- AWS Command Line Interface (AWS CLI) version 2 and Python 3.9 or later (the harness is standard library only). Terraform 1.5 or later for the Terraform path.
- A Business Support+, Enterprise Support, or Unified Operations plan in each account whose AWS Trusted Advisor events you want.
- AWS Config recording in each Region that you monitor.
- AWS Security Hub CSPM with the AWS Foundational Security Best Practices standard, delegated administrator, and cross-Region aggregation.
- An AWS CloudTrail trail logging management events in every Region that hosts Amazon RDS (an organization trail satisfies this).
- Permissions to create the central resources: bus, rules, log group, metric filters, alarms, an Amazon Simple Notification Service (Amazon SNS) topic, and the dashboard. On the member side, five rules and one IAM role per region.
Walkthrough
Run the harness from the repository folder. The preflight command checks every prerequisite and reports the blockers before you deploy anything.
Add --iac terraform before the sub-command to use the Terraform configurations. Either toolchain produces the same resources. The verify command exits non-zero when a resource is missing, or a query doesn’t parse, so it doubles as a smoke test. The following output is from the test account 3 hours after a seed. The account ID is an example value.
For an organization, run deploy-central once with --org-ids o-aaaaaaaaaa,o-bbbbbbbbbb, then run stackset-commands in each organization’s management account. It prints the create-stack-set and create-stack-instances commands for a service-managed stack set, plus the equivalent Terraform apply. Seed once per organization from its AWS Security Hub CSPM delegated administrator account, because that account’s GetFindings returns every member’s findings. Then open the Amazon CloudWatch console and review the dashboard. A passing verify proves that the queries parse. Only the console proves that every widget draws.
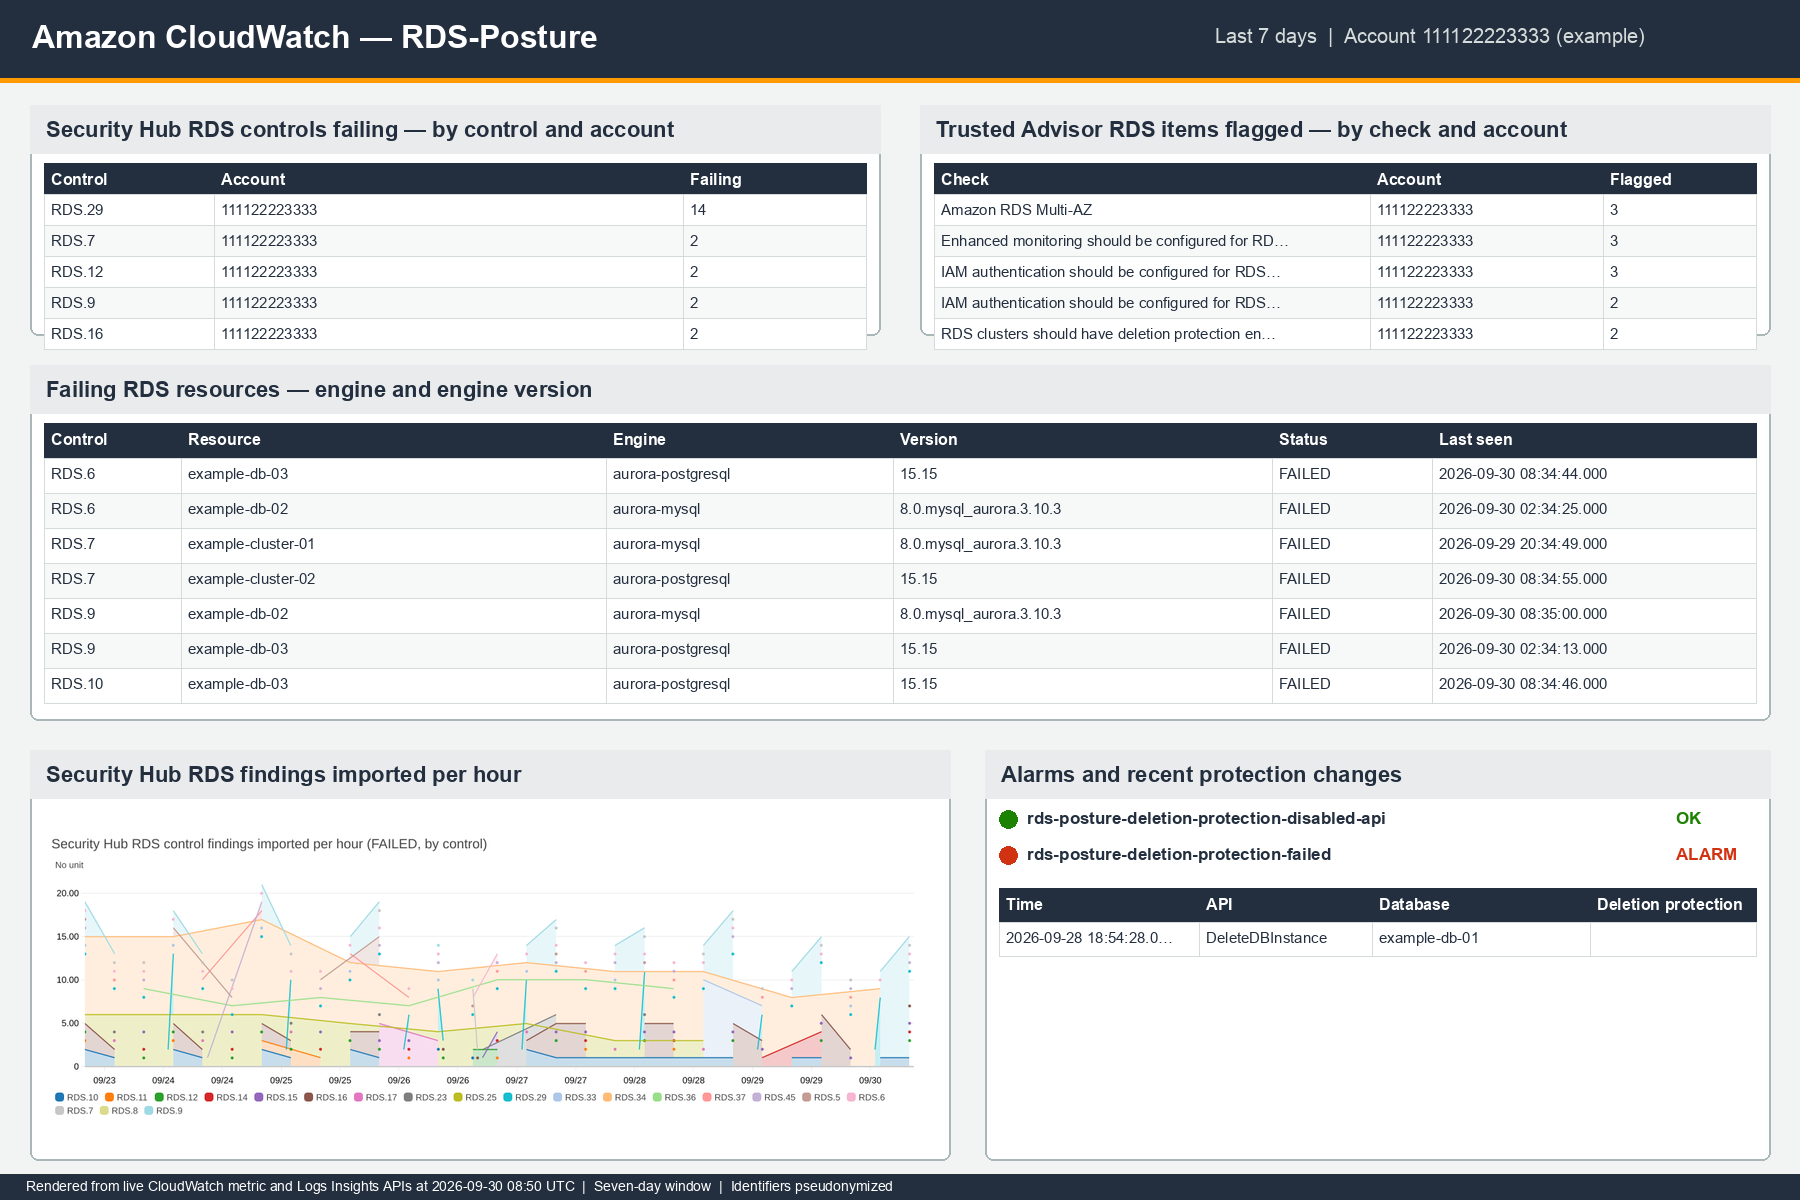
Figure 3: Redacted seven-day rendering of live dashboard widgets from the test account. AWS Security Hub CSPM detail rows include engine and engine version. Identifiers use example values
Let your AI assistant do the customizing
You don’t need to become fluent in Amazon EventBridge patterns, metric filter syntax, or Logs Insights to make this dashboard yours. The repository ships a Kiro skill that teaches an assistant the file layout, the deploy order, and the rules that keep the view trustworthy. Those rules are short: prove every pattern, filter, and query with the AWS CLI test commands before deploying, keep dimensions low-cardinality, and change both toolchains together. Open the repository in your assistant and describe what you want:
- Run
preflightin this account and report what blocks the AWS Trusted Advisor feed. - Add a widget that lists Amazon RDS instances whose backup retention dropped under 7 days, proving the Logs Insights query first.
- Do the same deployment with Terraform and prove that the resources end up identical.
The assistant edits, reruns the checks and the harness, and reports what it verified. You then review the dashboard on the console, which is the review step a person should own.
Cost
Custom metrics dominated the bill in the test account. Amazon CloudWatch prices them per unique metric per month, at $0.30 each for the first 10,000. Because the dimensions are checking name, control ID, and status, we estimate that a deployment carries 50–150 series, or $15–45 per month. The worst case is about 300 series, or $90 per month. The other line items are small:
- Cross-account event delivery at $1.00 per million events, which the sending account pays, plus inter-Region data transfer.
- Amazon CloudWatch Logs for ingestion and storage, a few GB per month for hundreds of accounts.
- Amazon CloudWatch Logs Insights queries, which Amazon CloudWatch prices per GB of log data that each query scans. A modest retention keeps this line small.
- One dashboard beyond the three included at no cost, and two standard alarms.
Forwarding the AWS Security Hub CSPM, AWS CloudTrail, AWS Config, and AWS Health events adds no charge on top of what those services already cost you. The AWS Trusted Advisor feed requires a Business Support+, Enterprise Support, or Unified Operations plan in each account, and that plan carries its own fee. These estimates use public US East (N. Virginia) prices as of September 2026. Check current Amazon CloudWatch pricing, Amazon EventBridge pricing, and AWS Support pricing for your Region.
Limits to keep in mind
- AWS Trusted Advisor delivers events on a best-effort basis, so treat its feed as a change signal and its console or organizational view report as the evidence.
- In the test account, the AWS Config feed carried no compliance change events for the service-linked rules that AWS Security Hub CSPM creates. The feed carries the rules you manage yourself. The controls arrive through AWS Security Hub CSPM.
- A seeded AWS Trusted Advisor item drops out after the seed leaves the dashboard time range. The dashboard opens on the last 7 days. Keep the range at 7 days or more, and re-run the seed when the AWS Trusted Advisor tables go quiet.
- Amazon CloudWatch dashboards are account-wide, so give a second deployment in the same account a different dashboard name.
Clean up
Run python3 harness/rdsposture.py destroy --member-regions us-east-1,eu-west-2 from the repository folder, adding --iac terraform if you deployed with Terraform. It removes everything the two deployments created. Delete any throwaway database you created for the alarm test. For an organization rollout, also remove the stack instances and the stack set from each management account.
Conclusion
Amazon RDS posture across an organization is a question you can answer from the events AWS already produces. The five services deliver the events, Amazon EventBridge collects them across accounts and Regions, and Amazon CloudWatch turns them into the latest state per database in one place. The design choices that matter are small: latest state over counts, a transition alarm for paging, a seeded baseline, and one cross-account hop with a role. Kiro built and verified the solution in an agentic loop that treated the account as the test bench. The accompanying repository carries the how, and your assistant can carry it the rest of the way to your organization.
For more information, refer to Monitoring AWS Trusted Advisor check results with Amazon EventBridge and Sending and receiving events between AWS accounts. Two related posts extend this one. Centralize visibility of Kubernetes clusters across AWS Regions and accounts with EKS Dashboard introduces the dashboard that inspired the request. Enhance the visibility of Amazon RDS instances and configuration with AWS Config and Amazon Quick Suite takes the inventory route and pairs well with this event-driven view.