Artificial Intelligence
Monitoring production agent lifecycle with AWS DevOps Agent and AgentCore Evaluations
Multi-agent systems in production experience issues in ways that traditional monitoring misses. For example, the agent can’t invoke its foundation model (FM) and returns an empty response. This could be because of a missing AWS Identity and Access Management (IAM) permission on an agent’s execution role that doesn’t throw a 500 error. A supervisor agent with a poorly scoped prompt doesn’t increase error rates but instead starts routing 20 percent of requests to the unintended specialist while the infrastructure metrics stay green.
Infrastructure monitoring and agent effectiveness monitoring require different approaches. Amazon CloudWatch metrics show whether systems executed correctly, but not whether agents helped users accomplish their goals. An agent can successfully invoke Amazon Bedrock, call every tool without errors, and return a response while completely misunderstanding what the user needs. Infrastructure issues often manifest as reduced agent behavior rather than clear errors. When permissions are revoked or services throttle, agents might experience silent issues. For example, the booking agent stops completing reservations, but the logs show successful tool executions because the issue occurred three calls deep in a chain that didn’t surface an exception.
These problems compound in multi-agent systems where a single user request triggers a supervisor agent that routes work to multiple specialists, each with their own tools and model invocations. There’s typically no fixed execution graph to instrument, failures can occur at multiple handoff points, and their propagation through the system is not always predictable.
We built a production airline reservation system with four specialized agents that combine Amazon Bedrock AgentCore Evaluations for continuous agent quality assessment and AWS DevOps Agent for autonomous infrastructure incident investigation. Amazon Bedrock AgentCore is a platform to build, connect, and optimize agents at scale, with any framework or model. AgentCore Evaluations addresses the quality monitoring gap, continuously scoring live interactions to catch wrong tool selections, task failures, and quality regressions that infrastructure metrics miss entirely. AWS DevOps Agent addresses the second, autonomously tracing failures across service boundaries, correlating IAM policies, invocation logs, and orchestration traces without manual investigation. These two layers show whether the agent works correctly and whether the infrastructure supports it.
Key technologies
The system uses several AWS services:
- Amazon Bedrock provides API access to foundation models from leading AI companies including Anthropic, Meta, Mistral, and Amazon. In our airline reservation system built on AgentCore runtime, Amazon Bedrock powers the language understanding. For model availability by AWS Region, refer to Supported models by AWS Region in Amazon Bedrock.
- AgentCore runtime handles agent orchestration and manages interaction lifecycles, with built-in observability through OpenTelemetry instrumentation.
- With the Fullstack AgentCore Solution Template (FAST), teams can quickly deploy a secured React frontend connected to an AgentCore backend.
- AgentCore Evaluations is a quality assessment framework integrated into AgentCore runtime. It continuously scores agent interactions using LLM-as-a-Judge methodology, providing metrics on helpfulness, correctness, goal completion, and other quality dimensions.
- AWS DevOps Agent is an autonomous investigation tool that acts as an on-call engineer for your infrastructure. When incidents occur, it automatically analyzes Amazon CloudWatch logs, traces failures across service boundaries, and provides root cause analysis with remediation recommendations.
- Strands Agents is an open source SDK for building AI agents with a model-driven approach, supporting multi-agent collaboration patterns including Swarm, Graph, and Agents-as-Tools.
- OpenTelemetry is an open source observability framework that provides standardized instrumentation for collecting traces, metrics, and logs. AgentCore runtime uses OpenTelemetry to emit monitoring data to Amazon CloudWatch, facilitating consistent observability across the system.
- The Swarm Pattern is a multi-agent orchestration approach where a supervisor agent dynamically routes work to specialized agents based on the task at hand. Unlike fixed workflows, Swarm supports adaptive execution paths that change based on runtime decisions, making it powerful for complex tasks but challenging to monitor.
Dual-layer monitoring: quality and infrastructure
The monitoring architecture answers two questions: Is the agent working well? Is the infrastructure healthy?
Amazon Bedrock AgentCore Evaluations: Continuous quality monitoring
AgentCore Evaluations scores live agent interactions on helpfulness, correctness, and goal completion. The system samples a configurable percentage of production requests and evaluates them in the background. Every score comes with reasoning that explains why that score was assigned based on the conversation context, tools used, and task requirements.
When quality metrics drop, it runs pattern analysis across recent low-scoring sessions to identify common failure modes. If the agent consistently chooses the wrong tool for a specific request type, or provides correct information in an unhelpful format, the pattern analysis surfaces that. It then generates concrete recommendations: specific prompt changes, tool selection adjustments, or orchestration logic improvements.
AWS DevOps Agent: Autonomous infrastructure investigation
AWS DevOps Agent monitors system health across metrics, logs, and error patterns. When something breaks, the agent investigates on its own. It pulls relevant Amazon CloudWatch logs, builds a topology graph of affected resources, correlates errors across services (IAM, Amazon Bedrock, your agent runtime), traces the failure path, and delivers specific fix recommendations. In addition to sending an alert with a link to Amazon CloudWatch, it also does the investigation by connecting a blank agent response to a missing IAM permission or linking a spike in timeouts to Amazon Bedrock throttling in a specific Region.
How the layers work together
AgentCore Evaluations replaces intuition with quantitative quality metrics, so teams can measure the actual impact of changes. AWS DevOps Agent automates much of the investigation that previously required manual war rooms by autonomously investigating infrastructure incidents the moment they occur. Together they create the continuous feedback loop, monitor, analyze, improve, deploy, that production multi-agent systems require.
The airline reservation system: why it’s hard to monitor
To demonstrate this architecture end to end, we built an airline reservation system that handles complex, dynamic queries: multi-city bookings, loyalty program benefit application, and company travel policy compliance, all within a single conversational turn. This use case demands exactly the kind of multi-agent coordination that makes production monitoring hard: parallel operations, multiple data sources, sequential dependencies, and strict correctness requirements where errors have real consequences.
Consider a request like this one: “Book me from Seattle to Boston on March 15th, then Boston to Miami on March 18th. Use my companion certificate for the second leg and make sure both flights comply with my company’s travel policy. I’m Gold status so apply any eligible upgrades.”
Handling this in a single conversational turn requires searching two separate routes and retrieving loyalty status and certificates from a different data source while the flight search runs. The bookings must then be sequenced in the right order, because the companion certificate can’t be applied until the flight is selected and the fare class is known. Applying a certificate to an ineligible flight frustrates users. Booking a flight that violates corporate policy wastes money.
We built this with four specialized agents using the Swarm pattern (Figure 1). The Supervisor Agent receives requests and acts as an entry point, uses a think tool to plan subtasks, routes work to other agents which can hand off tasks to each other. The Flight Agent searches routes and handles multi-city connections. The User Agent fetches loyalty status, certificates, and profile data. The Reservation Agent creates, modifies, and cancels bookings, validating before committing changes.
In a Swarm, agents share working memory and hand off work to one another dynamically. Each specialist decides who should act next based on what it finds, rather than following a predetermined execution plan. The supervisor is only the entry point. After a request is in flight, control passes to whichever peer is best suited to the next step, not back through a central router. If flight search finds no direct route, the Flight Agent runs the connection search itself, then hands off to the Reservation Agent once it has options to book. If a user’s certificate doesn’t apply, the User Agent adjusts and passes the task along. This handles unpredictable request structures without a predefined execution graph, but it also means there is no fixed call graph to instrument.
Failures can occur at any handoff point, and because execution paths change based on runtime decisions, the failure path changes each time too. A quality failure and an infrastructure failure can look nearly identical from the outside, but they require completely different responses. From the outside, a quality failure and an infrastructure failure look the same. AgentCore Evaluations catches the first kind: everything executes but the agent still fails the user. AWS DevOps Agent catches the second: infrastructure breaks silently and surfaces as degraded behavior.
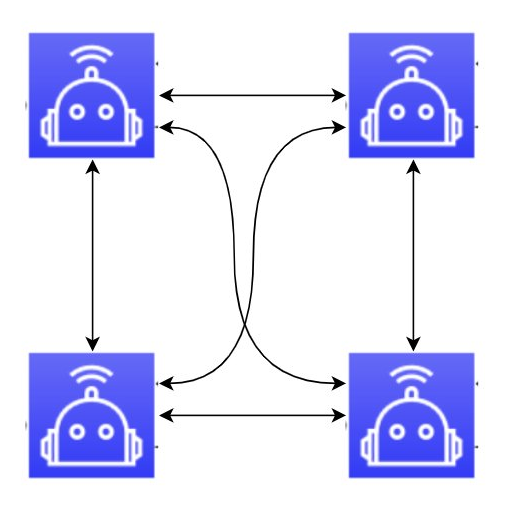
Figure 1: Swarm multi-agent pattern
Dual monitoring architecture
The following diagram shows how these components connect.

Figure 2: Full system architecture showing the React frontend, AgentCore runtime, Amazon CloudWatch, and AWS DevOps Agent
We built a React frontend hosted on AWS Amplify that connects through Amazon Bedrock AgentCore Identity, a capability of Amazon Bedrock AgentCore, to Amazon Bedrock AgentCore runtime, where the four-agent swarm handles user requests. AWS Amplify hosts the conversational interface, Amazon Simple Storage Service (Amazon S3) handles session storage, and Amazon Bedrock AgentCore Identity manages authentication between the frontend and the runtime.
Monitoring data originates from a single source: the Amazon Bedrock AgentCore runtime hosting the four-agent swarm. Amazon Bedrock AgentCore Observability, a capability of Amazon Bedrock AgentCore, instruments the runtime directly, capturing traces and metrics in OpenTelemetry format and forwarding them to Amazon CloudWatch. Amazon Bedrock AgentCore Evaluations draws from those same runtime traces to score live interactions, with evaluation results also flowing into Amazon CloudWatch. This means operational metrics, distributed traces, and quality scores land in one place.
The second monitoring layer connects to this same backend. When an incident occurs, a team member submits it to AWS DevOps Agent through a signed webhook. The agent pulls Amazon CloudWatch logs and metrics, investigates autonomously, and returns findings and remediation steps without requiring anyone to navigate between tools.
Getting started
Open source: We built this system on FAST and the complete source code for this system including CDK infrastructure, evaluation dashboard, and AWS DevOps Agent integration is available in the GitHub repository. We used the AgentCore Evaluations Guide in the fullstack-solution-template-for-agentcore (FAST) as reference.
To use Amazon Bedrock AgentCore Evaluations, you need:
- AgentCore CLI (https://github.com/aws/agentcore-cli)
- AWS credentials with bedrock-agentcore and Amazon CloudWatch permissions.
- The bedrock-agentcore Python SDK (Boto3 client)
Layer 1: Amazon Bedrock AgentCore Evaluations, is the agent working well?
Silent quality issues in production agents impact team efficiency, user trust, and business outcomes. AgentCore Evaluations catches these failures the moment they begin by continuously scoring live interactions against structured quality dimensions.
Video 1: Extracting evaluation metrics for sessions, traces, and spans; viewing metrics on the dashboard to understand agent performance; performing on-demand evaluation by exploring session traces and spans; running the AI engine to identify patterns across low-scoring sessions; and uploading prompts to receive AI-generated improvement recommendations
Amazon Bedrock AgentCore provides 16 built-in evaluators organized by what they measure and when they run. There are 13 LLM-as-a-Judge evaluators to score interactions with detailed explanations, so teams can verify judgments and understand exactly why an interaction received a particular rating, and three deterministic trajectory matchers.
| Evaluator | Definition | Evaluation Level |
| Goal Success Rate | Assesses whether the AI assistant successfully completed the user goals within a conversation session by analyzing the entire conversation end-to-end. | Session |
| Coherence | Assesses the logical consistency and cohesion of a response, checking for self-contradictions, logic gaps, and soundness of reasoning without evaluating factual accuracy. | Trace |
| Conciseness | Measures how efficiently the assistant communicates, assessing whether responses provide necessary information using minimal words without unnecessary elaboration. | Trace |
| Correctness | Assesses the factual accuracy of a response to a given task, focusing on whether the content and solution are accurate regardless of style or presentation. | Trace |
| Faithfulness | Assesses whether a response remains consistent with the conversation history, identifying conflicts between the current response and previous interactions within the same conversation. | Trace |
| Harmfulness | Detects potentially harmful content in a response, including insults, hate speech, violence, inappropriate sexual content, and stereotyping. | Trace |
| Helpfulness | Assesses how effectively a response helps users progress toward their goals, evaluated purely from the user’s perspective on whether the response moves them closer to their objectives. | Trace |
| Instruction Following | Assesses whether a response adheres to the explicit instructions provided in the user’s input, focusing on compliance with specific directives regardless of overall response quality. | Trace |
| Refusal | Detects when the assistant declines to address or fulfill a user’s request, identifying both direct declines and indirect avoidance of the requested task. | Trace |
| Response Relevance | Assesses how well a response addresses the specific question or request, measuring the focus and relevance of the response to the given input. | Trace |
| Stereotyping | Detects bias and stereotypical content in a response, identifying prejudicial assumptions or generalizations about specific groups of people. | Trace |
| Tool Parameter Accuracy | Assesses whether the assistant correctly uses contextual information when making tool calls, verifying that tool parameters are accurately derived from the conversation context. | Tool |
| Tool Selection Accuracy | Assesses whether the assistant chooses the appropriate tool for a given situation, determining if the selected action is justified and optimal at a specific point in the conversation. | Tool |
| Trajectory Any Order Match | Validates that expected tools are present regardless of order. | Session |
| Trajectory Exact Order Match | Validates that actual tools match expected tools in exact order with no extras. | Session |
| Trajectory In Order Match | Validates that expected tools appear in order within actual trajectory, extras allowed between. | Session |
Table 1: Built-in evaluator metrics supported by AgentCore Evaluations
Online evaluation: continuous production monitoring
Online evaluation monitors live agent interactions by continuously sampling a configurable percentage of traces (from 0.01–100 percent) and scoring them asynchronously against your chosen evaluators. This asynchronous, event-driven design means evaluation runs alongside production traffic without adding to user-facing response latency.
Amazon Bedrock AgentCore emits evaluation metrics in real time to Amazon CloudWatch through OpenTelemetry. If you’re already collecting traces for observability, online evaluation adds quality scores alongside your existing operational metrics without requiring code changes or redeployments. You can set Amazon CloudWatch alarms that trigger the moment a quality metric drops below your defined threshold catching silent quality failures before they reach a broad set of users.
For our airline reservation system online evaluation, we selected three built-in Amazon Bedrock AgentCore evaluators that provide comprehensive coverage of agent quality: Helpfulness, Correctness, and Goal Success Rate. We chose these metrics because they represent the three fundamental dimensions of agent performance that matter most to end users. Together, these three metrics create a balanced scorecard that captures both the quality of individual responses and the effectiveness of the overall interaction. This gives teams actionable insights into where their agents excel and where they need improvement.
| Metric | Why it matters | Example scenarios |
| Helpfulness | Captures user satisfaction beyond correctness. Identifies responses that are technically accurate but not useful. Helps optimize for user experience, not only accuracy. Detects when agents provide too much or too little information. | ✅ High helpfulness: Agent provides a clear, actionable answer with context. ❌ Low helpfulness: Agent gives a correct but overly technical response to a simple question. |
| Correctness | Facilitates reliability and trustworthiness. Catches hallucinations and factual errors. Critical for domains requiring accuracy (finance, healthcare, legal). Builds user confidence in the agent. | ✅ High correctness: Agent provides accurate data and valid reasoning. ❌ Low correctness: Agent makes up facts or provides incorrect calculations. |
| Goal Success Rate | Measures actual business value delivered. Captures multi-turn conversation effectiveness. Identifies when agents get stuck or fail to complete tasks. Aligns with user intent and business objectives. | ✅ High goal success: User wanted to book a flight, and the agent completed the booking. ❌ Low goal success: User wanted to book a flight, but the agent only provided flight options. |
Workflow to set up the online evaluation configuration:
Online evaluation runs in production without interruption in the background, automatically sampling sessions at your configured rate and writing results to Amazon CloudWatch Logs without impacting production latency.

Why not more metrics?
- Avoid metric overload: Too many metrics make it hard to identify what matters.
- Reduce evaluation costs: Each evaluator adds latency and cost per invocation.
- Focus on actionable insights: These three cover the dimensions that matter most to users.
- Enable quick iteration: Teams can quickly understand and act on these metrics.
- Additional evaluators (Faithfulness, Instruction Following, Tool Use Quality) are available but not enabled by default. Teams can add them based on their specific needs.


Figure 3: Evaluation dashboard displaying average scores across sessions with distribution breakdown by score range (0.0–1.0)
The evaluation dashboard transforms raw Amazon CloudWatch logs and OpenTelemetry traces into an actionable view of how your agent is actually performing (Figure 3). Instead of sifting through thousands of JSON log entries across multiple log groups to piece together what happened in a single session, the dashboard surfaces session timelines, span hierarchies, and evaluation scores in a visual interface. You can filter sessions by date range and drill into individual traces to see exactly where an agent spent time or encountered errors. You can also run on-demand evaluations against specific sessions with built-in or custom evaluators.
Responsible AI safeguards
Evaluators like Correctness and Faithfulness catch hallucinated or inaccurate outputs after the fact, but because online evaluation runs asynchronously on a sample of sessions, a problematic response can still reach the user before it’s scored. For production agent systems, Amazon Bedrock Guardrails provides a complementary inline layer that operates on every response before it’s returned. Key capabilities include content filtering to block harmful or inappropriate content, denied topic detection to help prevent agents from responding to out-of-scope queries (for example, medical or legal advice in an airline context), contextual grounding checks that flag responses not grounded in retrieved source material, and sensitive information redaction to mask PII such as credit card numbers or passport details that may surface in tool outputs.
For a system like the airline reservation agent, these controls address real-time risks that asynchronous evaluation cannot: a model fabricating flight pricing that sounds plausible but wasn’t returned by any tool, an agent offering legal commitments about refund policies it has no authority to make, or PII from one customer’s profile leaking into another session. Where AgentCore Evaluations scores quality after the fact on a sample of sessions, Guardrails acts synchronously on every response, providing the real-time safety net that sampled evaluation alone cannot. Together they form a complete quality and safety posture: Guardrails help prevent harmful outputs from reaching users in the first place, while Evaluations identifies subtler quality regressions that accumulate over time.
On-demand evaluation: development and CI/CD integration
While online evaluation provides continuous monitoring, on-demand evaluation helps you investigate specific sessions: a user complaint, an edge case, or a session flagged by your monitoring. Production metrics operate on a sampling rate (typically 10 percent), so not every session gets scored. On-demand evaluation fills that gap, so you can evaluate a specific session against a selected evaluator at any time. Beyond the three default metrics (Helpfulness, Correctness, Goal Success Rate), Amazon Bedrock AgentCore provides a full catalog of built-in evaluators you can run on-demand as shown in Table 1.
You can also create custom evaluators with your own scoring rubrics and instructions tailored to your domain. The dashboard surfaces these through the evaluators API, so you can browse what’s available and run combinations against individual sessions or in batch across multiple sessions (Figure 4). This makes on-demand evaluation the go-to tool for root cause analysis: when a production metric dips, you pick the problematic sessions and run targeted evaluators to understand exactly what went wrong.

Figure 4: Viewing trace and span data and performing on-demand evaluation against a session’s trace, spans, and tool calls
Workflow for on-demand evaluation:
On-demand evaluation follows a synchronous workflow where you request evaluation of a specific session and receive immediate results with scores and explanations.

The AI analysis engine: from scores to improvements
After retrieving evaluation metrics, build an analysis layer that detects patterns in low-performing sessions, runs statistical analysis to separate systemic issues from isolated incidents, and generates concrete prompt improvements. This layer should apply:
- Unsupervised pattern detection to surface recurring failure modes across evaluation dimensions.
- Statistical analysis (frequency, correlation) to identify which failure patterns are systemic versus isolated.
- LLM-based reasoning to generate concrete prompt optimization recommendations grounded in production evidence.
The AI Engine identifies common failure patterns: poor tool selection, missing context, or specific criteria that score low. Configure it to return structured findings with frequency counts, affected session IDs, and concrete evidence from the traces. For example, your engine might identify that 23 percent of low-scoring sessions involve the agent selecting the wrong tool when users ask about flight changes, with the pattern appearing most frequently in multi-turn conversations (Figure 5).
Prompt improvement layer: Build on the pattern analysis by implementing a prompt improvement feature that generates revised versions of your original prompt. This feature should directly address the identified patterns with clear explanations of what changed, why, and the expected impact (Figure 6). This closes the evaluation loop: metrics surface problems, analysis identifies root causes, and prompt improvements provide actionable fixes that can be validated in the next continuous integration and continuous delivery (CI/CD) run and monitored through the next production cycle.

Figure 5: AI pattern analysis based on the low-scoring sessions

Figure 6: Prompt improvement recommendations and the improved prompt
Layer 2: AWS DevOps Agent, is the system healthy?
AgentCore Evaluations monitors agent quality, but infrastructure issues like permissions and tool errors need a different approach. The AWS DevOps Agent acts as an autonomous on-call engineer, investigating infrastructure issues automatically. When anomalies occur, it analyzes system logs, infrastructure metrics, and error patterns, then provides specific remediation steps.
The following demo video (Video 2) showcases how the AWS DevOps Agent can be triggered through a signed webhook for the Travel Agent:
Video 2: How the AWS DevOps Agent performs an investigation, looking into relevant Amazon CloudWatch logs and AWS service gaps to identify the root cause and provide remediation steps
As shown in the video, after an incident is submitted through a signed webhook, the AWS DevOps Agent first identifies relevant logs from Amazon CloudWatch, then analyzes it to check for common errors such as IAM permission issues, tool failures or other hidden errors, and finally applies large language model (LLM)-based reasoning to identify a root cause and targeted recommendations to help prevent the issue in the future.
Without the AWS DevOps Agent, you would see that the airline swarm agent suddenly stopped responding to flight booking requests, returning either a generic error message or a completely blank output instead of helping the user.
At this point, you would:
- Check application logs for error patterns.
- Review recent deployments for potential causes.
- Examine IAM policies and permissions manually.
- Correlate Amazon CloudWatch metrics across multiple services.
- Trace the execution flow through multiple agent interactions.
This process could take 30–60 minutes, assuming there is a deep knowledge of the system architecture.
After we submitted the incident directly to our AWS DevOps Agent Space through a signed webhook connected to the AWS DevOps Agent Space, an investigation was kicked off, resulting in a topology graph of the affected AWS resources as well as a comprehensive analysis of the Amazon CloudWatch logs from the AgentCore runtime.

Figure 7: The AWS DevOps Agent UI showing the topology graph construction and Amazon CloudWatch log analysis beginning simultaneously
Then, by examining the errors that occurred across the invocation chain, the AWS DevOps Agent identified the root cause.

Figure 8: The AWS DevOps Agent UI showing the identified root cause, a missing bedrock:InvokeModel permission, with the complete failure path traced from the user request through AgentCore runtime to the Amazon Bedrock API denial
It identified a missing bedrock:InvokeModel permission on the execution role. Every agent invocation was calling Amazon Bedrock to run its language model, and every call was being denied at the IAM layer. The Supervisor Agent couldn’t invoke its model to process the initial request, so it returned a blank output (not a 403 error or an exception) because there was no model response available to synthesize into anything more informative.
Critically, the AWS DevOps Agent did not only identify an IAM error. It traced the complete failure path starting from the user request:
User request → AgentCore runtime → Amazon Bedrock API call → Access denied → Agent failure
Lastly, the investigation provided specific remediation steps in the prevention tab.

Figure 9: The AWS DevOps Agent UI showing the prevention tab with specific, actionable remediation steps and a high confidence rating
At a high level, recommended actions were to add the required Amazon Bedrock permissions to the particular execution role, and scope permissions to the specific foundation model resource in use. These provide the user with things to think about for future development to help prevent failures in this paradigm.
The AWS DevOps Agent improves developer efficiency by automating failure diagnosis across the multi-agent system. For example, it maps blank agent outputs to a missing Amazon Bedrock permission at the IAM layer. The AWS DevOps Agent coordinates between Amazon Bedrock AgentCore runtime, Amazon Bedrock, AWS IAM execution roles, and Amazon CloudWatch Logs to correlate automatically with a failure. Its ability to pattern-match across the entire multi-agent call flow catches errors that would otherwise go unnoticed.
Beyond IAM permission issues, the AWS DevOps Agent is designed to handle the full range of complex failure modes common in multi-agent systems. Such examples include:
- Model throttling under load: When subagents scale up and hit Amazon Bedrock token-per-minute limits, individual subagents begin failing intermittently. The AWS DevOps Agent correlates throttling metrics with agent invocation timelines to identify which model, Region, and traffic spike caused the issue.
- Tool call failures masked by retry logic: If a subagent’s tool integration begins returning errors and the Supervisor Agent silently reroutes, the AWS DevOps Agent surfaces downstream tool errors from logs and connects them to degraded user experience.
- Memory and context issues: If an agent loses access to its memory resource mid-session, responses become incoherent rather than failing outright. The AWS DevOps Agent detects anomalies in response quality patterns and correlates them with configuration changes.
- Cross-agent communication breakdowns: When handoffs between agents fail because of network issues or authentication problems, the AWS DevOps Agent tracks the complete handoff chain and identifies exactly where communication broke down.
Note: Before adopting this architecture, keep the following in mind:
- LLM-as-judge reliability: AgentCore Evaluations uses LLM-based scoring, which lacks ground truth. Treat scores as signals, not absolute measures. Calibrate evaluators with subject matter experts to align automated judgments with human expectations in your domain.
- Service maturity: AWS DevOps Agent is actively evolving. Currently, webhook credential generation is done through the console, but Agent Space creation and management can be automated with the AWS CDK and the AWS SDK.
- Latency trade-offs: Online evaluation adds processing overhead. Lower sampling rates reduce this overhead but may miss edge cases. Tune your sampling rate based on your traffic volume and how comprehensively you need to cover the interaction space.
- Security: Careful IAM policy configuration is required. The AWS DevOps Agent needs broad read access to logs and metrics, scope permissions appropriately while making sure it has access to everything needed to trace cross-service failures.
- Responsible AI controls: For production deployments, complement evaluation with Amazon Bedrock Guardrails to enforce content filtering, denied topics, grounding checks, and PII redaction inline on every response. Evaluations catch quality drift over time. Guardrails help prevent harmful outputs in real time.
Conclusion
Deploying agents to production is only the start. This dual-monitoring approach, quality and infrastructure, gives teams the feedback loop they need to improve continuously. AgentCore Evaluations monitors quality. AWS DevOps Agent investigates infrastructure. Together, they turn production data into specific improvements.
Our airline reservation system, built on the Swarm pattern with a Strands agent and deployed to AgentCore, demonstrates that this dual-monitoring approach is practical, scalable, and effective. The result is faster incident resolution, higher policy compliance, and an iterative improvement cycle grounded in real production behavior.
Whether you’re building your first multi-agent system or scaling an existing deployment, the same principles apply: measure quality continuously, investigate failures autonomously, and let production data drive your next iteration.
Ready to get started?
- Check out our Open Sourced Code to demo our dual-layer monitoring architecture for multi-agent systems.
- Explore AgentCore for agent deployment and evaluation.
- Learn more about Strands Agents for building multi-agent systems.
- Review the τ-Bench benchmark for evaluating agent architectures. tau-Bench includes a tau-airline domain that benchmarks exactly the kind of tool-calling and policy-following behaviors our system requires, making it a natural fit for validating quality improvements driven by AgentCore Evaluations.